Abstract: The proposed work is to extensively evaluate if a user is depressed or not using his Tweets on Twitter. With the omni presence of social media, this method should help in identifying the depression of users. We propose an Optimized Hybrid Neural Network model to evaluate the user tweets on Twitter to analyze if a user is depressed or not. Where Neural Network is trained using Tweets to predict the polarity of Tweets. The Neural Network is trained in such a way that at any point when presented with a Tweet the model outputs the polarity associated with the Tweet. Also, a user-friendly GUI is presented to the user that loads the trained neural network in no time and can be used to analyze the users’ state of depression. The aim of this research work is to provide an algorithm to evaluate users’ sentiment on Twitter in a way better than all other existing techniques.
Keywords : Depression, Neural Network, Twitter, Polarity, Social Media
I. INTRODUCTION
D
epression is a common mental health condition, it generally constitutes prolonged sadness and lack of interest towards activities that one enjoys doing normally, followed by incompetence to carry out tasks that are carried out routinely for at least a few weeks. According to studies, there are multiple reasons for depression. People dealing with it often have several problems such as:• Lack of energy to do routine tasks, physical lethargy • Inability to sleep properly
• Loss of appetite • Anxiety
• Shortened concentration towards tasks • Inability to take decisions
• Feeling of guilt for no reason
In extreme cases, it may lead to self-harm, that in turn may lead to loss of one's life.
One of the common illnesses that is currently prevalent around the world is depression, claiming around 322 million people. Several studies have confirmed that women are more affected than mean due to depression.
Depression is often ignored and not considered as a serious mental health issue due to the stigma attached to mental illness. Unless voluntarily declared by the person suffering due to depression, it is mostly ignored. Around 75% of people suffering due to depression remain unnoticed and untreated in developing countries. Around 1 million people suffer from it each year. It is a serious mental condition and needs to be
Revised Manuscript Received on August 05, 2019.
Dhamini Poorna Chandra, CSE, M S Ramaiah Institute of Technology, Bangalore, India.
Dr. S. Rajarajeswari, CSE, M S Ramaiah Institute of Technology, Bangalore, India.
treated. If not treated it may claim the depressed person's life. 1 in every 13 people suffer from depression globally. An estimated 15 % of people will have an episode of depression in their lifetime.
With the advent of the internet and the widespread usage of Social Network Sites (SNS), people often tend to express their opinion, state of mind, experiences, grieves, happiness on social media. Nowadays people spend more time on their phones, especially social media when compared to anywhere else. This can be used as a fertile ground to understand the state of mind of the user. The presence of a huge amount of data on social media can be exploited by applying various sentiment analysis methods to identify users who are depressed.
Depression on Twitter can be classified into two types: • Tweet level
• User level
In Tweet level, individual tweets are considered and labeled as depressed or not. In user-level, the history of user tweets is considered to identify if a user is depressed or not. A. Challenges associated with using twitter
The content present on Twitter pose a lot of challenges as mentioned below:
• The content posted on Twitter consists of a lot of spelling mistakes.
• Due to the limitation of 140 characters, the content posted online usually consists of abbreviations, shorthand, emoticons and slang to fit the content within the 140-character limit. That makes it difficult to analyze.
• The data present on Twitter consists of a lot of noise in the form of incorrect English, grammatical mistakes and wrong spelling.
• Also, users tend to use a lot of punctuation in order to emphasize their feelings.
• The content may also contain a topic that is out of context from our analysis.
It is very important to consider the challenges posed by Twitter before proceeding with our analysis. Care should be taken to limit or overcome these challenges.
B. Reasons for choosing Twitter
There are several reasons for choosing twitter, they are listed below:
• Twitter consists of rich text content. Because the majority of the content posted on twitter is in the form of text. • Each Tweet has a limit of 140 characters that is helpful in analyzing and getting quick results.
Twitter provides user-friendly Application Programming Interface (API) to fetch tweets for our experimentation. C. Motivation
An Optimized Hybrid Neural Network Model for
Detecting Depression among Twitter Users
An Optimized Hybrid Neural Network Model for Detecting Depression among Twitter Users
Depression is often an ignored health condition. Unlike mood swings and emotional challenges that are short lived, it lasts for a longer duration. The affected person may suffer from several issues such as functioning poorly at work or in academics. They also tend to have less interaction with family and friends. Several cases of depression have led to suicide sue to the lack of being identified. Around 8 million people die each year due to suicide. It is the second leading cause of death among teenagers and adults below 30 years of age. As stated by WHO (World Health Organisation) as on 22nd March 2018 more women suffer from depression when compared to men. Traditional methods followed by psychiatrists are more error-prone hence there is a need for techniques that minimize human intervention and take the presence of a person's online behaviors in identifying depression.
D. Traditional Method for Identifying Depression Traditionally the Patient Health Questionnaire PHQ-9 questionnaire was used as a tool to identify depression among people. The person at risk of depression was presented with a list of nine questions that were used to assess the mental health of the patient. PHQ-9 questionnaire was used to assess the severity of depression and not just as a tool for screening depression. Each question consists of four options and the user had to choose one among the available options. Each option was given a score between 0-3. 0 is the lowest and 3 being the highest. The options are listed below:
•0 - Not at all •1 - Several days
•2 - More than half the days •3 - Nearly every day
The questions were listed below:
1.Lack of interest or no pleasure in doing routine tasks? 2.Feeling unhappy, low or depressed?
3.Difficulty in falling asleep or oversleeping? 4.Lack of energy or prolonged tiredness?
5.Loss of hunger or overeating or frequent feeling of hunger? 6.Feeling of guilt or failure?
7.Trouble concentrating on anything and everything? 8.Feeling of anxiety or restlessness or talking to oneself
regularly?
9.Feeling of self-harm, suicide or ending your life?
The person at risk of depression was asked to answer the following question and the score was computed. The severity of depression was computed based on the score, a score between 0 to 4 meant that the person showed no signs of depression, score between 0 to 5 showed mild symptoms of depression, score between 10 to 14 indicated moderately severe depression and score between 20 to 27 indicated severe signs of depression and required immediate medical attention.
The PHQ-9 questionnaire is a highly efficient tool in identifying the severity of depression but often require the person to take up the questionnaire. Unless self-reported by the patient under depression this method cannot be applied. PHQ-9 questionnaires are popularly used among psychiatrists to assess if a person is depressed or not.
Traditional methods pose several limitations like the person must take up the PHQ questionnaire. There is a tendency that the person may be ignorant and choose the wrong options. The history of the user's state of mind cannot be taken into account.
II. LITERATUREREVIEW
There are various types of Sentiment Analysis that can be done on that data that needs to be analyzed. Most of the times it may not be sufficient to know just the polarity of the text rather, the emotion or intent may provide more clarity about the data being analyzed.
• Fine-Grained Sentiment Analysis: In this approach other than determining the usual positive, negative and neutral polarity, highly positive and highly negative polarity are also determined. For example: most likely will be classified as highly positive and never will be classified as highly negative.
• Emotion Detection: In this technique, along with determining the polarity, the emotion behind is also determined like joy, grief, depressed, etc.
• Aspect-Based Sentiment Analysis: Often it may not be sufficient to know the polarity/sentiment alone. It may be necessary to know what aspect/feature is being discussed. This is mostly useful for companies that are trying to understand what aspect of their product/service their customers are happy/unhappy about.
• Intent-Based Sentiment Analysis: In this approach, the intent/notion behind a user opinion is analyzed i.e., not just what the user typed but also the intention behind the statement.
Feature engineering is the main concept employed in majority of the studies conducted to identify mental illness expressed on social media. The most popular and widely accepted method for feature engineering is to extract lexical features with the help of Linguistic Inquiry Word Count (LWC) lexicon that consists around 32 categories of psychological constructs [1]. These lexicons have been helpful in key feature extraction mechanism in determining insomnia [2], postpartum depression [3], depression [4] and post-traumatic stress disorder (PTSD) [5]. To identify these mental disorders features had to be extracted such that they overlap with each other while remaining exclusive to a disorder.
The content posted by users on Twitter is unstructured. Due to this nature, it becomes challenging to work with data extracted from these platforms. Character n-gram models are one such model that could be viewed as an inherent technique to reduce the shortcomings posed by unstructured data. Taking into account of such language models in classification tasks using tweets, a unigram and character n-gram language model [6] was used to extract features to detect users at risk of several mental disorder namely PTSD, bipolar disorder, depression and seasonal affective disorder (SAD). According to the procedure mentioned by Coppersmith et al. [6], self-reported data about PTSD was collected from twitter by “The Computational Linguistics and Clinical Psychology (CLPsych) 2015 shared task”. The dataset of the self-reported users were provided to the participants of the shared task. Around 3200 posts were obtained using the Twitter API for each of the users in the dataset.
Likewise, character n-grams are also the key feature extraction mechanism in identifying mental condition such as attention deficit hyperactivity disorder (ADHD), and nine other mental disorder [7], that also includes rare mental health
conditions such as
supervised topic modeling techniques [9] and topics extracted from clustering methods namely Word2Vec and Glove Word Cluster [10] are more dependable in terms of identifying users suffering from various mental condition. Kouloumpis et al. [10] proposed a technique where the hashtag in tweets classified as positive and negative. His focus was on uncovering the regularities practiced by Twitter users.
Stationed on the features extracted using supervised LDA, supervised anchors, lexical Term Frequency and Inverse Document Frequency (TF-IDF) and a combination of all, Resnik et al. [11] created a 16-system model. That ranked 1st in the CLPsych 2015 shared task. A linear classifier was developed by Preotiuc-Pietro et al. [12] using the user metadata and features from the data provided by CLPsych 2015 that could predict users at-risk of one of the mental conditions. The bag-of-words approach was used to aggregate the word counts and topics that were extracted from the clustering methods and metadata from the twitter profile of users.
Aston et al. [13] studied the problems associated with performing sentiment analysis on Twitter data streams. They evaluated numerous techniques with the limitation of memory and processing time. Character n-gram was used to represent tweets. For each gram the top N features were chosen, thereby reducing the enormous number of features. Six different evaluation algorithms namely, Chi-Squared, Filtered Feature, Gain Ratio, Info Gain, One R, and relief were used for selecting the top features. This technique was able to classify a tweet as subjective or objective with 0.24 error rate and F-score of 0.85 .The subjective tweets polarity was determined with 0.23 error rate and F-score of 0.78.
The performance of individual classifiers can be improved by combining classifiers, this technique is known as ensemble classifiers. Lin and Kolcz [14] exercised this concept on a huge twitter dataset. LR classifiers were combined linearly and were trained using hashed byte 4-gram and applied ensemble with varied sizes that were formed by different model and trained on various datasets. This technique improved the accuracy of sentiment analysis. One downside of this approach was that it was evaluated using only one algorithm with a lone dataset.
Boot-strapping ensemble framework was proposed by Hassan et al. [15], it is considered a different approach. Data sparsity class imbalance and representational richness issuers could be copied by this framework along with twitter sentiment analysis. Some of the common features namely parts of speech tagging, unigram and bigram we used. In order to determine the overall sentiment, Lexicon-based methods consist of lists of words annotated by their polarity (positive, negative or neutral) or polarity score (positive number or a negative number). The edge of this technique is that it does not require training dataset. However, this technique is not often used in Twitter Sentiment Analysis due to the uniqueness and dynamic nature of data present in twitter with the emergence of hashtags and expression in a timely manner. SentiStrength developed by Thelwal et al. [16] is a popular lexicon-based algorithm for social media. SentiStrength is highly efficient in identifying the sentiment strength of informal text that includes lexicons that contain words frequently used social media words and phrases. SentiStrength comprises of a lexicon of 700 words, it also recognizes emoticons, supporting words and negations while
analyzing the sentiment of a text. Comments from MySpace was used to test the algorithm initially. Later Thelwal et al. [17] extended the algorithm by adding idioms and new sentiment words to the lexicon and applied emphatic lengthening boosting its strength. Many machine-learning techniques were compared against SentiStrength and tested on 6 different datasets that include dataset from twitter.
A three-step technique was proposed by Ortega et al. [18] for analyzing sentiment on Twitter. In the first step, the data as pre-processed and the polarity was detected in the second step. The rule-based classification was performed in the last step. Detection of polarity using rule-based classification was performed based on WordNet and SentiWordNet. When evaluated on the “SemEval 2013” dataset [19] this technique managed to achieve decent accuracy. But, the effectiveness of this algorithm was not determined by comparing it against existing algorithms. Reckman et al. [20] used the same dataset (SemEval 2013) to assess a rule-based system. This system was composed of handwritten rules, where rules had a pattern. That performed significantly well on Twitter sentiment analysis.
Unsupervised sentiment analysis based on emotional signals was proposed by Hu et al. [21]. These emotional signals were branched into two classes namely emotion indicators and emotion correlators.
The concept used to build these signals was orthogonal nonnegative matrix tri-factorization model. This approach was evaluated by using two different datasets and this framework was found to be effective. SentiCircles was one such lexicon-based approach used for twitter sentiment analysis. Firstly, the pre-assigned scores and the polarity of words in sentiment lexicons were updated by taking into account the patterns of words under a different context. This framework was tested using three different datasets. It proved to be extensively effective and outperformed methods based on SentiWordNet.
Ghiassi et al. [22] proposed an interesting hybrid method that combined n-grams and dynamic artificial neural network. Two classifiers namely SVM and Dynamic Architecture for Artificial Neural Networks (DAN2) were built by considering emoticons and tweets that consisted the word hate, love or their synonyms as their feature. This method was evaluated on a corpus of tweets crawled using “Justin Bieber” as the subject. DAN2 outperformed SVM in the test conducted. Kumar and Sebastian [23] presented an approach where they combined log-linear classifier along with dictionary-based method that computed the semantic orientation of adjectives, verbs, and adverbs. The overall sentiment orientation of the tweet was then calculated using a simple linear equation. Also, pre-processing tasks such removal of URL's, hashtags, correction of spellings, removal of replies and parts of speech tagging were performed. Emoticons were substituted by their polarity. This approach could effectively detect the polarity of the tweet as claimed by the authors.
Considering the MapReduce Framework, Khuc et al. [24] created a co-occurrence matrix of bigram phrase. In order to improve the accuracy, this technique combined a lexicon-based approach with a classifier. The cosine similarity between the words was calculated and the edges that had low cosine score were
An Optimized Hybrid Neural Network Model for Detecting Depression among Twitter Users
that included a classifier. The Online LR approach was used as the machine learning algorithm. The simple lexicon-based classifier was outperform by this hybrid technique.
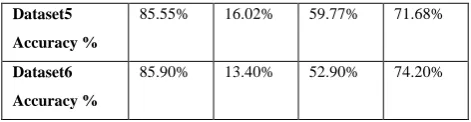
Khan et al. [25] proposed a 3 step process framework where the final step was composed of a hybrid Twitter sentiment analysis named “TOM: Twitter opinion mining framework using a hybrid classification scheme”. Data were acquired as the first step using the Twitter API, the tweets were processed in the next step. Preprocessing includes identifying slang, abbreviations, stemming, correction and removal of stop words. The pre-processed Tweets were fed to the sentiment classifier. In the final step different approaches like Enhanced Emotion Classifier (EEC), SentiWordNet Classification (SWNC) and Polarity Classification Algorithm (PCA)/Improved Polarity Classifier (IPC) were used. The final output showed that the hybrid model performed better than the individual classifiers. The accuracy attained by this model was 85.7%. Khan et al. performed their analysis of 6 different datasets. The description of the dataset is summarized in table 2.1. The results are summarized in table 2.2.
[image:4.595.309.545.49.110.2]Machine learning algorithms requires data that is annotated, it is a major limitations of this technique. Also, this annotated data is required in a large number for the algorithm to perform better. Greater the number of annotated data, better the performance of the machine learning technique. But annotation is a tedious and time-consuming process and if the annotation is wrong then the performance of the model reduced drastically. This downside could be overcome by using the Twitter social graph, with the inference that people influence each other. A semi-supervised method known as label propagation was proposed where labels are dispersed among nodes using connected graphs.
Table 2.1: Summary of datasets used by Khan et al. Dataset name Twitter Query
string
Total no. of
tweets
Dataset 1 Imran Khan 99
Dataset 2 Nawaz Sharif 105
Dataset 3 Dhoni 100
Dataset 4 Tom Cruise 300
Dataset 5 Pakistan 512
[image:4.595.57.280.455.618.2]Dataset 6 America 1000
Table 2.2: Summary of the study conducted by Khan et al.
Approach TOM EEC IPC SWMC
Dataset1
Accuracy %
88.8% 21.21% 65.6% 61.62%
Dataset2
Accuracy %
82.86% 23.8% 55.24% 68.57%
Dataset3
Accuracy %
86.00% 23.00% 48.00% 67.00%
Dataset4
Accuracy %
85.00% 8.00% 44.33% 75.0%
Dataset5
Accuracy %
85.55% 16.02% 59.77% 71.68%
Dataset6
Accuracy %
85.90% 13.40% 52.90% 74.20%
Initial work on applying label propagation methods for Twitter sentiment analysis was proposed by Speriosu et al. [26].
The proposed method used Twitter follower graphs. For the construction of the graph; user’s tweets, unigrams, emoticons, and hashtags were used as models. Lexicon-based approach and MaxExt Classifier were outperformed by the proposed label propagation method. This method was successful in obtaining an accuracy of 71.2%.
The social relationship of users was used to analyze Twitter sentiment by Tan et al. [27]. The experiment proved that the same sentiment was shared by related users. Analytically they also proved that two users sharing the same sentiment were likely to be connected on social platform network. Tweets about politicians were evaluated by the authors using this method and proved that user-level sentiment analysis could be reasonably improved by taking into account the connection of users on the social network.
Individual activities in the form of log-data were collected and approaches that utilize this objective information were used to predict depression. They extracted textual data captured in various forms such as notes, essays, and memories written by the person, using methods like Latent Dirichlet Allocation (LDA). It is a popular machine learning topic extraction technique [28]. A statistical model was used to analyze these extracted topics, an r value of 0.45 was the estimate obtained for college students suffering from depression and neuroticism. In 2011 a few profiles were selected from mogul Facebook and updates that were in the form of “status updates” were analyzed, using the rules specified in Criteria for Major Depressive Disorder & Depression Episode (DSM) by American Psychiatric Association. Out of 200 profiles that were selected 50 people i.e., 25% showed indicated signs of depression and around 2.5% showed major episodes of depression.
Several pieces of research have been conducted to identify mental disorder by analyzing user social network and studies have improved this understanding. These studies have been made of samples collected from the public often in the form of surveys, self-declaration, and observation. The collected sample represent a small population and not necessarily a large population.
Collecting long term and a large number of data has been difficult given the diversity of platforms present and different privacy concerns. Nevertheless, using social media in order to identify mental illness is still in its infancy.
A. Related Work on Machine-Learning Techniques Go et al [29] treated the issue of Twitter sentiment analysis as a binary classification problem. They classified tweets as positive or negative. In order to overcome the limitations of manual tagging of Twitter sentiment, a machine learning classifier was built
consisting of 1,60,000 messages that were equally sectioned into positive and negative polarity. Features namely bigrams, unigrams, and POS tags were used. According to their study an accuracy of 82.7% was achieved by NB with bigrams as features that was the highest among other technique.
Barbosa and Feng [30] proposed a two-step classifier in order to tackle twitter sentiment analysis. In the first step, tweets were analyzed to identify if they were opinionated or not, and in the next step, these tweets were classified as positive or negative. They collected a dataset of 2,00,000 tweets after screening from multiple tweets classification tools. SVM classifier obtained the best result with 81.9% for objectivity detection and 81.3% for prediction of polarity.
In order to improve the accuracy of classification Aisopos et al [31] proposed an approach that used n-gram graphs. 3 million tweets were evaluated using MNB and C4.5 tree classifier trained 4-gram graph with an accuracy of 66.77%.
[image:5.595.313.541.240.440.2]Jiang et al [32] employed the concept of aspect-based twitter sentiment analysis. In order to identify if a term was relevant to a specific object, they proposed a method that was a combination of target-independent and target-dependent features along with rules that were manually defined. Binary SVM was used for classification of polarity and determination of subjectivity. Their model achieved an accuracy of 85%. Table 2.3 summarizes the work discussed under Machine learning methods.
Table 2.3: TSA accuracy using supervised algorithms
Study Algorithm Accuracy
Go et al. [29] TSA NB, MaxEnt, SVM
82.7%
Barbosa and Feng [30]
SVM 81.3%
Aisopos et al. [31]
TSA MNB, C4.5 tree
66.77%
Jiang et al. [32] SVM 88%
Several experiments were performed on our dataset in order to show that our proposed model outperformed all. Various existing techniques were used to analyze our dataset and their accuracy was calculated. The techniques along with their accuracy and F1 score are discussed below. Popular feature extraction methods such as Bag of Words (BoW), Word to vector (w2v) and Term Frequency and Inverse Document Frequency (TF-IDF) were used. The classification algorithms are run on the dataset to classify the tweets as Positive or Negative.
The harmonic mean of precision and recall is called F-score. It is also known as F1-Score/ F-Measure.
Accuracy is defined as the proportion of true results from the entire result.
Where, TP = True Positive, FP = False Positive, TN = True Negative, FN = False Negative, TNu = True Neutral, FNu = False Neutral
Before performing any analysis on the dataset, it is pre-processed in order to get results with higher accuracy. The preprocessing steps include:
•Removing handles •Remove punctuation
•Remove Numbers and Special characters •Remove short words
[image:5.595.56.284.384.503.2]After the data is preprocessed it is tokenized using PorterStemmer so that the data can be used for machine learning.
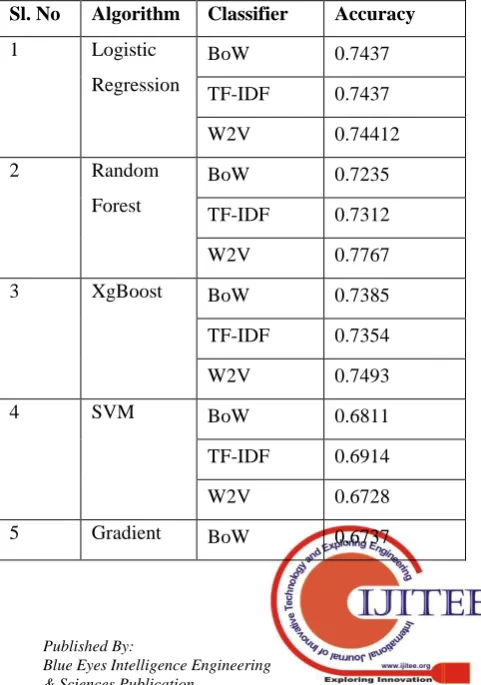
Table 2.4 summarizes the accuracy results on the user tweets when machine learning algorithms were applied. And the same is pictorially represented in Fig. 2.1.
Fig. 2.1: Comparison of accuracy of machine learning algorithms
Table 2.4 Machine learning algorithms on user Tweets Sl. No Algorithm Classifier Accuracy
1 Logistic
Regression
BoW 0.7437
TF-IDF 0.7437
W2V 0.74412
2 Random
Forest
BoW 0.7235
TF-IDF 0.7312
W2V 0.7767
3 XgBoost BoW 0.7385
TF-IDF 0.7354
W2V 0.7493
4 SVM BoW 0.6811
TF-IDF 0.6914
W2V 0.6728
[image:5.595.306.543.487.821.2] [image:5.595.307.548.488.831.2]An Optimized Hybrid Neural Network Model for Detecting Depression among Twitter Users
Boosting Classifier
TF-IDF 0.6765
W2V 0.7282
6 Naïve
Bayes
BoW 0.7400
TF-IDF 0.7400
W2V 0.6676
III. PROPOSEDDATAACQUISITIONTECHNIQUE Gathering the required data is a challenging task. Here the data is required in 3 forms. Firstly, publicly available labeled Twitter dataset related to depression was collected. In the second phase, users were asked to fill a Google form that requests the user to fill a few fields, it also required the user to mention their Twitter usernames along with other details. In the third phase, Tweets were collected from the respective user Twitter accounts provided they were public. The data collected in the first phase is fed to the model to train the Neural Network. Once trained, the data collected from phase two and phase three are fed to the model to be analyzed. These results are compared to analyze the accuracy of the model. In the survey taken up by users and they were asked to fill a Google form consisting of a set of questionnaires. The captured data is saved and exported to a .csv file. The contents of the form are as follows:
• Name • Age
• Link to Twitter handle
• Short note about their current state of mind • Main reasons for their depressed state of mind To fetch tweets from Twitter a library named “Tweepy” is used. In order to fetch the tweets using Tweepy, 4 keys are required. They are customer_key, customer_secret, access_key and access_secret. For this, we require a developer account and a twitter app should be created. The detailed steps are mentioned in https://developer.twitter.com.
IV. PROPOSEDFRAMEWORK
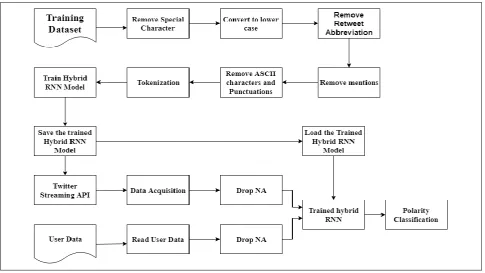
Training any neural network is easy but importance should be given to the collection and construction of the training dataset. Training dataset here refers to the labeled dataset collected using that our model learns to predict. Our project comprises of 6 modules that are used to analyze if a user is depressed or not. The modules are sectioned and build such that they give results with high precision. The system architecture of the proposed system is shown in Fig. 4.1 and the flow of data within the system is shown in Fig. 4.5. The activities performed by each module is listed below.
Module 1: Data cleaning
Module 2: Construct a Neural network model
Module 3: Train the Neural Network using the training data Module 4: Fetch the Data from Twitter and analyze polarity Module 5: Determine the polarity of the text present in the form filled by the user
Fig. 4.1: System architecture of the Depression Detection Model
[image:7.595.62.548.446.719.2]An Optimized Hybrid Neural Network Model for Detecting Depression among Twitter Users
The dataset collected during the first phase was publicly available. The data set consisted of 1,00,000 tweets pertaining to different users. The dataset was divided such that 80% of the data was used for training the model and 20% was used for verifying the model. During the training phase the model is fed with the dataset and trained. The data for the training phase is selected in a random fashion. So that the diversity of the data is even.
● Reading training dataset:
The dataset collected during the first phase is saved in an excel sheet. This data is first read so that it can be analyzed. The dataset consists of 21 columns, it includes the username, serial number, tweet id, user time zone, sentiment, text, etc. But our model does not require these fields. Only two columns are required for our model, the "text" and "sentiment" column, and they are read.
● Cleaning and Pre-processing:
Cleaning and pre-processing is an important step that needs to be performed carefully before carrying out any experiment. Here the text that needs to be cleaned is the one present under “text” column. Normally tweets may contain a lot of noise in the form of punctuation and retweets. Hence, these are removed from the “text” before they can be fed to the raining model.
● TensorFlow data structure:
The neural network is generated using tensor flow. A sequential neural network is created, and layers are embedded to it. The type used here is CNN and LSTM.
● Implement model:
Once the Neural network is created then it can be trained using out dataset. Towards the end of the implementation of the model consists of layers that include embedding layer, spatial dropout layer, LSTM and dense layer.
● Split dataset:
Before the model is trained the dataset is divided into two sets, one set for training the model and the other for validating the trained model. The training data constitutes 80% and validation data constitutes 20%. So, the size of training data and test data after division 79991 and 19998 respectively. The division is done randomly with a random state of 42. ● Train model:
The model is trained with a batch size of 32 user tweets and with an epoch of 50. The model is trained using a dataset of 79991 that were cleaned prior to being fed to the model. The model is trained in a sequential recursive manner. Once the system is trained it is ready to be fed with actual user data to predict the polarity of the tweets fetched from Twitter API and the data collected from the forms that the user has filled. ● Validate model:
The trained model is validated using the data that was split. 20% of the data is used for validating the model.
The data obtained from Twitter using the Twitter API is fed to the trained model during the prediction phase. The polarity of the analyzed tweets is produced as output of this phase. For each tweet retrieved the model computes the polarity. The sentiment indicated by the majority of the tweets is considered as the polarity of users. Towards the end of this phase, each user is declared to express either positive, or negative polarity. The model processes and computes the tweets as belonging to one of the polarities.
A. Implementation
In this section, the composition of each model, their characteristics and the output produced by each module is discussed.
Module-1: Data Cleaning
In the first module, the data is cleaned so that it can be presented to the second module in order to train the neural network. The tweets are preprocessed in order to remove noise from the data. Towards the end of preprocessing the data is free of noise. The steps involved in data cleaning are listed below.
Step 1: Import the training data
Step 2: Select only columns of interest (here “Sentiment” and “SentimentText” column)
Step 3: Map values in Sentiment with 0: Negative and 1: Positive
Step 4: Remove extra space at the beginning and end of Sentiment text
Step 5: Remove retweet abbreviation Step 6: Remove stop words
Step 8: Remove mentions and special characters Step 9: Remove Ascii characters and punctuation Step 10: Tokenize the text
Step 11: Convert the text to a sequence of integers
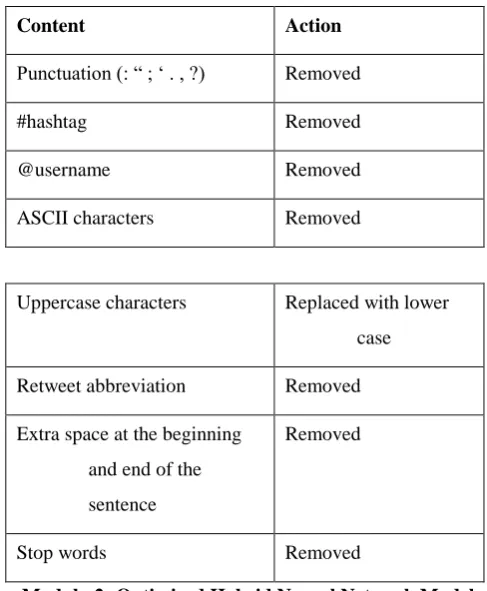
[image:8.595.304.548.397.693.2]Once this is done the data is ready to be fed to the next module. The unwanted content removed from the text is tabulated in table 4.1.
Table 4.1: Content removed during data cleaning
Content Action
Punctuation (: “ ; ‘ . , ?) Removed
#hashtag Removed
@username Removed
ASCII characters Removed
Uppercase characters Replaced with lower
case
Retweet abbreviation Removed
Extra space at the beginning and end of the sentence
Removed
Stop words Removed
Module-2: Optimized Hybrid Neural Network Model The optimized hybrid neural network is composed of different layers and the summary of it is obtained by compiling the model. The compilation is done such that the proposed neural network
for constructing the neural network is listed below. Step 1: Design the Neural Network architecture
1.1 Initialize the ‘Sequential’ model 1.2 Add ‘Embedding’ layer
1.3 Add ‘Spatial Dropout 1D’ layer 1.4 Add ‘CNN’ layer
1.5 Add ‘maxpooling’ layer 1.6 Add Dropout layer 1.7 Add Dense Layer 1.8 Add Dropout layer
1.9 Add activation layer “ReLU” 1.10 Add the first ‘LSTM' layer 1.11 Add second ‘LSTM’ layer
1.12 Add ‘Dense’ classification layer with 2 output neurons with ‘softmax’ activation function.
Step 2: Compile the model with “binary_crossentropy” loss, optimizer as “adam” and metric as “accuracy”. Step 3: Get the summary of the module by calling the
summary() function
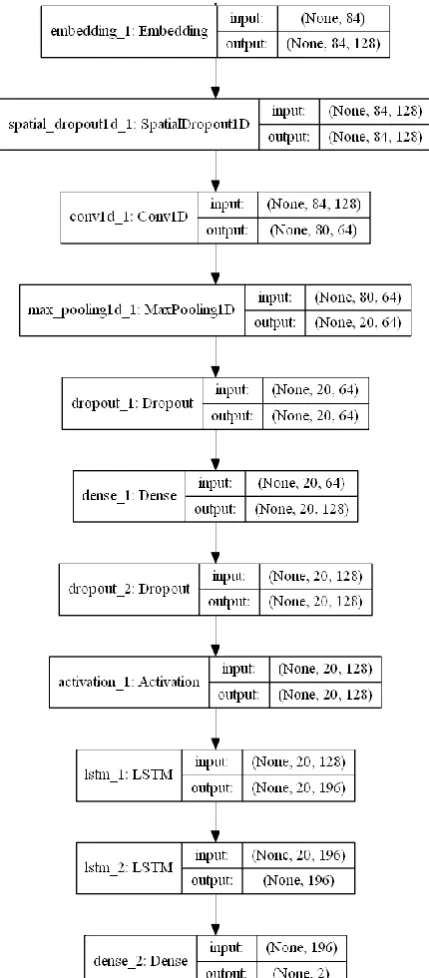
Step 4: Visualize the optimized hybrid neural network model The visualization of the optimized hybrid neural network is as
shown in Fig. 4.3.
[image:9.595.319.534.49.539.2]The optimized hybrid neural network consists of several layers. At start the sequential layer is initialized indicating that the data to be processed is sequential. In the second layer Embedding is added by specifying the maximum number of features, the embedded dimension and the length of the input. In the third layer SpatialDropout1D is added with a value of 0.4 that indicates the fraction of features to be dropped during each epoch. CNN is added in the fourth layer by specifying the number of filter, the size of the kernel, the padding technique to be used, the activation technique used and the number of trides. After CNN layer Maxpooling layer with size of 4 is added, here the features are compressed by 4 and it constitutes the fifth layer. After maxPooling layer, two layers of LSTM are added with output-dimension, return-sequence and recurrent-dropout. LSTM forms the sixth and seventh layer. Finally the Dense layer is added with output dimension of 2 and sigmoid activation. All the layers are then compiled and the summary of the model is printed as shown in Fig. 4.4.
An Optimized Hybrid Neural Network Model for Detecting Depression among Twitter Users
Fig. 4.4: Summary of optimized hybrid neural network model
Module-3: Training Model
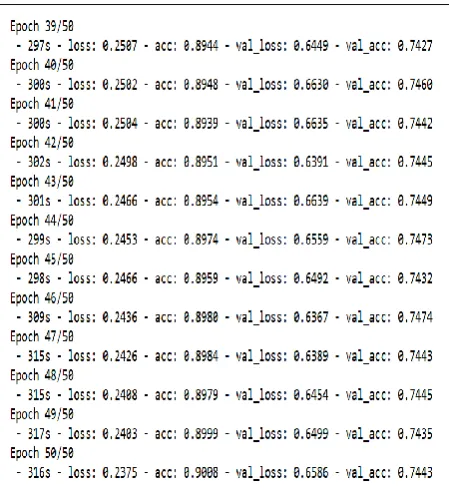
In this module, the output categorical values are converted to numerical values using the get_dummies() function. Once this is done the dataset is divided randomly into test-set and training set. The model is trained with some data and tested with some data and the process is repeated. Once the data set is divided then batches are created, and the epochs are specified. The model is trained over 50 epochs. With a batch size of 32 user tweets. Towards the end of the training process the accuracy of the model is 90.08%. The history of the training process is as shown in Fig. 4.5.
Fig. 4.5: Training history of optimized hybrid neural network model
The steps for training the model is listed below: Step 1: Convert the ‘sentiment’ values to integers
Step 2: Divide the dataset into test-set and training-set Step 3: Train the model by defining the training-set, epochs, batch size, verbose level, and test set
Step 4: Save the model
Module-4: Fetch Tweets and Predict Polarity
“Tweepy” is used to fetch tweets from twitter. The process to fetch tweet is listed below.
Step 1: Using the tweet developer keys (consumer_key, consumer_secret, access_key, access_secret) the tweets are fetched and saved in a separate column against each user. Step 2: Drop rows where the twitter accounts are not specified Step 3: Pass the tweets fetched for each user to the trained model to predict the polarity.
Step 4: Once the prediction is done, assign the overall polarity of all the tweets fetched for each user by considering the maximum polarity of the tweets obtained.
The application is authorized by making use of tweepy’s OAuthHandler and passing customer key and customer secret, this is required in order to authorize the application. Once the application is authorized the access tokens are passed to “auth” using which tweets are fetched. After the authentication process is complete, the API is initialized by passing “auth” as a parameter. The tweets are fetched by passing the username of the twitter user and saved to a variable named tweets, if there are no tweets or the username does not exist then “None” is added as the tweets for the user. For each username specified in the Google form the tweets are fetched. If the length of tweets fetched is greater than 1 then the tweet is retained else “None” is added.
We then drop rows which have “na” or “none” as username or tweets, where “na” stands for not available. Users add “na” against username if they do not have twitter handle and “None” is added if there are exits no twitter handle with username provided or if there are no tweets for the given username. This step is required to drop rows that do not add value for our analysis.
The fetched tweets are tokenized and padded to the same shape as embedding. Once the tweets are padded it is given to the trained neural network model to get the polarity. The trained model is given one tweet at the time for prediction. If the value returned by the model is 0 then the polarity of tweet is negative, else if 1 is returned then the polarity of tweet is positive. After the polarity of all the tweets fetched for a user is computed, the count of negative and positive tweets is computed and maximum count is considered as the overall polarity of the user and saved.
Module-5: User Data Polarity Prediction
In this module the polarity of the data filled by the user in the Google form is predicted by using the trained model to get the polarity. The steps for predicting the polarity of user data is listed below.
Step 1: Specify the column that has the user entered data Step 2: Pass it to the method that predicts the polarity Step 3: Save the predicted polarity in a separate column Module-6: Comparison Module
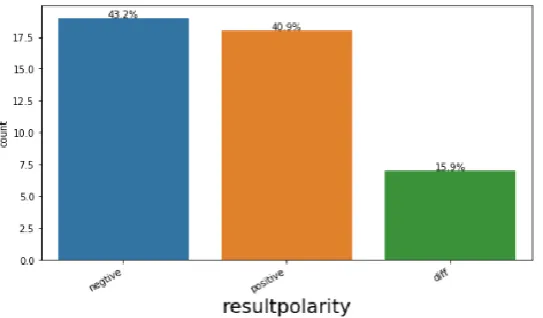
In this module the polarity of the tweets fetched for each user and the polarity of the data collected from the user via Google form are compared to analyze the accuracy of the model. Same count indicates the count of polarity, that are same for tweets fetched form
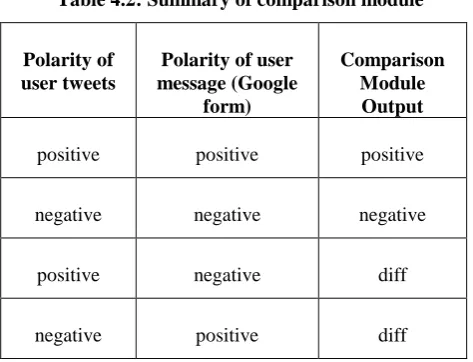
[image:10.595.48.273.482.729.2]Diff count indicates the count of polarity that are different for tweets fetched form twitter and user message entered in Google form. The computation of polarity by module 6 is summarized in table 4.2.
Table 4.2: Summary of comparison module
Polarity of user tweets
Polarity of user message (Google
form)
Comparison Module Output
positive positive positive
negative negative negative
positive negative diff
negative positive diff
V. RESULTSANDDISCUSSIONS
From the detailed study conducted and various experiments performed, our model outperforms all the existing techniques. The accuracy attained by our model is 90.08%. Table 5.1 shows the comparison of accuracy of our algorithm against existing algorithms.
Table 5.1: Summary of existing algorithms vs. our algorithm
Sl. No Algorithm Accuracy %
1 Optimized Hybrid Neural Network
90.08
2 TOM 85.7
3 EEC 23.81
4 IPC 65.66
5 SWNC 75.00
6 Logistic Regression 74.37
7 Random Forest 77.67
8 XgBoost 74.93
9 SVM 69.14
10 Gradient Boosting Classifier 72.82
11 Naïve Bayes 74.00
12 Plain Neural Network 57.19
13 Convolutional Neural Network (Overfit)
92.47
14 Long Short-Term memory 88.89
Also, a line graph is plotted to show the accuracy and loss of the optimized hybrid neural network model, it is as shown in Fig. 5.1 and 5.2.
Exploratory data analysis (EDA) was performed on the predicted depression status of the user tweets and the data collected using Google form. A lot of insights were obtained in terms of the distribution and the concentration of data.
It is very important to perform this analysis in order to get better insights of the distribution of our data. The benefits of EDA are listed below.
1. Obtain maximum insight from the data set 2. Expose the underlying structure
3. Identify the variables of interest 4. Explore the anomalies in the data 5. Analyze outliers
An Optimized Hybrid Neural Network Model for Detecting Depression among Twitter Users
[image:12.595.103.495.60.284.2]Fig. 5.1: Accuracy of the optimized hybrid neural network model
Fig. 5.2: Loss of optimized hybrid neural network model
Fig. 5.3 shows the distribution of polarity of user predicted by our neural network model.
[image:12.595.214.486.576.735.2]
Fig. 5.4 shows the distribution of polarity of user opinion entered in Google form that is predicted using our neural network model. 52.3% of users have given negative opinion while 47.7% of users have given positive opinion about their life.
[image:13.595.183.419.302.444.2]Fig. 5.4: Distribution of polarity of messages
Fig. 5.5 shows the distribution of polarity of user tweets predicted by our neural network model. According to our analysis 50.0% of user tweets show negative traits while 29.5% user tweets have shown positive traits and 6.8% have remained neutral.
[image:13.595.155.487.504.708.2]Fig. 5.5: Distribution of polarity of user tweets
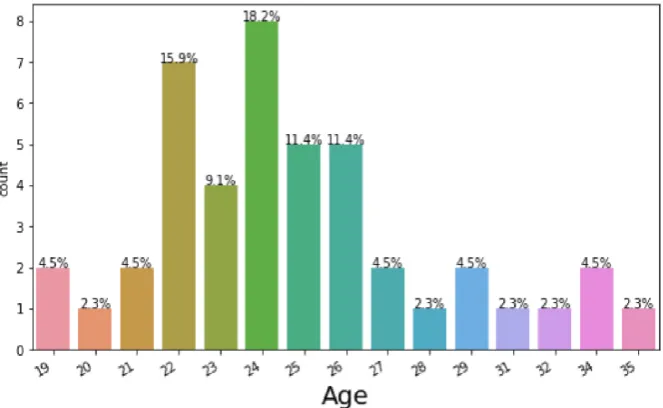
Fig. 5.6 shows the distribution of the user who have participated our survey. Where the highest number of people who have taken up the survey are of the age 24. And users between the age group of 22 to 26 have given more response when compared to other age groups.
Fig. 5.6: Distribution of users who have taken up the opinion survey
An Optimized Hybrid Neural Network Model for Detecting Depression among Twitter Users
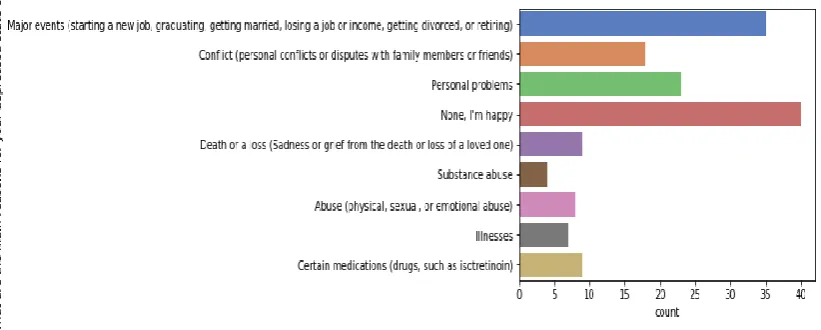
[image:14.595.94.505.131.296.2]starting a new job, getting married, losing a job or income, getting divorced or retiring and Personal problems. While the top third reason for depression is conflict that includes personal conflict or dispute with family members or friends. The least likely reason for depression being substance abuse (addiction to drugs/alcohol)
Fig. 5.7: Distribution of major reasons for depression among twitter users
VI. CONCLUSIONANDFUTUREWORK
The usage of social media has grown drastically over the past few years. Social media has become an integral part of our lives. People often tend to use social media to express their emotions. Twitter is one of the primary social media platforms. A comparative study of existing machine learning techniques to identify depression among Twitter users was performed and the drawbacks of all these techniques were reviewed. In our research work we have demonstrated how Twitter can be used as a reliable tool for detecting depression. We constructed an optimized hybrid neural network model capable of predicting depression among Twitter users with an accuracy of 90.08% that is, more than the existing techniques available for prediction depression. Also, we have developed a user-friendly GUI for the same. We believe that this model could be a valuable tool in depression analysis. To perform sentiment analysis, the proposed system first fetches the tweets from Twitter using Twitter API and feeds it to the hybrid neural network model to predict depression.
In future work, we plan to develop a social media plugin that tracks the users Tweets and provides them an indication of their depression. Thereby predicting depression at earlier stages. We also plan to extend out work to identify depression among Twitter users based on their gender, geographical location and other demographics.
REFERENCES
1. James W Pennebaker, Cindy K Chung, Molly Ireland, Amy Gonzales, and Roger J Booth. The Development and Psychometric Properties of LIWC2007 The University of Texas at Austin 2007.
2. Susan Jamison-Powell, Conor Linehan, Laura Daley, Andrew Garbett, and Shaun Lawson. “I can’t get no sleep”: discussing #insomnia on Twitter. In Conference on Human Factors in Computing Systems- Proceedings, pages 1501–1510, 2012.
3. Munmun De Choudhury. Role of Social Media in Tackling Challenges in Mental Health. In Proceedings of the 2nd International Workshop on Socially-Aware Multimedia (SAM’13), pages 49–52, 2013.
4. H Andrew Schwartz, Johannes Eichstaedt, Margaret L Kern, Gregory Park, Maarten Sap, avid Stillwell, Michal Kosinski, and Lyle Ungar. Towards Assessing Changes in Degree of Depression through Facebook. In Proceedings of the Workshop on Computational Linguistics and Clinical Psychology: From Linguistic Signal to Clinical Reality, pages 118–125, 2014.
5. Glen Coppersmith, Mark Dredze, and Craig Harman. Measuring Post Traumatic Stress Disorder in Twitter. In Proceedings of the 7th International AAAI Conference on Weblogs and Social Media (ICWSM), volume 2, pages 23–45, 2014.
6. Glen Coppersmith, Mark Dredze, and Craig Harman. Quantifying Mental Health Signals in Twitter. In Proceedings of the Workshop on Computational Linguistics and Clinical Psychology: From Linguistic Signal to Clinical Reality, pages 51–60, 2014.
7. Glen Coppersmith, Mark Dredze, Craig Harman, and Kristy Hollingshead. From ADHD to SAD: Analyzing the Language of Mental Health on Twitter through Self-Reported Diagnoses. In Computational Linguistics and Clinical Psychology, pages 1–10, 2015.
8. Margaret Mitchell, Kristy Hollingshead, and Glen Coppersmith. Quantifying the Language of Schizophrenia in Social Media. In Computational Linguistics and Clinical Psychology, pages 11–20, Colorado. Association for Computational Linguistics, 2015.
9. Daniel Preotiuc-Pietro, Maarten Sap, H. Andrew Schwartz, and Lyle Ungar. Mental Illness Detection at the World Well-Being Project for the CLPsych 2015 Shared Task. In Proceedings of the 2nd Workshop on Computational Linguistics and Clinical Psychology: From Linguistic Signal to Clinical Reality, pages 40–45, 2015.
10. E. Kouloumpis, T. Wilson, and J. Moore, "Twitter sentiment analysis: The good the bad and the omg!" ICWSM, vol. 11, pp. 538–541, 2011. 11. Philip Resnik, William Armstrong, Leonardo Claudino, and Thang
Nguyen. The University of Maryland CLPsych 2015 Shared Task System. In CLPsych 2015 Shared Task System. pages 54–60, 2015. 12. Daniel Preotiuc-Pietro, Maarten Sap, H. Andrew Schwartz, and Lyle
Ungar. Mental Illness Detection at the World Well-Being Project for the CLPsych 2015 Shared Task. In Proceedings of the 2nd Workshop on Computational Linguistics and Clinical Psychology: From Linguistic Signal to Clinical Reality. pages 40–45, 2015.
13. Nathan Aston, Jacob Liddle, and Wei Hu. 2014. Twitter sentiment in data streams with perceptron. Journal of Computer and
Communications, 11–16, 2014.
http://dx.doi.org/10.4236/jcc.2014.23002.
14. Jimmy Lin and Alek Kolcz. Large-scale machine learning at twitter. In Proceedings of the 2012 ACM SIGMOD International Conference on Management of Data
http://dx.doi.org/10.1145/2213836.2213958
15. Ammar Hassan, Ahmed Abbasi, and Daniel Zeng. Twitter sentiment analysis: A bootstrap ensemble framework. In Proceedings of the International Conference on Social Computing (SocialCom’13). IEEE
Computer Society, 357–364, 2013.
http://dx.doi.org/10.1109/SocialCom.2013.56
16. Mike Thelwall, Kevan Buckley, Georgios Paltoglou, Di Cai, and Arvid Kappas. Sentiment strength detection in short informal text. J. Am. Soc. Inform. Sci. Technol. 61, 12 (2010), 2544–2558, 2010.
17. Mike Thelwall, Kevan Buckley, and Georgios Paltoglou. Sentiment strength detection for the social web. J. Am. Soc. Inform. Sci. Technol. 63, 1 (2012), 163–173, 2012.
18. Reynier Ortega, Adrian Fonseca, and Andres Montoyo. SSA-UO: Unsupervised twitter sentiment analysis. In Proceedings of the 7th International Workshop on Semantic Evaluation - 2nd Joint Conference on Lexical and Computational Semantics (SemEval’13). Association for Computational Linguistics, 501– 507, 2013.
19. Preslav Nakov, Zornitsa Kozareva, Alan Ritter, Sara Rosenthal, Veselin Stoyanov, and Theresa Wilson. Semeval-2013 task 2: Sentiment analysis in twitter. In Proceedings of the 7th International Workshop on Semantic Evaluation - 2nd Joint Conference on Lexical and Computational Semantics (SemEval’13). Association for Computational Linguistics, 312–320, 2013.
20. Hilke Reckman, Cheyanne Baird, Jean Crawford, Richard Crowell, Linnea Micciulla, Saratendu Sethi, and Fruzsina Veress. Rule-based detection of sentiment phrases using SAS sentiment analysis. In 2nd Joint Conference on Lexical and Computational Semantics (*SEM), Volume 2: 7th International Workshop on Semantic Evaluation, Vol. 2. Association for Computational Linguistics, 513– 519, 2013.
21. Xia Hu, Jiliang Tang, Huiji Gao, and Huan Liu. Unsupervised sentiment analysis with emotional signals. In Proceedings of the 22nd International Conference on World Wide Web (WWW’13). ACM, New York, NY, 607–618, 2013. http://dx.doi.org/10.1145/2488388.2488442
22. Manoochehr Ghiassi, James Skinner, and David Zimbra. Twitter brand sentiment analysis: A hybrid system using n-gram analysis and dynamic artificial neural network. Expert Syst. Appl. 40, 16 (2013), 6266–6282, 2013. http://dx.doi.org/10.1016/j.eswa.2013.05.057
23. Akshi Kumar and Teeja Mary Sebastian. Sentiment analysis on twitter. International Journal of Computer Science. Issues 9, 4, 372–378, 2012. 24. Vinh Ngoc Khuc, Chaitanya Shivade, Rajiv Ramnath, and Jay Ramanathan. Towards building large-scale distributed systems for twitter sentiment analysis. In Proceedings of the 27th Annual ACM Symposium on Applied Computing (SAC’12). ACM, New York, NY, 459, 2012. http://dx.doi.org/ 10.1145/2245276.2245364
25. Farhan Hassan Khan, Saba Bashir, and Usman Qamar. TOM: Twitter opinion mining framework using hybrid classification scheme. Decision Supp. Syst. 57 (Jan. 2014), 245–257, 2014. http://dx.doi.org/10.1016/j.dss.2013.09.004
26. Michael Speriosu, Nikita Sudan, Sid Upadhyay, and Jason Baldridge. Twitter polarity classification with label propagation over lexical links and the follower graph. In Proceedings of the First Workshop on Unsupervised Learning in NLP (EMNLP’11). Association for Computational Linguistics, Stroudsburg, PA, 53–63, 2011.
27. Chenhao Tan, Lillian Lee, Jie Tang, Long Jiang, Ming Zhou, and Ping Li. User-level sentiment analysis incorporating social networks. In Proceedings of the 17th ACM SIGKDD International Conference on Knowledge Discovery and Data Mining (KDD’11). ACM, New York, NY, 1397–1405, 2011. http://dx.doi.org/10.1145/2020408.2020614 28. M. A. Moreno, L. A. Jelenchick, K. G. Egan, E. Cox, H. Young, K. E.
Gannon, and T. Becker, “Feeling bad on Facebook: depression disclosures by college students on a social networking site” Depress. Anxiety, vol. 28, no. 6, pp. 447–455, Jun. 2011.
29. [29] Alec Go, Richa Bhayani, and Lei Huang. Twitter Sentiment Classification Using Distant Supervision. Technical Report. Standford, 2009.
30. Luciano Barbosa and Junlan Feng. Robust sentiment detection on twitter from biased and noisy data. In Proceedings of the 23rd International Conference on Computational Linguistics: Posters (COLING’10). Association for Computational Linguistics, Stroudsburg, PA, 36–44, 2010.
31. Fotis Aisopos, George Papadakis, and Theodora Varvarigou. Sentiment analysis of socialmedia content using n-gram graphs. In Proceedings of the 3rd ACM SIGMM International Workshop on Social Media (WSM’11). ACM, New York, NY, 9–14, 2011.
http://dx.doi.org/10.1145/2072609.2072614.
32. Long Jiang, Mo Yu, Ming Zhou, Xiaohua Liu, and Tiejun Zhao. Target-dependent twitter sentiment classification. In Proceedings of the 49th Annual Meeting of the Association for Computational Linguistics:
Human Language Technologies - Volume 1 (HLT’11). Association for Computational Linguistics, Stroudsburg, PA, 151–160, 2011.
AUTHORSPROFILE
Dr. S. Rajarajeswari is working as an Associate Professor in Computer Science Department at Ramaiah Institute of Technology. She received her PhD(CSE and Information and Communication Engineering) in the year 2018 from M S University. She is a Senior IEEE Member, Life Member of CSI and ISTE. Her areas of interest include cloud computing, big data and data sciences, artificial intelligence, data mining and image processing.