A method for high accuracy geo-referencing of
data from field operations
M. Nørremark H.-W. Griepentrog
H. Nielsen S. Blackmore
The Royal Veterinary and Agricultural University Dept. of Agricultural Sciences / AgroTechnology
Hojbakkegaard Alle 4, DK - 2630 Taastrup Denmark
Tel: +45 3528 3575 Email: [email protected]
Presented at the
4th European Conference on Precision Agriculture Berlin, Germany, July 2003
Proceedings pp. 463-467
edited by J.V. Stafford and A. Werner Wageningen Academic Publishers
The Netherlands
A method for high accuracy geo-referencing of data from field operations
M. Nørremark, H.W. Griepentrog, H. Nielsen and B.S. Blackmore
The Royal Veterinary and Agricultural University, Dept. of Agricultural Sciences, AgroTechnology, 2630 Taastrup, Denmark
mino[a]kvl.dk
Abstract
In this project a Real Time Kinematic Global Position System (RTKGPS) was used to provide high accuracy field operation data. The deviations and errors of the RTKGPS when used in static and dynamic modes were studied as well as the accuracy of RTK GPS in eastern Denmark (55 40 N, 12 18 E) during a 24-hour test. The project introduced a novel real time data acquisition system and post-processing algorithms for improving positioning by merging RTKGPS data with vehicle altitude.
Keywords: RTKGPS, accuracy, geo-referencing, seeding
Introduction
The availability of geo-referenced spatial data has opened new opportunities of crop management in agriculture. To be able to geo-reference data, an appropriately accurate positioning system is required. The highest accuracy is required for vehicle guidance along crop rows or controlling tools for single plant treatments. For these operations, an accuracy of centimeter level is needed to achieve the required operation objectives (Lee et al., 1999; Van Zuydam, 1999; Griepentrog et al., 2003).
The objective of the project was to develop a methodology to log high accuracy position data to enable a position to be mapped for each seed dropped from a sugar beet seeder. This geo-referenced data was then used to find individual plants to allow individual treatments (Griepentrog & Nørremark, 2001).
Materials and Methods
The seeder used for this research project was a mechanical Kverneland/Accord Monopill S six-row precision seeder for sugar beet sowing. An optical sensor was retrofitted to the bottom of each seeder unit in order to detect individual seeds being dropped. The GPS antenna was fixed in the middle of the toolbar at a height of 1.2 m. An inclinometer was attached to the antenna pole in order to measure the two-dimensional inclination of pitch and roll. The performance of the seeder during the field operation was the same as for a normal sowing operation.
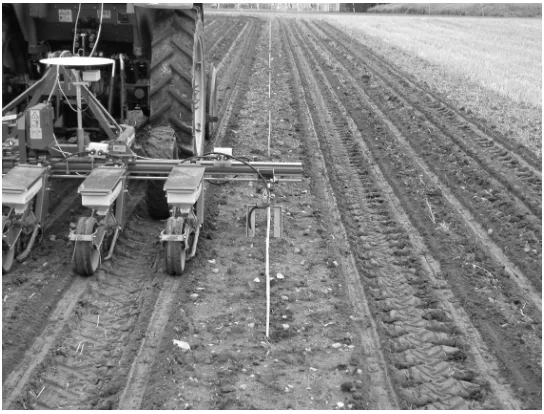
One complete seeder unit – the rightmost - was substituted by an infrared light beam sensor (Figure 1). This extra light beam allowed checking and optimising the data logging system by using plastic canes that were put at known positions and exactly on a North-South transect in the test field (cane positions were manually measured with RTKGPS). While the data were logged during the seeding operation, the canes also triggered a signal as a calibration measure. The data logging and processing method could be verified more easily by comparing the true Northing positions of the canes with the estimated positions.
Figure 1. One seeder unit replaced by an infrared light beam sensor.
Positioning System
A complete RTKGPS system from Trimble was used. For the RTKGPS dynamic mode studies, a 6 m test bench was designed as a railway track. The GPS antenna was mounted on top of a small vehicle designed for moving on the track without pitching and rolling. One test was done on a North-South transect for measuring the Easting distance error, and another test on an East-West transect for measuring the Northing distance error. For the studies of static accuracy of the RTKGPS, a benchmark was used.
Results and Discussion
Time synchronisation was based on NMEA messages of Universal Time Coordinated time (UTC time), a 1 pulse per second (PPS) signal (both provided by the RTKGPS receiver), synchronised with a hardware time in which was provided to each line of data sampled and stored within DasyLab 4.0. The leading edge of the PPS coincides with the beginning of each UTC sec. Tests of the acquisition system showed that each NMEA message of UTC is output 0.79 sec before the corresponding PPS. By extracting 0.79 sec from the PPS hardware time and utilisation of nearest neighbour interpolation procedures in MATLAB, it was possible to use the PPS data for synchronising hardware time into UTC time. The procedure also generated a hardware/UTC time table, which was used for intermediate time synchronisation for returning the UTC time for the optical sensor readings.
The post-processing procedure in MATLAB included a control of GPS data and removal of GPS outliers. The post-processing procedure also included a smoothing of each position using the time as independent variable. The smoothing was done in variable and predefined intervals and by a second order polynomial curve fitting. The data processing also included corrections for the kinematic offset vectors illustrated in Figure 2.
Z
Transversal direction [m] [m]
α α
α
Point of rotation Seed drop position Distance toolbar GPS antenna
Inclination = α
ROLL
α α
α
Point of rotation Seed drop position Distance toolbar Driving direction GPS antenna Inclination = α
PITCH
Z
[image:4.595.82.360.94.215.2]Longitudinal direction [m] [m] N E [m] [m] GPS antenna Optical Sensor Offset Vector Global Positions YAW
[image:4.595.72.551.291.378.2]Figure 2. Kinematic models and offset vectors. Z: Height.
Table 1. Test results from driving with the infrared sensor shown in Figure 1 along a row of canes placed exactly on a North-South transect. Number of samples: 150.
Direction of driving
Speed [m/s]
Longitudinal Mean deviation [m] (True cane position – estimated cane position)
Std. error [m] North South 0.55 1.55 0.55 1.55 0.0118 0.0123 0.0118 0.0202 0.0114 0.0114 0.0121 0.0119
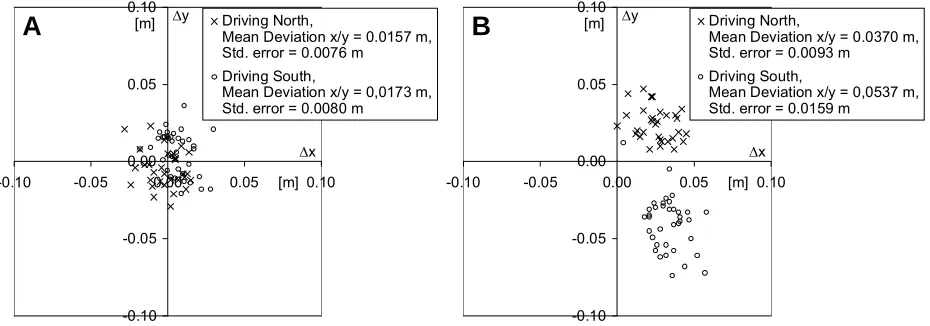
The test results in Table 1 shows that both the data acquisition system and the data post-processing procedures can provide a high accuracy geo-referencing of data logged when the seeder was in a dynamic mode. The mean values for both speed showed positive values, most likely because of the small inclination of the test area. Test results from a seeding trial are shown in Figure 3. Figure 3 shows the deviation between true plant positions (true plant positions were measured with RTKGPS) and estimated seed positions, calculated as estimated seed positions minus true plant positions. Figure 3 A and B are both based on the same raw data, only including (A) or excluding (B) the inclination data in the processing method in MATLAB.
Figure 3. Test results at driving speed of 0.55 m/s and seed spacing of 0.202 m (~ seeding disc with same speed as driving speed). ∆y: deviation in longitudinal direction (~direction of driving).
∆x: deviation in transversal direction
-0.10 -0.05 0.00 0.05 0.10
-0.10 -0.05 0.00 0.05 0.10
Driving North, Mean Deviation x/y = 0.0157 m, Std. error = 0.0076 m
Driving South, Mean Deviation x/y = 0,0173 m, Std. error = 0.0080 m
[m] [m] ∆y
∆x
A
-0.10 -0.05 0.00 0.05 0.10-0.10 -0.05 0.00 0.05 0.10
Driving North, Mean Deviation x/y = 0.0370 m, Std. error = 0.0093 m
Driving South, Mean Deviation x/y = 0,0537 m, Std. error = 0.0159 m
[m] [m] ∆y
[image:4.595.69.534.515.678.2]Figure 3 B shows that the seeder was pitching towards the direction of driving. By including the inclination data (Figure 3 A), the pitching effect was removed, and the mean deviation between true plant and estimated seed positions were reduced by approximately 60%.
RTK-GPS Tests
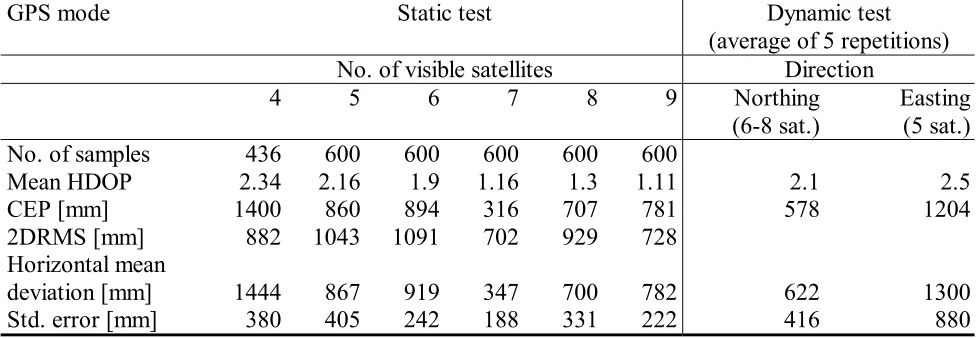
[image:5.595.70.558.266.435.2]The 24-hour RTKGPS static test was done to reveal the system repeatability and behaviour for different number of visible satellites. Positions were logged at 1 sec. intervals for 24 hours. The RTK-GPS dynamic test was done to reveal the system repeatability in dynamic mode. Table 2 summarise the test results.
Table 2. Circular error probable (CEP), two-distance root mean square (2DRMS) values, and statistics for GPS modes and different number of visible satellites (Leva et al., 1996, Van Diggelen, 1998).
GPS mode Static test Dynamic test
(average of 5 repetitions) No. of visible satellites Direction
4 5 6 7 8 9 Northing (6-8 sat.)
Easting (5 sat.) No. of samples
Mean HDOP CEP [mm] 2DRMS [mm] Horizontal mean deviation [mm] Std. error [mm]
436 2.34 1400 882 1444 380 600 2.16 860 1043 867 405 600 1.9 894 1091 919 242 600 1.16 316 702 347 188 600 1.3 707 929 700 331 600 1.11 781 728 782 222 2.1 578 622 416 2.5 1204 1300 880
The availability of 7 satellites or more were observed at 43% of the transmitted positions during the 24-hour test. The dynamic test showed difference between Northing distance error and Easting distance error, most likely because of the different number of visible satellites.
Conclusions
Acknowledgements
We acknowledge Kverneland company supporting us with their expertise and for providing the precision seeder Monopill. We also thank ‘Forskning for Økologisk Jordbrug’ (FØJO) for funding the project.
References
Griepentrog, H.W. and Nørremark, M. 2001. Bestandesführung mittels kartierter
Pflanzenpositionen (Crop management with mapped plant positions). In: Proceedings VDI Conference on Agricultural Engineering Hannover, pp. 285-290. VDI Publisher, Düsseldorf Griepentrog, H.W.; Nørremark, M.; Nielsen, H. and Blackmore, S. 2003. Individual plant care in
cropping systems. In: Proceedings of the 4th European Conference on Precision Agriculture, Berlin
Lee, W.S.; Slaughter, D.C. and Giles, D.K. 1999. Robotic weed control system for tomatoes. Precision Agriculture 1, 95-113
Leva, J.L.; de Haag, M.U. and Van Dyke, K. 1996. Performance of standalone GPS. In: Understanding GPS Principles and Applications, edt. E.D. Kaplan, Artech House Inc., Norwood, USA, 237-319
Van Diggelen, F. 1998. GPS accuracy: Lies, damn lies, and statistics. GPS World, 9 (1) 41-45
Van Zuydam, R. 1999. A driver's steering aid for an agricultural implement, based on an electronic map and real time kinematic DGPS. Computers and Electronics in Agriculture, 24 (3)