Group A Rotavirus VP1 Polymerase and VP2 Core Shell
Proteins: Intergenotypic Sequence Variation and
In Vitro
Functional Compatibility
Courtney L. Steger,aCrystal E. Boudreaux,bLeslie E. LaConte,c,dJames B. Pease,eSarah M. McDonalde
aTranslational Biology, Medicine, and Health Graduate Program, Virginia Tech, Blacksburg, Virginia, USA bWest Virginia School of Osteopathic Medicine, Lewisburg, West Virginia, USA
cVirginia Tech Carilion Research Institute, Roanoke, Virginia, USA dVirginia Tech School of Medicine, Roanoke, Virginia, USA
eDepartment of Biology, Wake Forest University, Winston-Salem, North Carolina, USA
ABSTRACT Group A rotaviruses (RVAs) are classified according to a nucleotide
sequence-based system that assigns a genotype to each of the 11 double-stranded RNA (dsRNA) genome segments. For the segment encoding the VP1 polymerase, 22 genotypes (R1 to R22) are defined with an 83% nucleotide identity cutoff value. For the segment encoding the VP2 core shell protein, which is a functional VP1-binding partner, 20 genotypes (C1 to C20) are defined with an 84% nucleotide identity cut-off value. However, the extent to which the VP1 and VP2 proteins encoded by these genotypes differ in their sequences or interactions has not been described. Here, we sought to (i) delineate the relationships and sites of variation for VP1 and VP2 pro-teins belonging to the known RVA genotypes and (ii) correlate intergenotypic se-quence diversity with functional VP1-VP2 interaction(s) during dsRNA synthesis. Us-ing bioinformatic approaches, we revealed which VP1 and VP2 genotypes encode divergent proteins and identified the positional locations of amino acid changes in the context of known structural domains/subdomains. We then employed anin vitro
dsRNA synthesis assay to test whether genotype R1, R2, R4, and R7 VP1 polymerases could be enzymatically activated by genotype C1, C2, C4, C5, and C7 VP2 core shell proteins. Genotype combinations that were incompatible informed the rational de-sign andin vitrotesting of chimeric mutant VP1 and VP2 proteins. The results of this study connect VP1 and VP2 nucleotide-level diversity to protein-level diversity for the first time, and they provide new insights into regions/residues critical for VP1-VP2 interaction(s) during viral genome replication.
IMPORTANCE Group A rotaviruses (RVAs) are widespread in nature, infecting
nu-merous mammalian and avian hosts and causing severe gastroenteritis in human children. RVAs are classified using a system that assigns a genotype to each viral gene according to its nucleotide sequence. To date, 22 genotypes have been de-scribed for the gene encoding the viral polymerase (VP1), and 20 genotypes have been described for the gene encoding the core shell protein (VP2). Here, we ana-lyzed if/how the VP1 and VP2 proteins encoded by the known RVA genotypes differ from each other in their sequences. We also used a biochemical approach to test whether the intergenotypic sequence differences influenced how VP1 and VP2 func-tionally engage each other to mediate RNA synthesis in a test tube. This work is im-portant because it increases our understanding of RVA protein-level diversity and raises new ideas about the VP1-VP2 binding interface(s) that is important for viral replication.
KEYWORDS RNA synthesis, RNA-dependent RNA polymerase, core shell protein,
diversity, genome replication, genotypes, rotavirus
CitationSteger CL, Boudreaux CE, LaConte LE, Pease JB, McDonald SM. 2019. Group A rotavirus VP1 polymerase and VP2 core shell proteins: intergenotypic sequence variation andin vitro functional compatibility. J Virol 93:e01642-18.
https://doi.org/10.1128/JVI.01642-18. EditorSusana López, Instituto de Biotecnologia/UNAM
Copyright© 2019 American Society for Microbiology.All Rights Reserved. Address correspondence to Sarah M. McDonald, [email protected].
Received17 September 2018 Accepted16 October 2018
Accepted manuscript posted online24 October 2018
Published
OF VIRAL GENE EXPRESSION
crossm
4 January 2019
on November 6, 2019 by guest
http://jvi.asm.org/
R
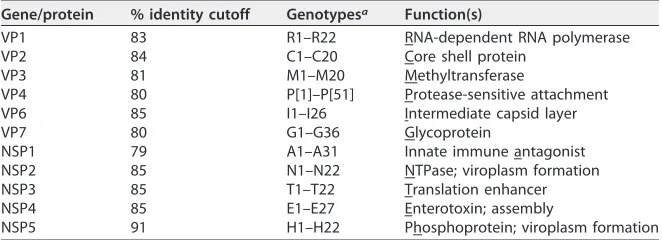
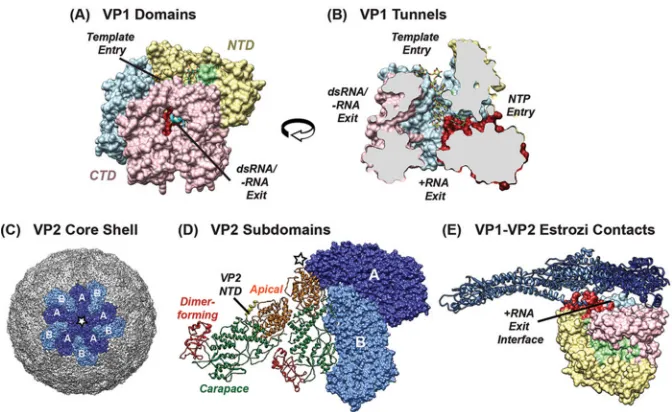
otaviruses are members of theReoviridae family that package an 11-segmented double-stranded RNA (dsRNA) genome within a nonenveloped, icosahedral particle (1). More than 8 species of rotavirus have been identified in nature (groups A to H and tentative groups I and J), although the vast majority of human and animal disease is caused by group A rotavirus (RVA) strains (2–4). RVAs are economically and medically significant gastrointestinal pathogens that remain important causes of childhood diar-rhea, leading to ⬃215,000 deaths each year (5). RVAs also infect a wide range of mammalian and avian hosts, including, but not limited to, cows, pigs, dogs, cats, chickens, turkeys, pigeon, mice, bats, horses, monkeys, and rabbits (1). Individual RVA strains are classified according to a system that assigns a specific genotype to each of the 11 genome segments according to its sequence and established nucleotide percent identity cutoff values (6) (Table 1). In most strains, each genome segment is a gene that encodes a single viral protein. Thus, 6 genes encode the structural proteins VP1 to VP4, VP6, and VP7, and 5 genes encode the nonstructural proteins NSP1 to NSP5 (1). In the classification system, each gene is designated by a single letter (defined by the encoded protein function), and the assigned genotype is listed as a number (Table 1). To date, 20 to 51 different genotypes have been described for RVA genes (Rotavirus Classifica-tion Working Group, 2018 [seehttps://rega.kuleuven.be/cev/viralmetagenomics/virus -classification/rcwg]), indicating a high degree of nucleotide-level strain diversity (Table 1). However, the extent to which this diversity is reflected in the sequences, structures, or functions of the encoded proteins has not yet been described.The rotavirus RNA-dependent RNA polymerase VP1 is the largest protein encoded by RVAs (125 kDa;⬃1,090 amino acids in length). Currently, 22 different VP1 genotypes (R1 to R22) have been defined for RVAs based upon an 83% nucleotide identity cutoff value for the gene (6) (Table 1). While previous studies have investigated the amino acid sequence conservation and variation for VP1 proteins belonging to different rotavirus groups (i.e., RVA-RVD and RVF-RVH), much less is known about if or how the RVA VP1 proteins encoded by genotypes R1 to R22 differ from each other (7, 8). The structure of a genotype R2 VP1 protein (strain SA11) has been solved to atomic resolution, revealing a globular, cage-like enzyme with an N-terminal domain (NTD) (amino acids ⬃1 to 332), a central polymerase domain (amino acids⬃333 to 778), and a C-terminal “bracelet” domain (CTD) (amino acids⬃779 to 1089) (9) (Fig. 1A). The catalytic center resides within the polymerase domain and is comprised of several structurally con-served motifs, all of which are buried in the hollow interior of the enzyme. Four tunnels permeate VP1 and allow for the entry of single-stranded RNA templates, nucleoside triphosphates (NTPs), and divalent cations as well as the exit of RNA templates and positive-sense RNA (⫹RNA) transcripts or dsRNA products of genome replication (Fig. 1B). Despite having all the necessary structural features for catalysis, VP1 is not active as an apoenzyme. Instead, VP1 function is dependent upon its interaction(s) with VP2, the core shell protein that comprises the innermost layer of the triple-layered virion (10, 11).
VP2 is the second largest protein encoded by RVAs (102 kDa;⬃900 amino acids in length), and 20 different genotypes (C1 to C20) have been defined based upon an 84% nucleotide sequence identity cutoff value for the gene (6) (Table 1). However, the extent to which VP2 proteins encoded by the 20 different genotypes differ has not yet been described. Atomic structures of VP2 in the context of triple-layered virions and double-layered particles (DLPs) have been solved for strain SA11 (genotype C5) and strain UK (genotype C2) (12–14). All structures reveal a smooth, T⫽1 icosahedral shell comprised of 120 VP2 monomers, arranged into 12 decameric units (Fig. 1C). VP2 monomers adopt two slightly different conformations, with one conformation (VP2-A) tightly enclosing the 5-fold axis and the other (VP2-B) sitting further away from the 5-fold and interdigitating VP2-A. The principal scaffold domain of VP2 (amino acids ⬃101 to 900) is made up of apical, carapace, and dimer-forming subdomains (Fig. 1D). The extreme NTD of VP2 (amino acids ⬃1 to 100) is not fully resolved in any of the structures. However, all available data indicate that the VP2 NTD protrudes into the core interior (13, 15).
The RVA polymerase VP1 performs both transcription (⫹RNA synthesis) and genome
on November 6, 2019 by guest
http://jvi.asm.org/
replication (dsRNA synthesis) in connection with the VP2 core shell (9, 16, 17). However, the manner in which these proteins engage each other during each stage of RNA synthesis is not fully understood. Transcription occurs in the context of a DLP, wherein VP1 monomers are oriented beneath the 5-fold icosahedral vertices such that their ⫹RNA exit tunnels abut the VP2 capsid layer (18, 19) (Fig. 1E). Estrozi et al. showed that regions of the VP1 NTD and CTD are contacted by both the VP2 NTD and the principal scaffold domain in the DLP structure of bovine strain UK (VP1 genotype R2 and VP2 genotype C2) (19). Less is known about the position and orientation of VP1 during genome replication, which occurs within subviral, assembly-replicase intermediates (20–23). There are currently no high-resolution structures of VP1 and VP2 within these subviral particles. The little that we do know about the VP1-VP2 interaction(s) during genome replication is based upon the results ofin vitrodsRNA synthesis assays using mostly recombinant proteins of strain SA11 (genotype R2 VP1 and genotype C5 VP2) (15). These results suggest that an intact VP2 NTD is essential for supporting robust recombinant VP1 (rVP1) activity and also that regions of the VP2 principal scaffold domain mediate VP1 interaction(s) in a group-specific manner (7, 15). More specifically, it was shown that residues in the VP2 apical and/or carapace subdomain, but not the NTD, allow the core shell protein to differentiate a VP1 protein from RVA (strain SA11) versus RVC (strain Bristol) (15). In vitroassays have also been used to probe regions/ residues of VP1 that are important for dsRNA synthesis, particularly those involved in template binding and catalysis (24–26). Still, the regions of VP1 that functionally interact with VP2 duringin vitrodsRNA synthesis are not known.
In this study, we sought to investigate the sequences and in vitro functions of genetically diverse RVA VP1 and VP2 proteins. Specifically, we used bioinformatic approaches to determine how similar/different the VP1 and VP2 proteins encoded by the known RVA genotypes are, thereby connecting nucleotide-level diversity to protein-level diversity for the first time. Furthermore, we mapped regions of conserva-tion and variaconserva-tion within the polymerase and core shell proteins as well as identified amino acid positions that distinguish certain VP1 and VP2 genotypes/lineages. More-over, usingin vitrodsRNA synthesis assays, we tested the functional compatibility of wild-type and mutant VP1 and VP2 proteins belonging to several different genotypes. Our results provide a comprehensive description of RVA VP1 and VP2 intergenotypic amino acid sequence diversity and shed light on how this diversity might correlate with functional VP1-VP2 interactions during genome replication.
RESULTS
Intergenotypic relationships among RVA VP1 genes and proteins.Currently, 22 different VP1 genotypes (R1 to R22) have been defined for RVAs based upon an 83% nucleotide identity cutoff value (6) (Table 1). We first sought to determine the relation-ships among these VP1 genotypes at the nucleotide level. To do this, VP1 open reading frame (ORF) nucleotide sequences were retrieved from public databases, and repre-sentatives of each genotype were used to construct a maximum likelihood phyloge-TABLE 1Nucleotide sequence-based genotype classification of RVA genome segments
Gene/protein % identity cutoff Genotypesa Function(s)
VP1 83 R1–R22 RNA-dependent RNA polymerase VP2 84 C1–C20 Core shell protein
VP3 81 M1–M20 Methyltransferase
VP4 80 P[1]–P[51] Protease-sensitive attachment VP6 85 I1–I26 Intermediate capsid layer VP7 80 G1–G36 Glycoprotein
NSP1 79 A1–A31 Innate immune antagonist NSP2 85 N1–N22 NTPase; viroplasm formation NSP3 85 T1–T22 Translation enhancer NSP4 85 E1–E27 Enterotoxin; assembly
NSP5 91 H1–H22 Phosphoprotein; viroplasm formation
aSeehttps://rega.kuleuven.be/cev/viralmetagenomics/virus-classification/rcwg.
on November 6, 2019 by guest
http://jvi.asm.org/
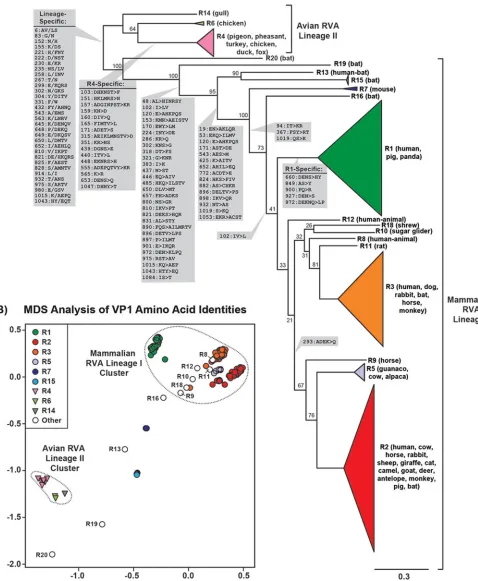
[image:3.585.41.372.83.203.2]netic tree (Fig. 2A; see also Table S1 in the supplemental material). Sequences for genotypes R17, R21, and R22 were not available at the time of the study. The results of this analysis revealed two major lineages (lineages I and II) of VP1 genotypes that were differentiated by mammalian versus avian hosts. More specifically, lineage I was com-prised of 16 VP1 genotypes (R1 to R3, R5, R7 to R13, R15, R16, and R18 to R20), which were exclusively found in strains isolated from mammals (Fig. 2A and Table S1). Lineage II, on the other hand, was comprised of 3 VP1 genotypes (R4, R6, and R14), which were mostly found in strains isolated from avian hosts (turkey, pheasant, chicken, duck, pigeon, and gull). One exception for the avian specificity of lineage II was a single R4 genotype from a strain that was isolated from a fox, possibly following an interspecies transmission event (27) (Table S1).
For mammalian RVA lineage I, genotypes R7, R13, R15, R16, R19, and R20 were cleanly delineated in the phylogenetic tree, with strong bootstrap support values (Fig. 2A). Genotype R7 has been found exclusively in murine RVA strains that are commonly used in laboratory studies (28) (Table S1). Genotypes R15, R16, R19, and R20 were all found in modern RVAs isolated from bats (29, 30) (Table S1). Genotype R13 also likely originated from a bat RVA, but the only representative was isolated from a 2-year old child in Suriname, presumably via an interspecies transmission event (31) (Table S1). The remaining lineage I genotypes (R1 to R3, R5, R8 to R12, and R18) formed distinct phylogenetic groupings but lacked strong bootstrap support values (Fig. 2A). Genotype R1 was found in strains isolated from humans and pigs, with only a few exceptions (Table S1). Genotype R2 was found in strains isolated from humans and numerous other animal hosts, including, but not limited to, cows, sheep, cats, giraffes, pigs, deer, rabbits,
FIG 1Structures of VP1 and VP2. (A) Atomic structure of SA11 (R2) rVP1 (PDB accession no.2R7R) shown in a surface representation and colored according to domain/subdomain organization. The N-terminal domain (NTD) (yellow) and the C-terminal domain (CTD) (pink) surround the central polymerase domain, which is comprised of canonical finger (blue), palm (red), and thumb (green) subdomains. The extreme C terminus of the protein forms a plug, which is colored cyan and shown in a ribbon representation. (B) Structure in panel A rotated 90° to the left and computationally sliced through the middle to reveal four tunnels extending into the catalytic core. Known or putative functions of the tunnels are labeled, and a 7-nucleotide RNA template is shown in a stick figure representation. (C) Structure of the core shell of a bovine rotavirus (PDB accession no.3KZ4) depicted in a surface representation. A central VP2 decamer is shown in dark and light blue to highlight five VP2-A and five VP2-B monomers, respectively. (D) Two neighboring VP2 dimers (each comprised of one VP2-A monomer and one VP2-B monomer). One dimer is depicted in a surface representation, with the same coloration as in panel C. The other VP2 dimer is shown in a ribbon representation and colored to show the subdomain organization of the principal scaffold domain (red, dimer forming; orange, apical; green, carapace). The resolved portion of the VP2 NTD is colored in yellow and indicated on the structure. (E) Structure depicting VP1-VP2 contacts within the bovine
RVA DLP (PDB accession no.4F5X). VP1 and VP2 are colored as in panels A to C. The VP1 monomer is
oriented beneath the VP2 capsid layer such that residues surrounding the⫹RNA exit tunnel contact VP2.
on November 6, 2019 by guest
http://jvi.asm.org/
[image:4.585.41.377.70.276.2]FIG 2Intergenotypic relationships among VP1 genes and proteins. (A) An intergenotypic maximum likelihood phylogenetic tree was inferred from the aligned ORFs of 158 sequences representing genotypes R1 to R16 and R18 to R20. Horizontal branch lengths are drawn to scale (nucleotide substitutions per base), with bootstrap values shown as percentages for key nodes. Monophyletic groupings were collapsed and are shown as colored, cartooned triangles representing a single genotype. Genotypes are indicated for each branch/triangle, and the animal host of the corresponding RVA is listed in parentheses. Brackets indicate two phylogenetically distinct lineages of VP1 proteins (lineages I and II). Amino acid positions and residue changes that differentiate key branch points are overlaid on the tree (gray boxes). In all cases, the amino acid change(s) is listed in the same directionality as the tree (i.e., amino acid[s] of left branches⬎amino
(Continued on next page)
on November 6, 2019 by guest
http://jvi.asm.org/
[image:5.585.51.529.88.669.2]horses, camels, goats, antelopes, monkeys, and bats (Table S1). These two genotypes (R1 and R2) are typically associated with human strains that cause pediatric gastroen-teritis (1, 32, 33). Genotype R3 was also found in strains isolated from humans; however, this genotype is only rarely associated with gastroenteritis in children. Genotype R3 is most likely of animal RVA origin, and it was found in strains isolated from several different hosts, including, but not limited to, dogs, rabbits, horses, bats, and monkeys (Table S1). Genotypes R5 and R9 are additional animal RVA genotypes that show phylogenetic relationships with each other and with the R2 genotype. Genotypes R8, R10 to R12, and R18 were found in various animal hosts, and human strains with genotypes R8 and R12 are suspected interspecies transmission events (34, 35) (Table S1). Genotypes R8, R10 to R12, and R18 seem to share a phylogenetic relationship with each other and with the R3 genotype.
Having observed the relationships of VP1 genotypes at the nucleotide level, we next sought to determine if and/or how these relationships are reflected in the sequences of the encoded proteins. To do this, we constructed an intergenotypic amino acid sequence alignment and calculated all pairwise sequence identity values. These data were then used in a multidimensional scaling (MDS) analysis, which is a multivariate procedure designed to visualize and identify patterns in a distance matrix (36) (Fig. 2B). In MDS, sequences are represented as points whose respective pairwise sequence distances are approximated when projected onto a two-dimensional (2D) plane. Thus, clusters of closely spaced points represent sequences that cannot be readily distin-guished from each other based upon their pairwise distances. In contrast, points that are spread far apart in planar space represent proteins that are more divergent in their pairwise sequence distances. The MDS results for VP1 show that the points represent-ing avian RVA lineage II proteins clustered distinctly from those of mammalian RVA lineage I proteins (Fig. 2B). Within the avian RVA lineage II cluster, there was also strong intragenotypic point overlap (e.g., all the R4 pink triangles in Fig. 2B formed a tight overlapping cluster) and intergenotypic point differentiation (e.g., the R4 pink triangles in Fig. 2B did not overlap the R6 light green triangles). This result suggests that the VP1 proteins encoded by avian RVA lineage II genotypes R4, R6, and R14 are sufficiently different from each other and from those of mammalian RVA lineage I (R1 to R3, R5, R7 to R16, and R18 to R20). In contrast, points representing the mammalian RVA lineage I VP1 proteins did not mutually cluster, and there was strong overlap among several of the genotypes. More specifically, a cluster containing the common genotypes R1, R2, and R3 also included several rare genotypes (R5, R8 to R12, and R18) (Fig. 2B). Points representing genotypes R1 and R2 (Fig. 2B, green and red circles, respectively) re-mained cleanly separated from each other and from those of other genotypes in this cluster, suggesting strong genotype-specific definition for these VP1 proteins in regard to their sequence identities. In contrast, points representing genotype R3 (Fig. 2B, orange circles) showed more diffuse clustering with points that spatially overlapped those for genotypes R5, R8 to R12, and R18. This result suggests that R3, R5, R8 to R12, and R18 VP1 proteins are not easily distinguishable from each other based upon pairwise amino acid sequence distances. On the other hand, points representing mammalian RVA lineage I genotypes R7, R13, R15, R16, R19, and R20 were spatially separate from each other and from those the other avian/mammalian RVA genotypes (Fig. 2B). Thus, these VP1 proteins are highly divergent in their amino acid sequences. Given the observation that some, but not all, of the genotypes could be differen-tiated by pairwise distance in the MDS analysis, we next sought to determine whether any of the VP1 genotypes exhibit specific amino acid signatures that can be used to identify them (Fig. 2A). In particular, we wanted to identify amino acid positions that change in concordance with phylogenetic groupings, which in this case includes
FIG 2Legend (Continued)
acid[s] of right branches). The position number is based upon that of the longest gene. (B) Pairwise amino acid sequence distances represented in an MDS plot.
xandyaxes are arbitrary coordinates in 2D space that allowed proper visualization of genotypes. Colors of genotypes are the same as in panel A, and clusters are indicated by dotted lines.
on November 6, 2019 by guest
http://jvi.asm.org/
genotypes (37). The results for VP1 show that only R1 and R4 had genotype-specific amino acid signatures in their VP1 proteins (Fig. 2A). All other amino acid positional changes were shared among several different genotypes. In particular, 32 amino acid positions that differentiated mammalian RVA lineage I versus avian RVA linage II VP1 proteins were identified. Also, 5 branch points that fall within lineage I correlated with amino acid signatures, suggesting that these residues are shared among several different mammalian RVA VP1 genotypes (Fig. 2A).
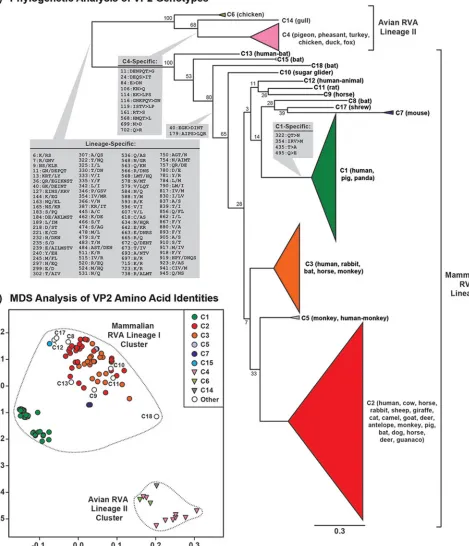
Intergenotypic relationships among RVA VP2 genes and proteins.We next used the same approaches described above to determine the relationships among VP2 genotypes C1 to C20. ORF nucleotide sequences for genotypes C16, C19, and C20 were not available in the databases at the time of this study. Similar to what was found for VP1, two major lineages (lineages I and II) were seen in the intergenotypic maximum likelihood phylogenetic tree for VP2 (Fig. 3A). Lineage II was comprised of genotypes C4, C6, and C14, which were mostly found in strains isolated from avian hosts (turkey, pheasant, chicken, duck, pigeon, and gull), with the exception of a C4 VP2 genotype from the same fox strain that had an R4 VP1 genotype (27) (see Table S1 in the supplemental material). Lineage I was comprised of the remaining 14 VP2 genotypes (C1 to C3, C5, C7 to C13, C15, C17, and C18), which were exclusively found in strains isolated from mammalian hosts (Fig. 3A and Table S1). C13 was the only mammalian RVA lineage I genotype that could be cleanly delineated in the phylogenetic tree with strong bootstrap support (Fig. 3A). This genotype was found from the same bat RVA-like human strain that contained R13 (31). The remaining VP2 genotypes formed separate groupings in the tree, but they did not show strong bootstrap support values (Fig. 3A). Genotype C1 VP2 was found mostly along with R1 VP1 in strains isolated from humans and pigs, with only a few exceptions (Table S1). Genotype C2 VP2 was associated with R2 or R3 VP1 in strains isolated from humans and numerous other animal hosts (Table S1). Genotype C3 VP2 was associated with R2 or R3 VP1 and also found in strains of likely animal RVA origin (Table S1). Genotype C7 was found associated with R7 VP1 in murine RVA strains (28) (Table S1). Genotypes C8, C15, and C18 were found in modern RVAs from bats along with the R16, R15, and R19 VP1 genotypes, respectively (29, 30) (Table S1). VP2 genotypes C9, C10, C11, and C12 were from various animals and associated with the R9, R10, R11, and R12 VP1 genotypes, respectively (Table S1).
The MDS analysis for VP2 revealed that the points representing avian RVA lineage II genotypes (C4, C6, and C14) clustered distinctly from those representing the mamma-lian RVA lineage I VP2 genotypes (C1 to C3, C5, C7 to C13, C15, C17, and C18) (Fig. 3B). However, unlike the tight differentiation that was seen with avian RVA VP1 genotypes, the points representing avian RVA VP2 genotypes C4 (Fig. 3B, pink triangles) and C6 (light green triangles) mutually colocalized with each other, suggesting that they are indistinguishable based upon their pairwise sequence distances. Likewise, there was relatively close clustering among the mammalian RVA lineage I genotypes with the exception of C1, C7, and C18, which showed strong separation (Fig. 3B). In particular, the points representing C2, C3, C8 to C13, C15, and C17 showed spacing that was not congruent with the genotype designation, suggesting that these proteins are not easily differentiated from each other. The branch-specific amino acid analysis for VP2 revealed genotype-specific amino acid signatures for C1 and C4 (Fig. 3A). Moreover, 96 amino acid signatures were found to differentiate lineage I versus lineage II VP2 proteins, and 2 positional changes appeared to be shared among several mammalian RVA lineage I genotypes (i.e., C18 branch split) (Fig. 3A).
Conserved and variable regions of RVA VP1 and VP2 proteins.Having investi-gated the intergenotypic relationships among RVA VP1 and VP2 proteins from a bioinformatics perspective, we next sought to analyze the domains, subdomains, and motifs, thereby identifying regions/residues of conservation and variation among genotypes. To do this, we generated amino acid sequence alignments using consensus sequences for each available genotype of VP1 or VP2 (Fig. 4 and 5; see also Fig. S1 and
on November 6, 2019 by guest
http://jvi.asm.org/
FIG 3Intergenotypic relationships among VP2 genes and proteins. (A) An intergenotypic maximum likelihood phylogenetic tree was inferred from the ORF data for 158 sequences representing genotypes C1 to C15, C17, and C18. Horizontal branch lengths are drawn to scale (nucleotide substitutions per base), with bootstrap values shown as percentages for key nodes. Monophyletic groupings were collapsed and are shown as colored, cartooned triangles representing a single genotype. Genotypes are indicated for each branch/triangle, and the animal host of the corresponding RVA is listed in parentheses. Brackets indicate two phylogenetically distinct lineages of VP2 proteins (lineages I and II). Amino acid positions and residue changes that differentiate key branch points are overlaid on the tree (gray boxes). In all cases, the amino acid change(s) is listed in the same directionality as the tree (i.e., amino acid[s] of left branches⬎amino acid[s] of right branches). The position number is based upon that of the longest gene. (B) Pairwise amino acid sequence distances represented in an MDS plot.
xandyaxes are arbitrary coordinates in 2D space that allowed proper visualization of genotypes. Colors of genotypes are the same as in panel A, and lineages are indicated by dotted lines.
on November 6, 2019 by guest
http://jvi.asm.org/
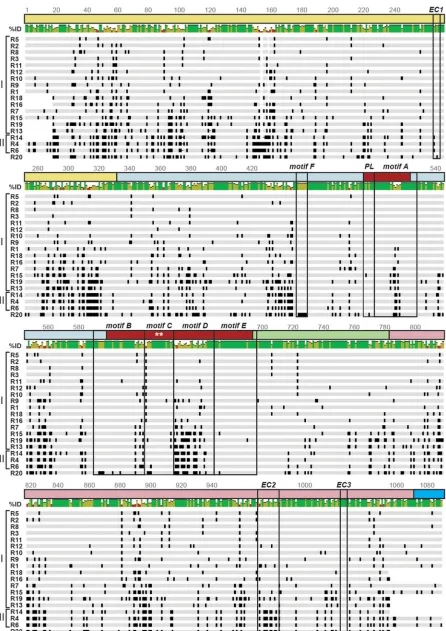
[image:8.585.55.524.81.627.2]FIG 4VP1 genotype consensus amino acid sequence alignment. The schematic shows an amino acid sequence alignment of RVA VP1 consensus sequences for genotypes R1 to R16 and R18 to R20. The VP1 domains and subdomains are represented by a line above the sequence and are
(Continued on next page)
on November 6, 2019 by guest
http://jvi.asm.org/
[image:9.585.44.490.68.699.2]S2 in the supplemental material [a high-resolution version of this figure is available upon request]). The VP1 alignment revealed that sequence variation was distributed across the entire protein (Fig. 4 and Fig. S1). Although R20 clustered phylogenetically with mammalian RVA lineage I genotypes, the amino acid sequence alignment revealed that it has more similarities to avian RVA lineage II proteins (Fig. 4 and Fig. S1). This genotype is clearly an outlier that has unique residues at otherwise conserved posi-tions. For the rest of the genotypes, we found that two of the three sites on VP1 that are predicted to engage VP2 in the context of the DLP (i.e., Estrozi contacts [ECs]) were highly conserved, while another showed a higher degree of variation, especially when comparing lineage I versus lineage II VP1 proteins. More specifically, the VP2 contact site on VP1 at residues 267 to 270 (EC1) showed only a single amino acid change when comparing lineage I versus lineage II proteins, and the site at VP1 residues 1025 to 1028 (EC3) was 100% conserved (Fig. 4 and Fig. S1). However, the VP2 contact site spanning VP1 CTD residues 971 to 983 (EC2) varied more drastically, showing as low as 40% sequence identity between some genotypes (e.g., R1 versus R4) (Fig. 4 and Fig. S1).
Not surprisingly, the catalytic center of the polymerase (motifs A to F and the priming loop) showed a higher degree of sequence conservation than did the NTD and CTD (Fig. 4 and Fig. S1). Residues directly implicated in catalysis, including active-site aspartates of motif C (SA11 residues D631 and D632), were 100% conserved among the VP1 genotypes (7). However, motif D, which is implicated in polymerase fidelity, was highly divergent in comparisons among all the VP1 genotypes, and there were several distinguishing residues between lineage I and lineage II proteins (Fig. 4 and Fig. S1). The R20 VP1 genotype was also an exception to the conservation seen for motifs, showing variable residues at what are otherwise exclusively conserved positions (Fig. S1). Specifically, motif B contains a number of residues that anchor the 3=terminus of the RNA template inside the enzyme (G592, E593, K594, and K597 in SA11) or aid in NTP selection and stabilization at the active site (G592, E593, K594, and K597 in SA11); these key residues all differed for the R20 VP1 genotype (Fig. S1). Moreover, motif F includes a conserved arginine residue that is positioned to interact with nucleosides in the active (residue R452 in SA11), which also differed for R20 VP1 (Fig. S1).
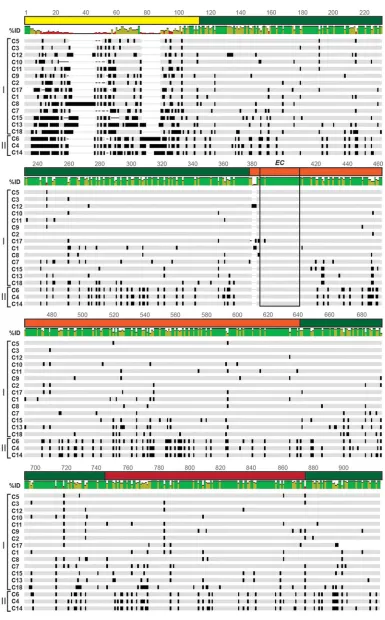
The VP2 genotype consensus alignment revealed a generally more conserved protein than VP1, with the dramatic exception of the NTD (Fig. 5 and Fig. S2). More specifically, NTD residues 10 to 105 showed 28 to 89% intergenotypic amino acid pairwise sequence distance values and several large insertions/deletions (Fig. 5 and Fig. S2). The VP2 NTD is predicted to engage VP1 in the context of the DLP, but the precise points of contact are unknown because the region is not resolved in the structure (19). Sequence variation in the VP2 principal scaffold domain was less than that seen with the NTD, and it was most dramatic between lineage I and lineage II core shell proteins (Fig. 5 and Fig. S2). The region of the VP2 apical subdomain that contacts VP1 in the DLP structure (i.e., EC residues 377 to 403 of strain UK) is highly conserved among all genotypes. For genotypes C1, C12, and C17 a variable insertion occurred at position 379, just before the contact site (Fig. 5 and Fig. S2).
In vitrodsRNA synthesis and functional compatibility of VP1 and VP2 proteins from various genotypes.We next sought to determine whether the observed inter-genotypic variation correlated with VP1 and VP2 protein function. Specifically, we sought to test which of the VP1/VP2 genotypes could functionally substitute for each other in an in vitro dsRNA synthesis assay. Proteins that were able to functionally substitute for each other in vitro were hypothesized to share sequence features in
FIG 4Legend (Continued)
colored as in Fig. 1A and B. Motifs A to F, the priming loop (PL), and the VP1-VP2 interaction sites predicted by Estrozi et al. (EC1, EC2, and EC3) are outlined in boxes. The active site is indicated with asterisks. Amino acid positions are listed. Dashes indicate gaps in the protein sequence, light gray shading indicates conservation of amino acid identity, and black shading represents variation in amino acid identity. Genotypes are listed on the left, and lineages are defined by brackets. R20 (lineage I) is positioned at the bottom of the alignment due to its amino acid similarities with lineage II genotypes (R4, R6, and R14). Percent identity is shown as a colorized graph above the alignment; green bars represent residues with a high degree of intergenotypic conservation, red bars represent residues with little intergenotypic conservation, and yellow bars are intermediary. An enlarged alignment showing amino acid residues is available in Fig. S1 in the supplemental material.
on November 6, 2019 by guest
http://jvi.asm.org/
FIG 5VP2 genotype consensus amino acid sequence alignment. The schematic shows an amino acid sequence alignment of RVA VP2 consensus sequences for genotypes C1 to C15, C17, and C18. Dashes indicate gaps in the protein sequence, light gray shading indicates conservation of amino acid identity, and black shading represents variation in amino acid identity. Genotypes are listed on the left, and lineages are defined by brackets. Percent identity is shown as a colorized graph above the segment that corresponds to the sequence below; green bars represent residues with a high degree of
(Continued on next page)
on November 6, 2019 by guest
http://jvi.asm.org/
[image:11.585.42.427.64.684.2]regions important for VP1-VP2 interaction(s). In contrast, proteins that lacked cross-functionality were expected to be divergent in their sequences. For this analysis, we focused on strains that represent mammalian RVA lineage I (strain SA11 [R2/C5], strain DS-1 [R2/C2], strain Wa [R1/C1], and strain ETD [R7/C7]) as well as a single strain representing avian RVA lineage II (strain PO-13 [R4 and C4]).
The rVP1 proteins of strains SA11 (R2), DS-1 (R2), Wa (R1), ETD (R7), and PO-13 (R4) were expressed in insect cells as 6⫻histidine fusions, purified from the soluble fraction of cell lysates using metal affinity resin, and visualized following SDS-polyacrylamide gel electrophoresis (PAGE) and Coomassie blue staining (Fig. 6A). In general, the expression and solubility profiles of the rVP1 proteins were similar, with the exception of strain PO-13 (R4) rVP1, for which there was a lower relative recovery after affinity purification (data not shown). The rVP2 proteins of strains SA11 (C5), DS-1 (C2), Wa (C1), ETD (C7), and PO-13 (C4) were expressed in insect cells as untagged proteins, purified
FIG 5Legend (Continued)
intergenotypic conservation, red bars represent residues with little intergenotypic conservation, and yellow bars are intermediary. The VP2 domains and subdomains are represented by a line above the sequence and are colored as in Fig. 1D, and the VP1-VP2 interaction sites predicted by Estrozi et al. (EC) are outlined in a box. Amino acid positions are indicated. An enlarged alignment showing amino acid residues is available in Fig. S2 in the supplemental material.
FIG 6In vitrodsRNA synthesis by rVP1 and rVP2 proteins of several different genotypes. (A and B) Approximately 2 pmol purified rVP1 (A) or 8 pmol purified rVP2 (B) was electrophoresed in 4 to 15% SDS-polyacrylamide gels and visualized by Coomassie blue staining. Molecular masses (in kilodaltons) are shown to the left of each gel. The strain name and genotype of the recombinant proteins are specified above the corresponding lane. (C)In vitrodsRNA synthesis assays were performed using 2 pmol of rVP1,
8 pmol of rVP2, and 16 pmol of an RVA ⫹RNA template. Radiolabeled dsRNA products made by
rVP1/rVP2 proteins of SA11 (R2/C5), DS-1 (R2/C2), Wa (R1/C1), ETD (R7/C7), and PO-13 (R4/C4) were resolved on 4 to 15% SDS-polyacrylamide gels and detected with a phosphorimager. Experiments were repeated three times with four distinct protein batches, and representative images are shown.
on November 6, 2019 by guest
http://jvi.asm.org/
[image:12.585.121.289.68.406.2]from the cell lysates using differential centrifugation, and also visualized following SDS-PAGE and Coomassie blue staining (Fig. 6B). The expression and recovery of intact rVP2 were generally similar for all strains, with some exceptions. For example, DS-1 (C2) rVP2 showed lower expression levels than the other 4 core shell proteins and had a banding pattern in gels that was consistent with NTD cleavage (38–40) (Fig. 6B). As seen in previous studies, additional protein bands migrating between⬃35 and 75 kDa were observed at various concentrations in the rVP2 preparations and may represent copu-rifying contaminants (15). Reasons underlying the observed variation in levels of copurifying proteins and cleavage products in rVP2 protein preparations are not currently well understood albeit not unprecedented (7, 15).
First, to test whether cognate rVP1 and rVP2 protein sets were functional forin vitro
dsRNA synthesis, they were incubated together along with an RVA ⫹RNA template, divalent cations, NTPs, and trace amounts of [32P]UTP at 37°C for 3 h. The32P-labeled
dsRNA products of the reactions were resolved by SDS-PAGE and visualized using a phosphorimager (Fig. 6C). The results showed strong dsRNA product bands for the reaction mixtures containing cognate rVP1 and rVP2 proteins of strains SA11 (R2/C5) and PO-13 (R4/C4), suggesting that both of these polymerases and their core shell proteins were properly folded and functional. In contrast, faint dsRNA product bands were detected for reaction mixtures containing rVP1 and rVP2 proteins of strains DS-1 (R2/C2) and Wa (R1/C1); no reproducibly detectable products were observed for reaction mixtures containing strain ETD (R7/C7) proteins (Fig. 6C). The latter results suggest that one or both of the protein binding partners (i.e., rVP1 and/or rVP2) for strain Wa, DS-1, or ETD were not functionalin vitrounder the assay conditions.
To determine which individual rVP1 and/or rVP2 proteins were functional in vitro
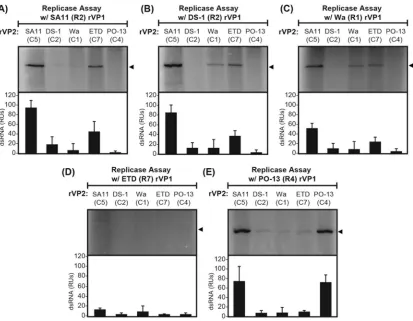
and which ones could substitute for each other, we next performed “mix-n-match” reactions (Fig. 7). More specifically, each rVP1 protein was assayed for the capacity to support in vitro dsRNA synthesis in the presence of each rVP2 protein. The results showed strong dsRNA product bands for reaction mixtures containing rVP1 proteins of the mammalian RVA lineage I genotype proteins from strains SA11 (R2), DS-1 (R2), and Wa (R1) in the presence of strain SA11 (C5) rVP2 (Fig. 7A to C). Faint, but reproducibly detectable, dsRNA product bands were also seen for reaction mixtures containing these same rVP1 proteins in the presence of strain ETD (C7) rVP2 (Fig. 7A to C). Thus, these 3 mammalian RVA polymerases (i.e., SA11 [R2], DS-1 [R2], and Wa [R1]) and these 2 mammalian RVA core shell proteins (i.e., SA11 [C5] and ETD [C7]) were functional forin vitrodsRNA synthesis and functionally compatible with each other. In contrast, there were few or no detectable dsRNA products for reaction mixtures containing mamma-lian RVA lineage I ETD (R7) rVP1, suggesting that this polymerase was not functional under the assay conditions for reasons that are not understood at this time (Fig. 7D). Likewise, few or no dsRNA products were detected in reaction mixtures containing lineage I rVP2 proteins from human strains DS-1 (C2) and Wa (C1), even in the presence of functional cognate polymerases (i.e., DS-1 [R2] rVP1 and Wa [R1] rVP1) (Fig. 7A to C). The reason for the lack of activity with these 2 mammalian RVA core shell proteins is not understood but might be due to proteolysis or contaminant proteins in the preparations (Fig. 6B). For the reaction mixtures containing the avian RVA lineage II PO-13 (R4) rVP1 protein, robust dsRNA product bands were detected in the presence of its own cognate PO-13 (C4) rVP2 protein and also in the presence of the mammalian SA11 (C5) rVP2 protein (Fig. 7E). None of the other mammalian RVA rVP2 proteins, not even the functional ETD (C7) rVP2 protein, were able to support activity with PO-13 (R4) rVP1. Importantly, none of the functional rVP1 proteins (i.e., strains SA11 [R2], DS-1 [R2], Wa [R1], and PO-13 [R4]) produced a detectable dsRNA product in the absence of rVP2, supporting the essential nature of the VP1-VP2 interaction during genome replication (data not shown). Together, the results of this mix-n-match experiment raise several questions about the precise determinants of rVP1 activation by rVP2 and how inter-genotypic sequence diversity plays a role in functional compatibility.
on November 6, 2019 by guest
http://jvi.asm.org/
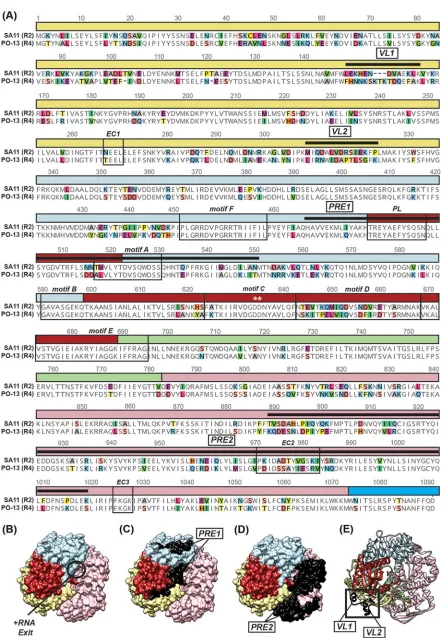
Mapping regions of rVP1 that are important for activation by rVP2. We next sought to follow up on the observed differences in in vitrodsRNA synthesis for the rVP1/rVP2 proteins of strains SA11 (R2/C5) and PO-13 (R4/C4). Specifically, we used the lack of functional compatibility of SA11 (R2) with PO-13 (C4) as a basis for mapping key regions of the polymerase that might be important for recognition by the avian RVA lineage II core shell protein. We first generated a sequence alignment to identify regions of variation between SA11 (R2) and PO-13 (R4) (Fig. 8A). We then plotted these differences onto the atomic structure of SA11 (R2) VP1 to determine their three-dimensional (3D) locations (Fig. 8B to E). While a total of 257 residues differ between SA11 (R2) and PO-13 (R4) VP1 proteins, for this study, we focused on regions of sequence diversity that were surface exposed and located on the side of VP1 that includes the⫹RNA exit tunnel. This is the region of VP1 that interacts with VP2 in that context of the DLP (i.e., transcription complex) (19). Since the enzymatic function of VP1 is VP2 dependent for both transcription and genome replication, we posited that this VP1 region might also be important for binding/activation by VP2 duringin vitrodsRNA synthesis. Thus, the regions of VP1 that were targeted for mutagenesis included the following: (i) two divergent ⫹RNA exit interface regions of the polymerase domain (PRE1) (SA11 VP1 residues 474 to 547) or the VP1 CTD (PRE2) (SA11 VP1 residues 886 to 1016) were exchanged individually or together (Fig. 8A, C, and D), and (ii) two surface-exposed, variable helix-loop regions in the VP1 NTD (VL1 and VL2) (SA11 VP1 residues 149 to 161 and 306 to 320, respectively) were exchanged individually (Fig. 8A
FIG 7In vitrofunctional compatibility of rVP1 and rVP2 proteins.In vitrodsRNA synthesis assays were performed using 2 pmol of SA11 (R2) rVP1 (A), DS-1 (R2) rVP1 (B), Wa (R1) rVP1 (C), ETD (R7) rVP1 (D), or PO-13 (R4) rVP1 (E) in the presence of 8 pmol of rVP2 protein from strains SA11 (C5), DS-1 (C2), Wa (C1), ETD (C7), and PO-13 (C4) in a mix-n-match format. All reaction mixtures contained 16 pmol
of RVA⫹RNA template and were incubated at 37°C for 180 min. Radiolabeled dsRNA products (indicated with arrowheads) were
resolved on 4 to 15% SDS-polyacrylamide gels and detected with a phosphorimager. Radiolabeled dsRNA from three independent experiments using at least two independent protein batches was quantified and expressed as relative units (RUs). Averages are shown as bar graphs below each gel, and error bars represent standard deviations from the means.
on November 6, 2019 by guest
http://jvi.asm.org/
[image:14.585.47.460.69.390.2]FIG 8Amino acid differences between SA11 (R2) VP1 and PO-13 (R4) VP1. (A) Primary amino acid sequence alignment of SA11 (R2) VP1 and PO-13 (R4) VP1. Dashes indicate gaps in the protein sequence, and colored shading represents variation in amino acid identity. The VP1
(Continued on next page)
on November 6, 2019 by guest
http://jvi.asm.org/
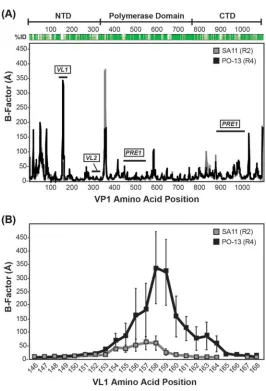
[image:15.585.41.484.65.703.2]and E). We generated chimeric rVP1 proteins in which the above-mentioned regions of the SA11 (R2) sequence were swapped with corresponding sections of the PO-13 (R4) sequence. We predicted that the chimeric rVP1 proteins would maintain their capacity to produce dsRNA in reaction mixtures containing SA11 (C5) rVP2 but that they would now also gain functional activity and produce dsRNA in reaction mixtures containing PO-13 (C4) rVP2. Molecular dynamics (MD) simulations of the SA11 (R2) atomic structure versus a PO-13 (R4) homology model revealed that VL1 is the only region predicted to be differentially flexible, with the exception of a modeled flexible loop (SA11 VP1 residues 346 to 358) that is missing from the SA11 (R2) atomic structure (Fig. 9A). Residues 155 to 161 of VL1, in particular, show greater backbone mobility in PO-13 (R4) VP1 than in SA11 (R2) VP1 as measured by B-factors calculated from the root mean square fluctuation (RMSF) of a residue’s alpha-carbons over the course of an MD simulation (Fig. 9B). The other surface-exposed regions surrounding the ⫹RNA exit tunnel of VP1 (e.g., VL2, PRE1, and PRE2), however, do not display such changes in local flexibility across the different polymerase variants, although they differ in their primary sequence.
The chimeric rVP1 proteins (PRE1, PRE1 plus PRE2 [PRE1⫹2], VL1, and VL2) were expressed alongside wild-type control proteins (SA11 [R2] rVP1 and PO-13 [R4] rVP1) in insect cells as 6⫻ histidine fusions, purified from the soluble fraction of cell lysates using metal affinity resin, and visualized following SDS-PAGE and Coomassie blue staining (Fig. 10A and B). The expression and solubility profiles of the chimeric rVP1 proteins were indistinguishable from those of SA11 (R2) rVP1, suggesting that mutant polymerases folded well enough so as to remain soluble and expose their epitope tags. In contrast, we attempted to express/purify additional chimeric proteins that included a swap of motif D (residues 642 to 668) or several different regions of the VP1 NTD; these proteins were insoluble, suggesting that they were grossly misfolded (data not shown).
The purified chimeric mutant rVP1 proteins (PRE1, PRE1⫹2, VL1, and VL2) and the wild-type counterpart rVP1 proteins were then assayed for the capacity to synthesize dsRNAin vitroin the presence of either SA11 (C5) rVP2 or PO-13 (C4) rVP2 (Fig. 10C and D). The results with SA11 (C5) rVP2 show that PRE1 rVP1 and VL1 rVP1 produced detectable, but substantially diminished, dsRNA products compared to the control proteins (Fig. 10C). Thus, the 10 PO-13 (R4)-specific amino acid changes that were introduced into the SA11 (R2) rVP1 protein (i.e., to create PRE1 rVP1) caused a loss-of-function phenotype in the polymerase. Even more, PRE1⫹2 showed no de-tectable dsRNA products, suggesting that the 39 additional PO-13 (R4)-specific muta-tions to account for PRE2 (i.e., 49 total changes in SA11 [R2] rVP1) completely ablated enzyme activity. VL1 also showed reduced activity compared to the controls, suggest-ing that the 13 PO-13 (R4)-specific residues in this surface loop also caused a loss-of-function phenotype for SA11 (R2) rVP1. In contrast, VL2 rVP1 produced dsRNA products at levels comparable to those of both control proteins, suggesting that this chimera was fully functional and that the 12 PO-13 (R4)-specific amino acid changes had no effect on SA11 (R2) rVP1 function. Unfortunately, none of chimeric proteins, not even VL2, produced dsRNA products in reaction mixtures containing PO-13 (R4) rVP2 (Fig. 10D), suggesting that the 12 PO-13 (R4)-specific amino acids were not sufficient to swap the core shell specificity of the polymerase.
Mapping regions of rVP2 that are important for rVP1 activation.We next turned our attention toward the differences in sequences and in vitro functions of the
FIG 8Legend (Continued)
domains and subdomains are represented by a line above the sequence and are colored as in Fig. 1A and B. Motifs A to F, the priming loop (PL), and VP1-VP2 interaction sites (EC1, EC2, and EC3) are identified in boxed regions. Surface-exposed regions surrounding the⫹RNA exit tunnel (PRE) and two surface-exposed loops (VL) are indicated with thick black lines above the sequence. The active site is indicated with asterisks. The amino acid position is listed above the alignment. (B) Atomic structure of SA11 (R2) rVP1 (PDB accession no.2R7R) shown in a surface representation with the⫹RNA exit tunnel facing forward and labeled. (C and D) Structure of SA11 (R2) rVP1 shown in the same orientation as in panel B with PRE1 (C) or PRE2 (D) residues colored in black and labeled. (E) Structure of SA11 (R2) rVP1 in the same orientation as in panels B to D depicted in a ribbon representation with VL1 and VL2 residues colored in black and labeled.
on November 6, 2019 by guest
http://jvi.asm.org/
mammalian SA11 (C5) and avian PO-13 (C4) core shell proteins. Specifically, we sought to determine which core shell protein regions are important for supporting in vitro
dsRNA synthesis from either a mammalian SA11 (R2) polymerase or an avian RVA (R4) polymerase. To understand the extent of sequence variation between the SA11 (C5) and PO-13 (C4) VP2 core shell proteins, we first created an amino acid sequence alignment (Fig. 11). Altogether, the proteins differ by 219 residues, with 64 of them being changes in the NTD (residues 1 to 117 in the alignment) and 155 being changes in the principal scaffold domain (residues 118 to 897 in the alignment). Based upon previous work with RVA and RVC polymerases and core shell proteins, we hypothesized that (i) the specificity of PO-13 (C4) rVP2 for its cognate PO-13 (R4) rVP1 would reside in the principal scaffold domain and (ii) divergent SA11 (C5) versus PO-13 (C4) NTDs would not be able to functionally substitute for each other (15). To test this hypothesis, we engineered a chimeric rVP2 protein containing the SA11 (C5) NTD (residues 1 to
FIG 9Molecular dynamics simulation of VP1 protein structures. Molecular dynamics simulations were performed using GROMACS v5.1.347 on a modified atomic structure of SA11 (R2) VP1 (PDB accession no. 2R7R) or on a homology model of PO-13 (R4) VP1 under conditions described previously (26, 49). Three trajectories initiated with different random seeds were run for each protein structure. The RMSF of alpha-carbons from each of the three trajectories was calculated. B-factors for each residue were calculated from the RMSF values. Average B-factors are shown for the entire VP1 proteins (A) and the VL1 regions (residues 146 to 168) (B). In both panels A and B, residue position numbers are shown on thex
axis, SA11 (R2) VP1 B-factors are plotted as gray boxes, and PO-13 (R4) VP1 B-factors are plotted as black boxes. Error bars represent standard deviations from the means following three independent simula-tions. In panel A, the percent amino acid sequence identity values are shown in a graphical represen-tation, and the domains and regions of interest according to Fig. 8 for VP1 are indicated.
on November 6, 2019 by guest
http://jvi.asm.org/
[image:17.585.72.338.64.455.2]FIG 10In vitrodsRNA synthesis by chimeric rVP1 proteins. (A) Linear schematics of recombinant VP1 proteins shown as boxes. For all genes, the SA11 sequence is shown in gray, and the PO-13 sequence is
(Continued on next page)
on November 6, 2019 by guest
http://jvi.asm.org/
[image:18.585.107.307.67.701.2]102) fused to the PO-13 (C4) principal scaffold domain (residues 118 to 897) (i.e., SA:PO rVP2) or the reverse chimera (i.e., PO:SA rVP2) (Fig. 12A). The chimeric rVP2 proteins were expressed alongside a wild-type PO-13 (C4) rVP2 control in insect cells, purified from the cell lysates by centrifugation, and visualized following SDS-PAGE and Coo-massie blue staining (Fig. 12B). Both the SA:PO and PO:SA core shell proteins were expressed and purified in a manner indistinguishable from that of the wild-type PO-13 (R4) rVP2 control. However, additional bands were detected on the gel for SA:PO rVP2 and may represent proteolysis products.
The purified, chimeric mutant rVP2 proteins (SA:PO and PO:SA) and wild-type PO-13 (C4) rVP2 were then assayed for the capacity to support dsRNA synthesis in vitroby either the SA11 (R2) rVP1 or PO-13 (R4) rVP1 protein (Fig. 12C and D). The results with SA11 (R2) rVP1 show that robust dsRNA products were made in reaction mixtures containing PO:SA rVP2 but not SA:PO rVP2, suggesting that the SA11 (C5) NTD is not sufficient to mediate activation specificity and consistent with the hypothesis that residues critical for the specific recognition of this mammalian RVA polymerase reside in the principal scaffold domain (Fig. 12C) The results with PO-13 (R4) rVP1 show that robust dsRNA products were made in reaction mixtures containing PO:SA rVP2 and that lower levels of dsRNA products were made in the presence of SA:PO rVP2 (Fig. 12D). The loss-of-function phenotype for SA:PO rVP2 relative to PO-13 (C4) rVP2 indicates that the SA11 (C5) NTD cannot functionally substitute for that of PO-13 (C4) rVP2. Thus, the avian RVA polymerase prefers an avian PO-13 (C4) rVP2 NTD, indicating that this unstructured and highly variable region of the core shell protein (and the 64 amino acid differences within it) might facilitate the interaction of VP1 with the principal scaffold domain.
DISCUSSION
RVAs are widespread in nature, infecting numerous mammalian and avian hosts and causing severe gastroenteritis in human children (1, 5). To classify the diversity and genetic relationships among RVA strains, a system was developed that assigns a specific genotype to each of the 11 genome segments according to its sequence and estab-lished nucleotide percent identity cutoff values (6) (Table 1). To date, 20 to 51 different genotypes have been described for RVA genes, and these genotypes can combine in a variety of different ways due to segment reassortment (6, 41). Some genotype combi-nations seem to be favored in certain host species, perhaps because the encoded proteins function better when they are kept together and not unlinked by reassortment (33, 41). However, the extent to which nucleotide-level intergenotypic diversity is reflected in the sequences, structures, or functions of the encoded proteins has not yet been fully described for RVAs. For instance, 22 different genotypes have been defined for the gene encoding the VP1 polymerase based upon an 83% nucleotide identity cutoff value. Thus, VP1 genes must differ by at least 17% in their nucleotide sequences to be considered distinct genotypes. Due to redundancy in the genetic code, however, ORF nucleotide sequences can differ by⬃30% and still translate the same amino acid sequence. Therefore, it is theoretically possible that some VP1 genotypes encode identical or nearly identical polymerase proteins. The same idea holds true for the 20
FIG 10Legend (Continued)
shown in black. Amino acid numbers are listed above the schematic, and general locations of mutated regions are shown. (B) Approximately 2 pmol purified SA11 (R2) rVP1, PO-13 (R4) rVP1, PRE1 rVP1,
PRE1⫹2 rVP1, VL1 rVP1, or VL2 rVP1 was electrophoresed in a 4 to 15% SDS-polyacrylamide gel and
visualized by Coomassie blue staining. Molecular masses (in kilodaltons) are shown to the left. (C and D) Radiolabeled dsRNA synthesis products synthesized by 2 pmol of each rVP1 protein in the presence of 8 pmol of rVP2 from strain SA11 (C5) rVP2 (C) or PO-13 (C4) rVP2 (D). All reaction mixtures contained
16 pmol of an RVA⫹RNA template and were incubated at 37°C for 180 min. Radiolabeled dsRNA
products were resolved on 4 to 15% SDS-polyacrylamide gels and visualized using either a phosphor-imager or autoradiography. Radiolabeled dsRNA from three independent experiments using at least three protein batches was quantified and expressed as relative units (RUs). Averages are shown as bar graphs below each gel, and error bars represent standard deviations from the means. A single asterisk indicates aPvalue of⬍0.05, and two asterisks indicate aPvalue of⬍0.005.
on November 6, 2019 by guest
http://jvi.asm.org/
different genotypes that are defined for the gene encoding the VP2 core shell protein based upon an 84% nucleotide cutoff value. For that reason, one goal of this study was to determine the level of divergence among RVA VP1 and VP2 proteins that are encoded by the currently recognized genotypes.
We employed several complementary approaches to study the intergenotypic diversity and relationships of VP1 and VP2 at the protein level. MDS was used to visualize the relationships among VP1 and VP2 genotypes based upon their pairwise
FIG 11Amino acid differences between SA11 (C5) VP2 and PO-13 (C4) VP2. A primary amino acid sequence alignment of SA11 (C5) VP2 and PO-13 (C4) VP2 is shown. Dashes indicate gaps in the protein sequence, and colored shading represents variation in amino acid identity. The VP2 domains and subdomains are represented by a line above the sequence and are colored as in Fig. 1D. The VP1-VP2 interaction site predicted by Estrozi et al. (EC) is outlined with a box. Amino acid positions are indicated above the alignment.
on November 6, 2019 by guest
http://jvi.asm.org/
[image:20.585.41.499.67.590.2]amino acid sequence distances (Fig. 2B and 3B). For both VP1 and VP2 proteins, the results showed that the avian RVA lineage II genotypes (i.e., R4, R6, R14, C4, C6, and C14) were distinct from the mammalian RVA lineage I genotypes. This result was consistent with our ORF nucleotide sequence-based phylogenetic analyses, which showed strongly supported branch separation for lineage I versus lineage II genes, as well as with our identification of numerous lineage-specific amino acid signatures for VP1 and VP2 (Fig. 2A and 3A). Thus, the data suggest that the polymerase and core shell proteins of avian RVAs are quite different from those of mammalian RVAs at both the nucleotide and amino acid sequence levels. However, the within-lineage results were not as straightforward, especially regarding the similarities among the mammalian RVA lineage I proteins. For example, many of the mammalian RVA VP1 genotypes (i.e., R2, R3, R5, R8 to R12, and R18) and VP2 genotypes (i.e., C2, C3, C5, C8 to C13, C15, and C17) could not be differentiated from each other based upon pairwise amino acid sequence distances in the MDS analysis, nor did they show any defining signature sequences (Fig. 2 and 3). Still, other mammalian RVA genotypes (e.g., R1 and C1) showed stronger definition by both by MDS and branch-specific amino acid analyses (Fig. 2 and 3). One caveat to our analysis is that we had limited sequence information for several of the more recently identified genotypes (i.e., R8 to R12, R14 to R18, C8 to C14, C17, and C18). It is possible that defining features will be more apparent once additional sequences
FIG 12In vitrodsRNA synthesis by chimeric rVP2 proteins. (A) Linear schematics of recombinant VP2 proteins shown as boxes. For all genes, the SA11 sequence is shown in gray, and the PO-13 sequence is shown in black. Amino acid numbers are listed above the schematic, and general locations of mutated regions are shown. (B) Approximately 8 pmol purified PO-13 (C4) rVP2, SA:PO rVP2, or PO:SA rVP2 was electrophoresed in a 4 to 15% SDS-polyacrylamide gel and visualized by Coomassie blue staining. Molecular masses (in kilodaltons) are shown to the left. (C and D) Radiolabeled dsRNA was synthesized by 2 pmol of either SA11 (R2) rVP1 (C) or PO-13 (R4) rVP1 (D) in the presence of 8 pmol of each rVP2 protein. All reaction mixtures contained 16 pmol of an RVA⫹RNA template and were incubated at 37°C for 180 min. Radiolabeled dsRNA products were resolved on 4 to 15% SDS-polyacrylamide gels and visualized using a phosphorimager. Radiolabeled dsRNA from three independent experiments using at least two protein batches was quantified and expressed as relative units (RUs). Averages are shown as bar graphs below each gel, and error bars represent standard deviations from the means. Double asterisks indicatePvalues of⬍0.005.
on November 6, 2019 by guest
http://jvi.asm.org/
[image:21.585.49.362.71.363.2]are available for these genotypes. It is also important to note that 6 genotypes (R17, R21, R22, C16, C19, and C20) were not included in our analysis because their sequences were not available in the database when this study began. Future studies in our laboratories will continue to assess VP1 and VP2 sequences as new genotype sequences become available, with the overall goal of understanding the impact of this naturally occurring sequence diversity on VP1/VP2 structure, function, and interactions. Even more, our long-term goal is to extend this analysis to the other 9 viral proteins, thereby providing a comprehensive understanding of protein-level RVA diversity in nature.
As an extension of our intergenotypic bioinformatic analyses, we also wanted to identify which regions of the VP1 and VP2 proteins tolerated amino acid changes versus which regions remained largely invariant, so as to inform an understanding of func-tional and interacfunc-tional domains. To do this, we created genotype consensus amino acid sequence alignments and interpreted the conserved/variable regions in light of known protein domains, subdomains, and motifs (Fig. 4 and 5; see also Fig. S1 and S2 in the supplemental material). Somewhat to our surprise, the variation in VP1 was fairly distributed throughout the protein sequence and was seen even in some of the catalytic motifs of the polymerase domain (Fig. 4 and Fig. S1). Motif D, which is implicated in polymerase fidelity, was highly variant in sequence among all of the genotypes (Fig. 4 and Fig. S1). Also, R20 showed several deviations from the consensus for motifs B and F, implying that more evolutionary plasticity can occur within the catalytic core than what was previously thought (7) (Fig. 4 and Fig. S1). However, there is only a single representative of the R20 genotype, which was derived from a metagenomic analysis of bat feces; therefore, it is possible that these R20-specific changes are sequencing errors (29). In general, the VP2 contact points on VP1 that are predicted by Estrozi et al. in the DLP structure were conserved across all of the genotypes, with the exception of the site spanning CTD residues 971 to 983 (i.e., EC2) (19) (Fig. 4 and Fig. S1). This region showed several amino acid changes, especially in comparisons of the mammalian RVA lineage I versus avian RVA lineage II VP1 proteins (Fig. S1).
The VP2 alignment was generally more conserved than that of VP1, with the dramatic exception of the NTD (residues⬃1 to 100), which showed minimal sequence similarities among the genotypes (Fig. 4 and 5). This result confirms and extends previous studies and suggests that the VP2 NTD can tolerate a vast amount of variation, including large insertions and deletions in its sequence (15, 42). The VP2 NTD is nonessential for formation of the T⫽1 core shell, but it plays an important role in VP1 engagement and activation (7, 15, 38–40). However, this region does not seem to mediate sequence-specific VP1 interactions; instead, it may play a structural role in supporting VP1 contacts with the principal scaffold domain of VP2 (15). More specifi-cally, the results using NTD chimeras in this study (Fig. 12) and in a report by McDonald and Patton show that strain-specific VP1 activation correlates with the VP2 principal scaffold domain, not the NTD (15). Interestingly, the VP1 contact points within the principal scaffold domain that are predicted from the DLP structure (EC) (residues 377 to 403 of strain UK) are⬎99% conserved among the genotypes (19) (Fig. S2). Indeed, if this was the key site of VP1 binding for enzymatic activation during dsRNA synthesis, one would expect that all of the different VP2 genotype proteins would functionally substitute for each other (see also below).
Having observed the regions of amino acid sequence variation among the VP1 and VP2 genotypes, our next goal in this study was to determine if/how this variation correlated within vitrofunctional interactions between the proteins. More specifically, we employed an establishedin vitroassay in which rVP1 performs minus-strand RNA synthesis on a⫹RNA template (to produce dsRNA) only when it is engaged/activated by rVP2. We reasoned that if different genotypes could functionally substitute for each other in vitro, they must show conserved sequences at their binding interfaces. In contrast, those genotypes that do not substitute for each other would show sequence variations at binding interfaces. For this analysis, we chose to use the rVP1 and rVP2 proteins of five different RVA strains (SA11, DS-1, Wa, ETD, and PO-13) that include
on November 6, 2019 by guest
http://jvi.asm.org/
representatives of mammalian RVA lineage I genotypes (R1, R2, R7, C1, C2, C5, and C7) as well as a single strain representing avian RVA lineage II genotypes (R4 and C4). We tested all rVP1 genotypes for the capacity to synthesize dsRNA in the presence of all rVP2 genotypes (Fig. 7). Unfortunately, the ETD (R7) polymerase and the DS-1 (C2) and Wa (C1) VP2 proteins were not fully functionalin vitrounder the tested conditions. Still, the results from the mix-n-match reactions with the 4 functional polymerases (SA11 [R2], DS-1 [R2], Wa [R1], and PO-13 [R4]) and the 3 functional core shell proteins (SA11 [C5], ETD [C7] and PO-13 [C4]) yielded several important observations.
The first observation is that lineage I rVP1s seem to prefer lineage I rVP2s. More specifically, we observed that the mammalian RVA lineage I rVP1s (SA11 [R2], DS-1 [R2], and Wa [R1]) were activated only by mammalian RVA lineage I rVP2 proteins (SA11 [C5] and ETD [C7]) and not the avian RVA lineage II PO-13 (R4) genotype (Fig. 7). This result supports the notion that lineage I rVP1s may have evolved interaction specificity for lineage I rVP2s and lost the capacity to interact with lineage II rVP2. Still, it will be important to test this notion in future studies using other lineage II rVP2 genotypes (e.g., C6 and C14). If the observation holds true, however, the lineage-specific amino acid signatures that we identified via our analysis will be useful in mapping the activation specificity determinants (Fig. 1A and 2A).
The second observation is that SA11 (C5) rVP2 seems to be a “promiscuous” core shell protein. In particular, the result that SA11 (C5) rVP2 robustly activated both the mammalian RVA rVP1 proteins (SA11 [R2], DS-1 [R2], and Wa [R1]) as well as the avian PO-13 (R4) rVP1 protein suggests that this is a broadly functional core shell protein that can engage many divergent polymerases. At this time, we do not know why SA11 (C5) rVP2 is so active in vitroor whether this is a general characteristic of C5 genotype proteins. Nevertheless, this result indicates that SA11 (C5) rVP2 might engage the polymerases via a conserved region(s) and in a manner that is different from how PO-13 (C4) rVP2 engages its cognate polymerase (see below).
The third observation is that PO-13 (C4) rVP2 seems to be “faithful” to its own polymerase. For instance, the result that PO-13 (C4) rVP2 specifically activated the avian PO-13 (R4) polymerase but not the mammalian RVA polymerases (SA11 [R2], DS-1 [R2], or Wa [R1]) suggests that this core shell protein is specific to its cognate polymerase. In the future, it will be interesting to assay the additional lineage II genotype proteins (R6, R14, C6, and C14) to see if this result is simply a reflection of avian RVA lineage II specificity. Still, the current result indicates that residues differing between PO-13 (R4) and SA11 (R2) are important for binding/activation by the avian RVA core shell protein. We were especially intrigued by these results and wanted to use the differences between these polymerase proteins as a platform to map VP1-VP2 interaction regions that are critical forin vitrodsRNA synthesis. Specifically, we attempted to engineer an SA11 (R2) rVP1 protein that contained enough PO-13 (R4) residues that it would gain the capacity to be activated by PO-13 (C4) rVP2 (Fig. 8 and 10). We focused on swapping out surface-exposed residues that lie at the ⫹RNA exit interface of VP1, which is the proposed side of VP2 contact in the DLP structure (19). The PRE1⫹2 chimera included the divergent EC2 site; both EC1 and EC3 were conserved between the polymerases, and thus, there was no rationale for altering them (Fig. 8). Unfortu-nately, none of the engineered rVP1 chimeras were active in the presence of PO-13 (C4) rVP2. In fact, three of the chimeras actually lost their capacity to be activated by the promiscuous SA11 (C5) rVP2 protein, indicating that the polymerases might adopt conformations that are no longer capable of interacting with VP2 in the manner necessary for activation (Fig. 10). This result was surprising to us because most of the residues that we changed are surface exposed and not implicated in supporting the intramolecular VP1 structure. For instance, the VL1 chimera swapped out a flexible helix-loop element on the surface of the VP1 NTD (Fig. 8 and 10). The PO-13 (R4) VL1 surface element is clearly functional in the context of a PO-13 (R4) backbone but not on the SA11 (R2) backbone, at least in regard to activation by SA11 (C5) rVP2 (Fig. 10). The one chimera that retained functionality with SA11 (C5) rVP2 (i.e., VL2 rVP1) also swapped out a nonflexible, surface-exposed helix-loop element (Fig. 10). However, this
on November 6, 2019 by guest
http://jvi.asm.org/
particular swap (and the 12 amino acid changes within it) was not sufficient to allow recognition by PO-13 (C4) rVP2. Ongoing experiments in our laboratories are assessing the role of VP1⫹RNA exit tunnel interface residues by performing single and clustered point mutagenesis (C. L. Steger, C. Boudreaux, C. Cohen, and S. M. McDonald, unpub-lished data). Such work will further our understanding of whether or not the VP1-VP2 contact points observed in the DLP structure play important roles during dsRNA synthesis.
We also engineered chimeric rVP2 proteins that have swapped either the NTD or principal scaffold domains between SA11 (C5) rVP2 and PO-13 (C4) rVP2 (i.e., PO:SA and SA:PO). Consistent with a previous study using RVA versus RVC proteins, our results with PO:SA and SA11 (R2) rVP1 show that the specificity of rVP2 for a particular rVP1 protein lies in the principal scaffold domain and not the NTD (Fig. 12) (15). However, the result with SA:PO also shows that rVP2 proteins with a “mismatched” NTD and principal scaffold domain are less robust in supporting polymerase activation than are those with matched domains (i.e., wild-type PO-13 [C4] rVP2). This result indicates that there are as-yet-unknown intramolecular interactions between the NTD and the principal scaf-fold domain. It is possible that the presence and sequence of the NTD are important for proper folding of the principal scaffold domain, at least in regions that mediate VP1 binding. Because the VP1 contact sites on VP2 that are predicted in the DLP (EC) (residues 377 to 403 of strain UK) are completely conserved among all genotypes, it is unlikely that they are involved in dictating polymerase specificity in the context of genome replication.
Altogether, the combined results of these bioinformatic analyses andin vitroassays raise questions about the possibility that VP1-VP2 contact points differ during tran-scription and replication and might even differ depending upon the precise genotype/ strain combinations tested. Still, a limitation of our study is that we are using thein vitro
dsRNA synthesis assay as an indirect readout of functional rVP1-rVP2 interactions. At this time, we cannot exclude the possibility that enzymatic activation of rVP1 by rVP2 occurs via a mechanism that is independent of direct interactions between these proteins. For example, it is possible that rVP2 binds to the⫹RNA template, rather than to rVP1, and induces structural changes within the⫹RNA that allow it to bind to the polymerase in a manner that is “in register” with the catalytic site. In this case, polymerase activation would still depend upon the presence of the core shell protein, but it would occur independent of direct rVP1-rVP2 protein interactions. Unfortunately, due to the natural propensity of the core shell protein to asymmetrically multimerize and the presence of copurifying contaminants/proteolysis products, the rVP2 prepara-tions are not amenable to standard protein-protein interaction assays (38–40). Future experiments in the laboratory will employ a virus-like particle (VLP) approach, which relies on the coexpression of rVP1, rVP2, and rVP6 in insect cells and the formation of double-shelled capsids containing the polymerase, to detect rVP1-rVP2 interactions (39, 40, 43). We have previously used this approach to show that RVC rVP1 (strain Bristol) failed to be efficiently packaged into VLPs made with RVA rVP2 (strain SA11) (43). For this protein pair set, the lack of VLP interaction correlated with a lack of in vitro
activation in the dsRNA synthesis assay (15, 43). Indeed, future investigations into how the activity of the RVA polymerase is regulated by the core shell protein and whether or not VP1 activation requires VP2 binding are warranted and will enhance our understanding of a critical step in the viral replication cycle.
MATERIALS AND METHODS
Intergenotypic bioinformatics analyses of VP1 and VP1.A total of 158 nucleotide sequences representing all available VP1 and VP2 genotypes (R1 to R22 and C1 to C20) were obtained from the NCBI (https://www.ncbi.nlm.nih.gov/nuccore) and trimmed to ORF boundaries (see Table S1 in the supple-mental material). ORF nucleotide sequences were translated, aligned as amino acids using MAFFT with default settings, and untranslated using Python scripts (http://www.github.com/jbpease/mixtape) (44). At the time of the study, genotypes R17, R21, R22, C16, C19, and C20 had no available sequences in the database and were thus excluded from the study. However, most genotypes had 1 to 9 VP1 and VP2 ORF sequences available (Table S1). For genotypes with⬎10 availabl