University of southern Queensland
Faculty of Engineering and Surveying
INTERACTIVE MAP ASSOCIATED WITH TOURISM
A dissertation submitted by
Anthony Newman
In fulfilment of the requirements of
Courses ENG4111 and 4112 Research Project
Towards the
Graduate Diploma in Geographic Information Systems
ABSTRACT
The Cartographer with the tools of today’s visualisation , interactivity, multimedia and presentation media all made possible by the computer, has the ability to transform the traditional paper map view into a three – dimensional visualization voyage of discovery.
The general objective in this project was to develop an interactive map associated with tourism, using the cartographic tools of today using past data to develop a map product that will present the relevant material to a users associated with tourism, in an effective manner.
The challenge defined by the objectives was to convey the images of the quarry at Blue Circle Southern Cement’s (BCSC) Waurn Ponds mine site to the user who was identified as, a sightseer, a student or a mine employee or a person or organisation involved in the tourism industry. The needs of the user were to see the dynamic ever changing terrain of the quarry, the processes of mineral extraction, the layers of geology all incorporated simply in an interactive multimedia display based on photo maps used in a way to aid the communication of information.
These images were created with the 3D visualization tools of Geographic information Systems (GIS) and generated from data associated with past land surveys, rejuvenated for this map and aerial photographs rectified to existing surfaces. The format of these 3 Dimensional (3D) visualisation has included an aerial photograph draped over a digital terrain model and rotated to present an 3D animation revealing an informative view of the site. A virtual 3D fly through was created along the haul road system slicing through the reclaimed landscape of past mining site. To highlight the past a temporal display dating back over six years was produced with colour and 3D enhanced landscapes in an effective display. The mining processes of the open cut quarry shows limestone removal and transportation to processing locations. The dumping of overburden that was stripped from above the limestone, this was all captured in digital video enriched by the sounds of powerful machines as they worked.
The final result is an informative interactive map that is presented simply, well within the potential of PowerPoint; a friendly, widely available and versatile multimedia presentation package. This has allowed the focus to remain on the user while utilising large data sources and presenting advanced forms of 3D visualisation.
University of Southern Queensland
Faculty of Engineering and Surveying
ENG4111 Research Project Part 1 &
ENG4112 Research Project Part 2
LIMITATIONS OF USE
The Council of the University of Southern Queensland, its Faculty of Engineering and Surveying, and the staff of the University of Southern Queensland, do not accept any responsibility for the truth, accuracy or completeness of material contained within or associated with this dissertation.
Persons using all or part of this material do so at their own risk, and not at the risk of the Council of the University of Southern Queensland, its faculty of Engineering and Surveying or the staff of the University of Southern Queensland.
This dissertation reports an educational exercise and has no purpose or validity beyond this exercise. The sole purpose of the course pair entitled “Project and Dissertation” is to contribute to the overall education within the student’s chosen degree program. This document , the associated hardware, software, drawings, and other material set out in the associated appendices should not be used for any other purpose: if they are so used it is entirely at the risk of the user.
Professor Frank Bullen
Dean
CERTIFICATION
I certify that the ideas, designs and experimental work, results, analyses and conclusions set out in this dissertation are entirely of my own work, except where otherwise indicated and acknowledged
I further certify that the work is original and has not been previously submitted for assessment in any other course or institution, except where specifically stated.
Anthony Newman
Student Number – 00039710369
Signature
31.10.2007
ACKNOWLEDGMENTS
I would like thank to Dr Armando Apan from the University Of Southern Queensland for his guidance throughout the year. I would like to also acknowledge Alex Walker the mine manager at BCSC Waurn Ponds mine site, for his encouragement of the project and his interest in educating the community about the Quarry. And the access given to me, to the mine site and existing data.
TABLE OF CONTENTS
Contents Page
ABSTRACT II
LIMITATIONS OF USE III
CERTIFICATION IV
ACKNOWLEDGMENTS V
TABLE OF CONTENTS VI
LIST OF FIGURES X
LIST OF TABLES XII
LIST OF TABLES XII
GLOSSARY OF TERMS XIII
CHAPTER 1 14
1 INTRODUCTION 14
1.1 Introduction 14
1.2 Statement of the Problem 14
1.3 Significance of the study 15
1.4 Objectives 15
1.5 Scope and Limitations of Use 16
1.6 Organisation of the Dissertation 16
CHAPTER 2 17
2 LITERATURE REVIEW 17
2.1 Introduction 17
2.2 The Map Users 17
2.3 The Map 18
2.4.2 Multimedia 21
2.4.3 3D & Terrain Visualization 22
2.4.4 Animation 23
2.5 Software 25
2.5.1 GIS 25
2.5.2 Survey Software 26
2.5.3 Presentation Software 27
2.6 Aerial Photography 27
2.6.1 From the Plane to the Computer 27
2.6.2 Mosaics 28
2.6.3 Image Geocoding 28
2.6.4 Image Compression 29
2.6.5 Digitized aerial Photos and GIS 31
2.7 Hardcopy vs Computer Display Maps 32
2.8 Issues Associated with Animated Interactive Maps 32
2.9 Summary 33
CHAPTER 3 34
3 RESEARCH METHODS 34
3.1 Introduction 34
3.2 The Site 34
3.2.1 The Location 35
3.2.2 The Geological View 37
3.2.3 The Mining Process 38
3.2.4 The Factory Process 40
3.3 Data Capture and Acquisition 40
3.3.1 Available data 40
3.3.2 Terrestrial Survey Data 42
3.3.3 The Here Solution by GPS 44
3.3.4 Photographic material 45
3.3.5 Computer Hardware and Software 45
3.4 Data Processing 46
3.4.1 Photo Maps 46
3.4.2 : Terrestrial Audit Surveys for Temporal Mapping 52
3.4.3 : Processing Data for 3D Visualization 52
3.4.6 Multimedia Enhancement 57
3.4.7 Data Presentation In PowerPoint 58
3.5 Summary 60
CHAPTER 4 61
4 RESULTS 61
4.1 Introduction 61
4.2 Presentation of the interactive map 61
4.3 Images and Multimedia 63
4.4 Temporal 3D Maps 69
4.5 Summary 71
CHAPTER 5 72
5 DISCUSSIONS 72
5.1 Introduction 72
5.2 The Interpretation of the Map 72
5.2.1 Interpretation of Map User 72
5.2.2 Interpretation of the Levels 73
5.2.3 Interpretation of Level One 76
5.2.4 Interpretation of Level Two 77
5.2.5 Interpretation of Level Three 79
5.2.6 Interpretation of Level Four 82
5.2.7 Interpretation of Level Five 87
5.3 Interpretation of 3D Visualization Created for the Map 88
5.3.1 Interpretation of Animated Rotation 3D Maps 88
5.3.2 Interpretation of Virtual 3D Fly Through 90
5.3.3 Interpretation of 3D Temporal Mapping 90
5.4 Interpretation of the Presentation in PowerPoint 92
5.4.1 Interpretation of the Interactive Map 92
5.4.2 Interpretation of Similar Map Products 95
5.5 Summary 96
CHAPTER 6 98
6.3 Recommendations for Practical Applications 99
6.4 Recommendations for Future Research 99
REFERENCES 100
APPENDIX A 101
APPENDIX B 102
APPENDIX C PowerPoint Presentation CD
LIST OF FIGURES
Figure 1 : MacEachren’s three visualization strategies (1994) map use
cube ... 18
Figure 2 : Example of a TIN from LISCAD’s Terrain Modelling package ... 23
Figure 3 : Example of a aerial photo ... 28
Figure 4 : Raster data set properties taken from ArcMap ... 31
Figure 5 : Sketch showing location of Waurn Ponds site ... 35
Figure 6 : A view along Hams rd looking east on the north of the site... 36
Figure 7 : Fossils found in the quarry during a volumetric audit survey. These objects date back millions of years. The tooth displayed here measures 2.5 cm... 38
Figure 8 : A Scraper and Bull Dozer travelling on overburden deposits ... 39
Figure 9 : GPS base station unit logging data looking south, across rehabilitation areas the quarry to the factory ... 43
Figure 10 : Image showing one of the Ground Control Points, placed on site before the aerial photography was flown ... 48
Figure 11 : Level data in terrestrial survey in LISCAD ... 49
Figure 12 : Level data in Aerial Photo in LISCAD... 50
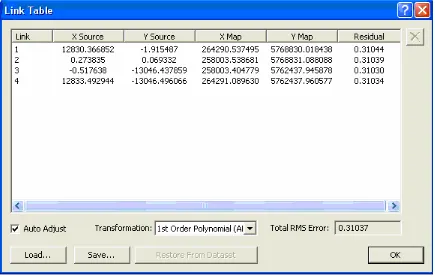
Figure 13 : Link Table from ArcView Georeference procedure... 51
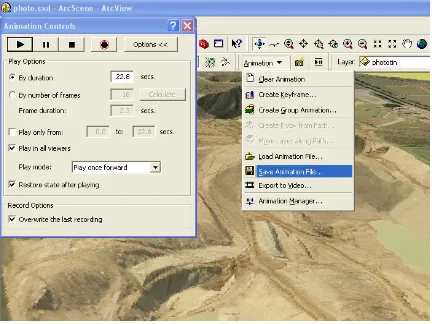
Figure 14 : View from ArcScene showing animation controls and animation pull down menu... 56
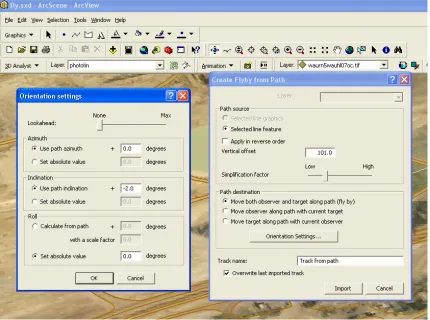
Figure 15 : View from ArcScene showing Fly through menus... 57
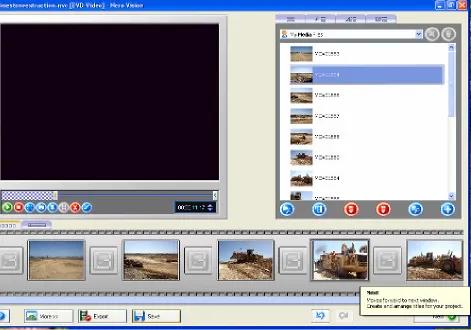
Figure 16 : Screen setup for video editing within Nero Multimedia package ... 58
Figure 17 : PowerPoint Slide no. 9 Photo Map of the Working Quarry ... 59
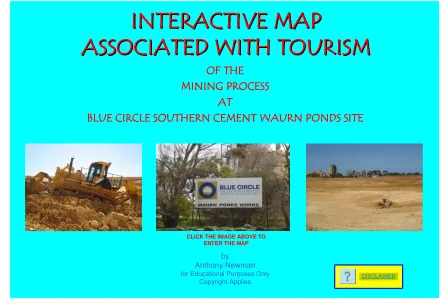
Figure 18 : PowerPoint Slide no. 1 Interactive Map Associated with Tourism ... 62
Figure 19 : PowerPoint Slide no. 9 Photo Map of Working Quarry... 63
Figure 20 : Image looking south from crusher building up to the factory ... 64
Figure 21 : Georeferenced image overlayed with feature line work in ArcView ... 65
Figure 22 : PowerPoint Slide no. 3 Photo Map of The Waurn Ponds Site ... 66
Figure 23 : PowerPoint Slide no. 8 Introducing Waurn Ponds Quarry... 67
Figure 24 : View from animation quarryoverview.mpg created by ArcScene ... 68
Figure 25 : PowerPoint Slide no. 10 View of Quarry Management an Maintenance Buildings ... 69
Figure 26 : PowerPoint Slide no. 18 Temporal Mapping ... 70
Figure 27 : PowerPoint Slide no. 20 Quarry Audit Survey October 2003... 71
Figure 31 : PowerPoint Slide no. 12 View of Machines on Exposed
Limestone Bed ... 82
Figure 32 : PowerPoint Slide no. 17 Steps in Open Cut Mining of Limestone... 83
Figure 33 : PowerPoint Slide no. 10 View of Quarry Management an Maintenance Buildings ... 84
Figure 34 : PowerPoint Slide no. 14 View of the overburden and limestone beds... 85
Figure 35 : view of PowerPoint slide no. 6 Locality Map ... 87
Figure 36 : View from geologytxt.mpg... 89
Figure 37 : PowerPoint slide no.19 Quarry Audit Survey October 2002 ... 92
Figure 38 : View of PowerPoint slide no. 2 ‘Help Page’ ... 94
LIST OF TABLES
Table 1 : Important map design stages in computer cartography. ... 19
Table 2 : Exploratory acts of exploration... 21
Table 3 : 2 Methods of DTM creation... 22
Table 4 : Animation Variables. ... 24
Table 5 : ArcGIS Desktop products ... 26
Table 6 : The processes involved with image geocoding... 29
Table 7 : Two Forms of data compression ... 29
Table 8 : Compression file types... 30
Table 9 : DEM resolutions requirements ... 32
Table 10 : Four challenges associated with animation... 33
Table 11 : Aerial images and associated data of the site... 41
Table 12 : Survey datum’s of terrestrial surveys... 43
Table 13 : Audit surveys available for use ... 44
Table 14 : Computer hardware used for project... 45
Table 15 : Computer software used for project... 46
Table 16 : Some limitations of aerial photography ... 47
Table 17 : Aerial photography selection criteria ... 47
Table 18: Audit Survey data incorporated in map ... 52
Table 19 : ArcView Pre Processing Tasks ... 53
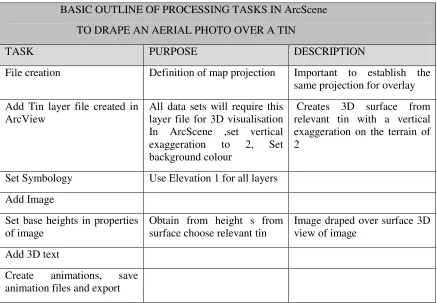
Table 20 : Basic outline of processing in ArcScene to drape aerial photograph over a TIN... 54
Table 21 : Basic outline of processing tasks in ArcScene of survey audits for temporal mapping ... 55
Table 22 : Level s of interactivity and information... 74
GLOSSARY OF TERMS
Abbreviation Description
BCSC – Blue Circle Southern Cement
ET – Earth Tech Engineering Pty Ltd.
ITM – Interactive Tourist Map
2D – Two-dimensional
3D – Three-dimensional
DTM – Digital Terrain Model
DEM – Digital Elevation Model
ESRI – Environmental Systems Research Institute
GIS – Geographic Information System
TIN – Triangular Irregular Network
DN – Digital number
USQ – The University of Southern Queensland
GPS – Global Positioning System
AMG66 – Australian Map Grid 1966
MGA94 – Map Grid Australia 1994
AVI – Animation file extension
CHAPTER 1
1
INTRODUCTION
1.1
Introduction
Blue Circle Southern Cement (BCSC), Waurn Ponds Site, is located to the south west of Geelong on its urban fringe. The interactive tourist Map I have developed does highlight the mining process which is to mine limestone to supply the factory that produces clinker, from the quarry limestone to produce ‘Ordinary Portland Cement’. The interactive tourist map would be used by tourists including visitors, school groups for example and by BCSC as an educational and promotional tool.
The setting is a limestone, open cut quarry and factory producing cement from the limestone. Large machines are used to unravel the layers of time called overburden, to get to the limestone deposits and transport it to the factory. Processing of the limestone takes place and Clinker is the final product, which is bulk transported off site to BCSC bag handling plants, via rail and road.
1.2
Statement of the Problem
As time moves on, the mine also travels, searching for the limestone like a slow but persistent whale searching the oceans for krill. The mining machine devours a wall of overburden covering the limestone bed, deposited millions of years ago as the ocean receded. The overburden now falls as fill in the reclamation areas, as the beast moves forward and the trail is washed away by this reclamation. How do we transform and present this image of the mine to the tourist?
Knowing how to utilise and get the best result from the many data sources is a technical issue. Questions appear of do l use it, or just keep it simple, what will be the map readers reaction, will it convey its message, will people switch off, or simply blink and miss it?
A further challenge is the wide variety of possible users and the complexity of the interactivity of the map. Map users will have different standards of interaction and the map needs to cater for all levels. By developing this map a first hand impression of the mining process at this quarry could be gained with out setting foot in the Quarry. The information presented within the map can give rise to further exploration external to the map. With the supply of quality information at every stage of tourism more is gained by the user.
For effective communication of spatial data, videos and sound used to create an interactive tourist Map related software needs to be mastered. We also must make the map useable by the majority of users have simple interactivity tasks that are obvious and have more depth so that users can be encourage to explore and discover. Cartographic rules applicable to map design need to maintained.
With the aid of ArcGIS 9 data will be enhanced with the extensions of the ArcGIS software package. Geographical Visualisation, techniques of Temporal mapping imagery are used to show movement over the past 10 years of the mining activities. The unique visualisation technique of the Fly Through to stimulate ones awareness to the new view, and the use of videos and sounds to provide further exploration of the mine and its processes.
1.3
Significance of the study
Interactivity is a changing arena of tools. To develop an interactive map is to try or even customise interactive techniques so they work in your project. Here we have a opportunity to present this data used in other areas but extended to be used as data for a tourist map, utilizing the capacity for interactivity and introducing a management programme to administer the quarry’s data bases.
BCSC with the completion of this project will have a means of introducing the works environment in a safe and controlled manner as opposed to having tourists in the mine in mining vehicles on a wet and unstable surface. BCSC will have the ability to see how visualisation technology can be used as a presentation technique and how it will be possible to expand the type of data presented and the use of the map. Moving from a presentation field of the tourism map to a spatial information system capable of performing analysis and queries on a GIS package to the next layers of exploration.
The limestone quarry is now bordering the fringe of Geelong’s sprawling urban environment. A interactive map of the BCSC operations could help bridge the gap between any community pressures that may be building due to the mine and residential development.
1.4
Objectives
The aim of this research project is to develop an interactive map associated with tourism, presenting the mining process of the quarry, with a focus on map interactivity that is suitable and available for a variety of users. Specifically, the objectives are:
To identify the users of map product(s), the user needs, and the different mining activities that can be considered in developing cartographic visualisation and interactivity tools
To develop a map based product that features appropriate geographic visualisation and interactivity components. This will be done with data from terrestrial, GPS, and Photogrammetrical surveys and photographic material. Geological data recorded via survey and documents relevant to the site will be also included. This will be presented on Microsoft’s PowerPoint slides incorporating data processed via ArcGIS 9.2 GIS software, and land survey specific software LISCAD and Autodesk.
1.5
Scope and Limitations of Use
This is not a study into the mine but an interactive map associated with tourism to supply relevant information to the maps users. Data that has been used and presented is actual survey data of a working mine and it was used for volumetric calculation for BCSC. The information shown here cannot be used for any other purpose other than a Tourist map. Data varying accuracies has been incorporated in the interactive map, and vertical exaggeration used in the display, the reason being to enhance some of the three dimensional (3D) images in the map
1.6
Organisation of the Dissertation
This dissertation has been organised into six chapters and includes appendices and ancillary pages. This section will provide an outline of the content of each chapter briefly.
Chapter one is the introduction to the dissertation discussing problems, significance of the study, project objectives and scope and limitation of the project.
Chapter two forms the literature review covering map users, concepts of the map, techniques used for mapping, software, aerial imagery and discussions on digital maps and issues on interactivity.
Chapter three identifies the site for the interactive map and related issues and discusses data capture, acquisition and data processing at length.
Chapter four covers the results achieved from the steps in the previous chapter and how the interactive map has been presented. Chapter Five goes on and discusses these results in detail with the focus on the presentation of the map for the user.
CHAPTER 2
2
LITERATURE REVIEW
2.1
Introduction
The different sections in this chapter represent the areas of interest for the interactive map associated with tourism. The interactive map utilising visualisation and multimedia helps define the mining process and presents the mine site to the user without the user entering the working mine site. The map will be additionally used as an educational and promotional tool drawing on the map making tools contained within the tool box of GIS and multimedia. A simple search on the internet for interactive tourist maps will reveal the extents to which the tourist and business communities(both private and government), around the world have grasped this form of promotion, an created a new industry.
Initially the map users and the concept of interactivity will be discussed. Then the techniques and software used to create and present interactivity and the concept of aerial photography are outline. The different methods of presentation being a hardcopy map verus the virtual map initially and for example the various forms of maps, thematic and topographic maps. Finally the issues associated with interactive maps are discussed.
2.2
The Map Users
Maps are designed for the user and the data selected for representation by the cartographer reflects this. An interactive map associated with tourism that can be used for educational and promotional purposes requires cartographic design and construction to ensure the maximum benefit from the map by a variety of users. The student on a field trip may have a different requirements of the map to those of a new employee viewing the map as part of a safety induction overview into their new workplace. Users should be confident in using the map to develop cognition and communication.
Figure 1 : MacEachren’s three visualization strategies (1994) map use cube
2.3
The Map
The map will be created by the cartographer whose role has evolved with the industry around them and now incorporates a GIS toolbox and multimedia presentations with new techniques and opportunities for presentation.
This chapter will review concepts relevant to the map and associated issues. The relationship between the user and the map, the role of interactivity and visualisation and techniques that have been applied here , software and the production of aerial photography briefly. Finally the issues associated with digital maps and interactivity
2.3.1 Cartography
The map was once the domain of the cartographer. The paper map was only form of presentation a few decades ago, a static representation of information a form of visualisation none the less. Cartography is defined by Keith Clarke as “the science, art and technology of making, using, and studying maps” (KC Clark 2003 p27). Cartography has now been transformed from the representation of map data from the Land Surveyors, lithographic plans, to GIS. GIS has seen rapid technological growth that has forced a redefinition of the role of the cartographer leading to the GIS being the main source of plan output by the cartographer.
Kirsi Artimo highlights the role of the cartographer now as “the bridge between Cartographic and Geographic Information systems“ (K Artimo, 1994.p57). Artimo goes on to say that cartographers now have to continue their role and provide the cartographic knowledge within the GIS as defined in the CIS (cartographic information system) that exist within the GIS. This role is confirmed by M Kraak & F Ormeling, with the idea that initially GIS would replace the cartographer through a knowledge based system within the GIS, but it has not been the case (M Kraak & F Ormeling 2003).
The table below ‘ Important Map Design Stages in Computer Cartography’ shows the steps involved in producing digital maps. The impact of computers on map making and cartography has been dramatic. The computer is now involved in all areas of mapping and now allows cartographers to produce multiple maps from data bases in a cost effective and timely fashion “and computers are the current technology with which maps are made” (K C Clark 1995 p292).
Table 1 : Important map design stages in computer cartography.
2.3.2 Interactivity
The interactive map as described by Dr F Young and Dr A Apan “is a computer assisted presentation that attempts the display of mental maps in the mind” (F Young & A Apan 2005 p4.9). Multimedia has developed a high level of interactivity in the computer map environment, it has given the user a choice of what information they will access by the use of hyperlinks, to interact with the media. The user is no longer the observer.
Hyperspace is an interactive environment developed by hypermedia for cartography to use in presentint computer maps and is linked to the creation of mental maps as mentioned above. The use of images as seen in this project has allowed the association not dissimilar to how the mind works, i.e. one thought leads to another. The image presented in the map allows further data to be associated with it via the use of hypertext and the associated electronic links This is because of the relationship it is perceived to have and this can continue into many levels of hyperspace (MP Peterson.1995) .
The map is no longer a static environment and the multimedia slide show has progressed from what was a rigid, sequential format to utilising hypermedia within the map in a non sequential manner.
IMPORTANT DESIGN STAGES IN COMPUTER
CARTOGRAPHY
Geocoding Define the spatial location
Mapping Transformed Data
Symbolisation Data Compilation – attribute & metadata
Representation of the data - temporal, dot, topographical.
Design of the map – scale, layout, text
Symbol selection – shape. Size, colour
Map Reading Map use- single or multipurpose map
Map interpretation
2.4
The techniques used in Computer Maps
The cartographer today has a catalogue of visualisation tools to use in the production of computer generated map displays. The major concepts that are used in this project and multimedia will be covered in the following section.
2.4.1 Visualization
Visualisation is described by Cartwright Miller and Pettit, as the process of visualization which refers to computer generated imagery that is linked to creativity. “Creativity is the organisation of information into new patterns from selected images stored in the unconscious mind” (Cartwright Miller and Pettit, 2004 p26).
The concept of ‘scientific visualization’ (M Kraak & F Ormeling 2003), conveys geospatial information from which analysis can be derived via private visual thinking and communicated publicly via geographical visualisation to end users (DiBiase 1990). The digital map allows the user to interact on many levels and has brought to the cartographer the 3 dimensional map and animation with M Kraak & F Ormeling going on to say that “maps are no longer the products they used to be” (M Kraak & F Ormeling 2003 p1). They now have the dual role of data storage and presentation with a concept of geospatial data infrastructure (GDI). Visualisation tools are used in GIS processes and these tools are well developed to cater for effective communication (M Kraak & F Ormeling 2003).
Visualization is a collection of technologies that play a major role in cartographic representation for map presentation. Cartographic visualisation involves three technical levels and examples as follows; (B Jiang, 1996).
1) application - Purpose of map
2) cartographic visualization tools - Animation
- Exploration
-Hypermedia
3) Hardware/software devices - Keyboard
- Mouse
- CPU
- Digital camera
Cartographic visualisation tools vary according to the stage of scientific research , four stages of scientific research exist as follows;
Some exploratory acts are listed in the table below:
Table 2 : Exploratory acts of exploration
2.4.2 Multimedia
The involvement of multimedia in cartography to communicate ideas plays a very important part in map interactivity. Multimedia can be defined as “ the various combinations Hardware/software devices of text, graphics, animation, sound and video for the purpose of improving communication” (MP Peterson.1995 p127). Interactive multimedia now allow users to interact and select what information is available with the use of Hypermedia.
Multimedia map based product is a term introduced by S. Miller and says that cartographic information will benefit greatly in utilizing multimedia. And goes onto define multimedia as “ the merging of audio, video, still imagery, graphics, animation and text within a computerised environment to form an interactive, dynamic and randomly accessed whole” (Miller, S. 1995. pp30-31).
Multimedia authoring software introduces the technique of scripting and has added interactivity to presentation programs. Utilizing the integration of different media forms for communication
1) Exploration
2) Confirmation
3) Synthesis
4) Presentation
EXPLORATORY ACTS OF EXPLORATION
BLINK Attract attention to an object
HIGHLIGHT Attract attention to an object
ZOOM Zoom in for detail and out for overview
PAN Drag the image and change its position relative
to the screen
DRAG Moving an object
is a definition of an Authoring package and can be in the form of a Presentation Program , Card or Page based and Multimedia integration. It results in a sophisticated program, versatile file use formats is designed for interactivity. The scripting allows the user to choose the order in which information is viewed (MP Peterson.1995).
2.4.3 3D & Terrain Visualization
With the use of this form of visualisation a high level of realism can be achieved and bring to the user a different view of the map. The use of rotation, scaling, translation and zooming the act of exploration is greatly enhanced. The manipulation of the terrain model shown on the computer screen by the methods mentioned is important because of the nature of the viewing environment. The flat computer screen would not enable a clear view of some features because of elements i.e. a levee bank being in the way.
The digital terrain model (DTM) can be compiled from many data sources some of these are via land survey, photogrammetric techniques. A variety of professions utilise the information produced from terrain analysis i.e. Civil engineers in their design work for example. The data is generally processed into a DTM via 2 approaches as follows.
Table 3 : 2 Methods of DTM creation
DTM STYLES
DTM APPROACH DESCRIPTION
Triangular irregular network (TIN)
Using Delaney triangulation algorithm. Where triangles are created with the shortest lengths and angles between the 2 edges as large as possible.
Figure 2 : Example of a TIN from LISCAD’s Terrain Modelling package
The figure above shows some of the 420,000 triangles created during processing of a DTM at the BCSC Waurn Ponds site.
Within the GIS the DTM will be used to create a virtual 3D fly through animation of the mine environment.
In the case of the interactive tourist map within a working mine site that continues to alter the terrain surface from the natural surface before mining to the existing surfaces that are generated through the process of mining. What could be a better technique of terrain representation than a 3D view. In a mine you start with the natural surface: trees, grass, open paddocks then it is mined to the workable bed of limestone removing 10 metres of overburden to achieve this. Then all the limestone is removed to another 5 meters for example a constantly changing terrain. What an exciting prospect to present this data in map form utilising 3D terrain visualization incorporating animations, fly throughs and temporal mapping.
2.4.4 Animation
discovery and decision making. Animation allows the user to visualise the appearance of the area more effectively and can be utilised to show change over time, temporal animation. With the presentation of individual frames just like in a cartoon the illusion of movement can be created and it can be associated with quantitative change and distributions of classes and categories.
Two common forms of animation are;
1) Colour Cycling - Colour change in each segment simulates movement
2) Polymorphic tweening - The shape is altered over segments to imply change and movement
Animation is both 2 and 3 dimensional . With 3D animation, a 2D drawing is manipulated and a wire fame, which consists of polygons, is created as the object is rotated. With the use of lighting angle and rendering of the polygons a solid model is formed. To simulate animation the polygons can be altered by varying light angle shape and light intensity (F. Young & A. Apan, 2005).The following table lists animation variables;
Table 4 : Animation Variables.
ANIMATION VARIABLES DESCRIPTION
Size - change in size to show change in value
Shape - animation to blend the change in shape
Position - animation shows position change over time
Speed - animate the rate of change
Viewpoint - to focus attention on a particular feature
Distance - viewed as a change in scale
Scene - to use a transition technique (fade) to one subject to another
Texture, Pattern & Shading - use with a 3D object
2.5
Software
Software advances have driven the acceptance of spatial and cad computer packages to the point now where a map is rarely produced without utilising one of the many packages. The packages used in this project are briefly discussed below.
2.5.1 GIS
GIS is defined simply through the use of a spatial address the x, y and possibly z coordinate values or Geographic coordinates of latitude and longitude, which can be assigned to data, within a systems database. These values relate to a map projection of the earths surface telling users what is there (features and attributes), and where it is. Further data can be added to highlight trends, patterns, shortest routes. Spatial data separates GIS from an information system and incorporates the information system within it. Data base management is integral to both systems and enables functions like queries, problem solving and analysis.
In 1979 GIS was defined by Ken Dueker as “a special case of information system where the data base consists of observations on spatially distributed features, activities or events, which are definable in space as points, lines, or areas. A GIS manipulates data about these points, lines and areas to retrieve data for ad hoc queries and analyses” (Dueker, 1979, p106). Clarke describes a GIS as an “automated system for the capture, storage, retrieval, analysis and display of spatial data” (Clarke, 1995. p13).
With the vast array of data associated with the development of the map GIS as highlighted in Clarke’s description of a GIS it is the perfect tool to create the different forms of visualisation that will be needed to form that base of the interactive map compared with the traditional paper based maps
Table 5 : ArcGIS Desktop products
ArcGIS 9.2 Desktop
PRODUCT APPLICATIONS PURPOSE FUNCTIONS
Arc Reader Map Reader Entry Level product/ freeware
View Maps
Print Maps
Map interactivity
Arc View ArcMap
ArcCatalog
Extension modules
Common user interface with other products
Map Maker Query data
Analyse spatial relationships
Overlay layers
Arc Editor Arc View functionality Versioning, allowing multiple users to work simultaneously
Disconnected editing
Data creation
Editing tools
ArcInfo Arc Editor functionality
ArcInfo Workstation
Full set of spatial analysis tools
For this project the 3D analyst extension will be utilized to help create the 3D models necessary to for the visualization techniques for map representation incorporating another product of ArcGIS, ArcScene.
ArcScene is a 3D visualization application that allows you to view your GIS data in three dimensions and is similar to ArcMap.
2.5.2 Survey Software
Autodesk 2006 Civil 3D has been utilised to produce maps reflecting the surfaces surveyed for the volumetric surveys and presented to the client. 3D files have also been created for importation into ArcGIS for processing and map development.
2.5.3 Presentation Software
Microsoft’s presentation software PowerPoint has been used to present the interactive map associated with tourism to the user. It utilises a slide presentation pack capable of a non sequential format of presentation. It has a vast array of presentation techniques that include sound, animation and interactivity. It is data and user friendly in the typical windows fashion. It is widely accepted throughout the word and people are familiar with the basic concepts of presentation within.
Nero’s multimedia editing package will be utilised to finalise digital video presentations to be linked to the PowerPoint presentation creating an excellent source of information and interactivity.
2.6
Aerial Photography
As digital imagery is a major component of the interactive map it is important to provide adequate information about its origin. That is; how it is converted into a digital format, how users are presented with good coverage of their area of interest, and its location with real world coordinates. Issues associated with data file sizes and compression, and its relationship with GIS.
2.6.1 From the Plane to the Computer
The image must first be digitized to be used by the computer and this is done by scanning the aerial photo with a scanner to convert the visible features to digital files, this is termed as digital image processing.
A digital image is stored in the computer as an array of pixels, each pixel corresponds to an area on the earth’s surface and this array is known as a raster. The raster is arranged in horizontal and vertical lines the rows called lines and the columns known as samples. Pixels have a digital number (DN) assigned to them. This DN represents the intensity of light reflected in a defined electro magnetic spectrum wavelength for example visible or infrared wavelengths. This enables the transformation of the aerial photo, during the digital image processing and uses the DN’s to enhance the photo.
The aerial photos referred to in this study are of a natural colour and have 3 bands of data. Each of these bands or layers cover the same geographical area capturing the different wavelengths of light reflected from the earths surface. The wavelengths being red, green and blue.
The resolution of the image is affected by the scale at which the aerial photo was flown. This is determined by the altitude of the aircraft and the focal length of the camera at the time of photography and the Dots Per Inch (DPI) used to scan the photo.
Figure 3 : Example of a aerial photo
2.6.2 Mosaics
In order, to acquire suitable coverage of the area the aircraft will repeat its flight over the area a number of times taking photos that will overlap. A mosaic will be created of these photos to create one digitized aerial photo. This processing of air photo mosaic has a number of stages with the main objective to produce seamless imagery. By stitching the individual photos together and balancing the contrast between images, to minimize the visible seam lines. The final image will be cropped from this mosaic. The reason for this is to just cover the area in question and make map files more manageable by GIS for example.
2.6.3 Image Geocoding
A very important part of digital image process is image geocoding. Errors from the raw data need to be removed to enable distances and directional measurement as well as area computations.
Table 6 : The processes involved with image geocoding.
IMAGE GEOCODING PROCESSING
REGISTRATION Geometrically aligning photos to allow them to be overlaid
RECTIFICATION Correcting raster images to correspond with real world coordinates
ORTHORECTIFICATION Geometrically corrected image, with the scale being consistent in the image. This is done by taking into account the properties of the camera being used and the topography to produce an Orthophoto
2.6.4 Image Compression
The technique of data compression is very important. It reduces storage space requirements and also allows large image files to be transferred via portable recordable media such as compact disks (CDs) and via image web servers more conveniently. Image compression also determines the time taken to display the image due to decompression techniques. In the case of Joint Photographic Experts Group (JPEG) file format the image is viewed as the file is decompressed adding to the time taken to redraw the image. The cost of acquiring software to perform the required compression formats is also an issue. Loss of information is a critical issue and will be discussed in the following paragraphs
Compression procedures are defined by algorithms There are 2 forms of data compression as shown below;
Table 7 : Two Forms of data compression
2 FORMS OF DATA COMPRESSION
TYPE DESCRIPTION
Lossy - Data may be lost when decompressed causing a reduction in quality
- More suitable for images
- Reduces the colour space to common colours
- Transforms coding with wavelet compression technology enabling high - - compression rates
Lossless - Reconstructs data to original state
Compression ratios of data typically range from 50:1 to 20:1,. A colour image can be compressed to 2% of its original size. At a compression rate of 20:1 a 7GB image would be reduce to a file size of 350MB.
Two common forms of image compression file types are Tagged Image File Format (TIFF) and Joint Photographic Experts Group (JPEG). These are the two formats used in image presentation in this study. They are described as follows along with further examples:
Table 8 : Compression file types
COMPRESSION FILE TYPES
TYPE DESCRIPTION
TIFF - Employs both Lossless and lossy compression techniques
- Commonly accepted image file format that is flexible
- Uses tags with data assigned to it
-These tags and data define the image
JPEG - Widely accepted
- Lossy compression format
- Designed for photographic images
- Loss of quality in images due to compression format
FIF - Factual Image Format
- Allows fast decompression times
- Slow compression times
- Breaks geometric shapes down into smaller images of smaller file size with a format created to rebuild the image
LZW - creates coding for irregular data patterns that reoccur
- Low compression rates
- Lossless form of compression
Figure 4 : Raster data set properties taken from ArcMap
The figure above shows the uncompressed file size as 479.06MB, the compressed jpeg file size is 29MB approximately 6% of its original file size
2.6.5 Digitized aerial Photos and GIS
The resultant mosaics created by aerial photography and digitization are very large in size and are at very high resolution. The cell size in these raster images can be 1 metre or less. As mentioned previously cropping is a good form of file size reduction and along with file compression this allows images to be reduced for transportation and handling. Plug ins are available to view these compressed files that when decompressed are very large files, but could still be very difficult and slow to use. Increasing the cell size, also known as the spatial resolution, is another way to reduce file size and make it more compatible with GIS. In GIS the spatial resolution is also known as the Ground Sample Distance (GSD).
feature definition and 1m contour interval but may need to cover a large area, therefore an increase in the cell size would be a practicable trade off to achieve a smaller file size for the raster.
Table 9 : DEM resolutions requirements
DEM RESOLUTIONS REQUIREMENTS (guide only)
PHOTO SCALE ACCURACY REQUIRED CONTOURS INTERVAL ACHIEVED
1:10,000-1:15,000 1-2 metres 1-2 metre
1:20,000-1:30,000 2-5 metres 5metre
1:40,000 + 5+ metres 10 metre
2.7
Hardcopy vs Computer Display Maps
As discussed so far mapping has be revolutionised by the computer and presented the cartographer with new challenges of presentation. Visualization is well served by the dynamic arena of the digital computer maps displayed on the computer screen an the virtual map presented by the computer that has the ability to transform data and present it in a different perspective.
Conventional maps finalise the collection of information into a inflexible display when compared with the digital map. The presentation of data on a hard copy map entrenches the strict cartographic rules of scale, borders and marginalia information for presentation on a static flat viewing surface. With the virtual map that will never be printed onto the paper medium and therefore not limited to the fixed extents of the paper the presentation of data becomes a versatile medium that sometimes will disregard the tradition map production requirements. This is shown in the interactive map as views are taken from GIS and survey software displays and placed into the PowerPoint presentation for the sole purpose of diagrammatically presenting information to convey the visual message associated with the data.
2.8
Issues Associated with Animated Interactive
Maps
An issue that looms over the production of animated and interactive maps is wether all the effort is worth it. Has the message been received by the map user? Jiang states “cartographic representation involves the presentation of results”(B Jiang 1996 p8). Animation and interactivity if not used correctly could distract the user from vital information or the user blink and miss it all together.
In the table below Mark Harrower (2003) discusses four challenges associated with animation:
Table 10 : Four challenges associated with animation
Four Challenges Associated with Animation
Challenges Description
Disappearance - Animated maps change, ‘blink and you may miss it’.
Attention - With so many things happening where does the user focus their attention
Complexity - Information overload. The power of animation lies with the possibility of presenting a lot of information to every user, some users are to inexperienced to decipher the animation.
Confidence - Simple interfaces to allow all users confidence to interact with the display not abandon the map because of intimidation
2.9
Summary
Today we have access to large amounts of data, spatially referenced and with the help of efficient visualisation offered within a GIS we can step up to the challenge of the presentation of this data. The map users are the ones who in the end benefit from the technological advances in visualization and Map presentation as has been discussed in this chapter.
CHAPTER 3
3
RESEARCH METHODS
3.1
Introduction
This chapter is divided into two main sections, firstly an investigation into the site chosen for the interactive tourist map, being BCSC limestone quarry. This will cover how the mine is positioned in the area and the possible pressures that are placed on the mine by the mine’s surrounding environment. The mine is an industrial site on the urban fringe of a growing suburban landscape and can benefit from an informative well designed interactive map associated with tourism to provide users with a valuable insight into the mine. Also a brief explanation of the mining process is given to understand the concepts being examined for display within the map. The geological relevance of limestone will then be covered focussing on what limestone is and what it is used for in BCSC.
In the second section of this chapter, data sources and processing of this data for the map will be discussed and how it will be utilized in the interactive tourist map presentation. It will also highlight the importance that aerial photography has with an aerial image being the base photomap of the interactive map
.
3.2
The Site
Figure 5 : Sketch showing location of Waurn Ponds site
(Source: Australia 1:100 000 Topographic Survey – Geelong Victoria. Series R652 Sheet 7721 Edition 1-AAS)
3.2.1 The Location
Blue Circle holds freehold title to all of the quarry, future quarry and buffer lands. The lands comprise 23 separate land parcels with a total area of 1146.629 Ha. Blue Circle Southern occupies a total area of approximately 1173 Ha at the Waurn Ponds site. The extractive licence covers some 800 Ha of this land. While the area of extraction is ever changing as a result of the operations at the site, presently some 96 Ha of land lays open with approximately 10 Ha being active.
The location of the mine is a concern to residents with BCSC management placing a strong emphasis on the good will of the surrounding community. Urban pressure such as a new Ring Road, formally know as the Geelong Bypass, is under discussion at the moment with a proposed route through BCSC’s land.
area that the campaign targets. Ring Road planning is at a sensitive stage with routes close to being finalised and plans being restricted from public viewing.
Noise and air pollution are also problems associated with the mine site with BCSC conscious of its close proximity to urban environments and the need to monitor output levels. Drainage and effluent and ground water contamination present with recycling and purification methods being practiced.
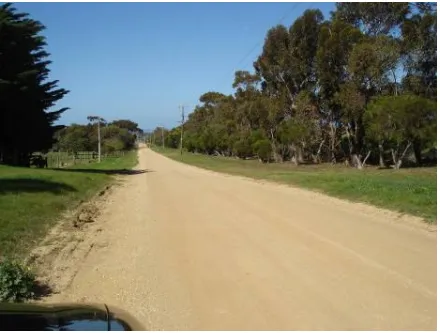
[image:36.595.86.526.254.587.2]The closest residential properties are located north of Hams Road and these consist of small rural residential sites. Six dwellings owned by BCSC are located on the land and all are currently leased out. The photograph below shows on the right a well treed barrier that restricts the view of residents of the mine site.
Figure 6 : A view along Hams rd looking east on the north of the site
The extraction areas generally have a buffer zone of approximately 40 metres. This is composed of an inner access road, an outer 3 metre high earthen bund wall and five meters (four of which is treed) between outer roads and the bund.
that unreasonable limitations are not placed on the extractive operations as a result of the proximity to residential areas. At present, the closest dwelling to an active working face (not including those on Blue Circle lands) is over a kilometre away.
A joint consultative committee (the CLC) was formed between company representatives and the local community to discuss any issues that may arise. The committee was formed in early 1999.There is no doubt that any information about the mine site would be valuable to any of the mentioned matters. With the efficient form of presentation of this interactive map the information contained in the map will be available for exploration to a cross section of users.
3.2.2 The Geological View
The predominant geological feature of the area is the Barrabool Sandstone, which contains the Waurn Ponds Formation. The Waurn Ponds Formation was formed during the Oligocene Epoch (25-34 million years ago) when marine deposition of limestone beds and marls (calcium rich clays) occurred. Following the regression of the Southern Ocean to the south-east during the Miocene Epoch (12-25 million years ago) basalt flows emanating from Mt Duneed, 3 km to the south east, were extruded onto the exposed limestone plain.
The Waurn Ponds Formation is often referred to as Waurn Ponds Limestone but is actually a complex layers of clay, ironstone and limestone overlain by beds of marl and calcareous clays. The lower seven to twelve metres of the Waurn Ponds Limestone has an average calcium carbonate content of 88% to 90% and is suitable for cement manufacturing. The marl above the high-grade limestone has a lower calcium carbonate content. A proportion of this marl can be blended with the high-grade limestone to produce a cement kiln raw feed with a calcium carbonate content of 78%.
Figure 7 : Fossils found in the quarry during a volumetric audit survey. These objects date back millions of years. The tooth displayed here measures 2.5 cm.
3.2.3 The Mining Process
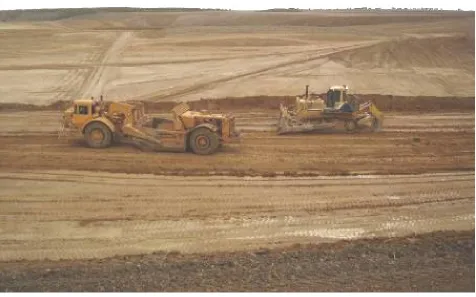
The quarry at the Waurn Ponds site has wealthy reserves of limestone with ongoing geological surveys plotting the future of the quarry. Large earthmoving machines known as scrapers collect limestone of different grades from the exposed limestone beds (workable bed) in the quarry.
Figure 8 : A Scraper and Bull Dozer travelling on overburden deposits
The overburden varies in depth and the economics of extracting the limestone come into play as the depth of the limestone increases. The overburden is used as backfill for regeneration of past mining sites.
The limestone is worked on two benches. The top bench is in the marl while the lower bench is in the high – grade limestone. Bull dozers rip the limestone beds to enable removal by scrapers The scraper enters its material collection area with its blade down and mouth to its storage bay open. The blade then directs the ripped limestone into the storage bay of the scraper for transportation to the crusher where the limestone is crushed and conveyed to the Factory by conveyor belt. Each scraper can carry 17m3 of material. In this form of extraction the scraper is not required to be filled by a loader, can access rough terrain, is self loading and constantly moving material to the factory or reclamation areas. This is an efficient technique as opposed to the shovel and truck method of extraction. By which large excavators load tip trucks with the material and then the material is transported by the tip trucks.
The overburden thickness averages 20 metres within a range of 4 metres to 24 metres from the natural surface. The overburden to limestone ratio ranges from 0.5:1 to 2.5:1, with an average of 2.3:1 cubic metres of overburden to one tonne of limestone. About 5,400,000 cubic metres of overburden has been moved in the five-year operation.
Overburden is normally removed up to 12 months prior to limestone mining. The overburden consists of clay, sand and poor quality limestone called marl. As the overburden is removed it is placed in the eastern end of the quarry void. The overburden is compacted to match the original land surface.
Since the volume of overburden is insufficient to backfill the whole area to original topographic levels, large water reservoirs or lakes are built at regular intervals behind the westerly advancing excavation front.
3.2.4 The Factory Process
The operation here currently outputs approximately 700,000 tonnes per annum of clinker, a nodular material that is ground up with gypsum to produce Portland cement. Here at the Waurn Ponds factory a dry process kiln method is used to produce clinker.
Briefly the dry process kiln method consists of meal consisting of the materials required, including limestone to produce the clinker. The quality of limestone taken from the mine has an important impact of the recipe of the meal, used in the tumbling kiln for clinker production. Many variables influencing the quality and characteristics of the cement to be used by customers.
The raw meal is fed into the kiln via the preheater tower, where the meal is heated and all moisture removed before entering the tumbling kiln. The meal is heated in the tumbling kiln to temperatures of 1400 C – 1500 C to produce clinker. Raw meal enters the tumbling kiln from the preheater which is tilted at a angle so the meal moves down the kiln towards its end as it is heated and rotated in the tumbling kiln. The end product of this process is clinker.
3.3
Data Capture and Acquisition
The data available for the interactive map will be discussed here. Digital photographs, Video, computer, hardware and software used will also be discussed.
3.3.1 Available data
Digital ortho photos will be utilised as photo maps as the major part of the proposed visualisation techniques for inclusion in the interactive map. There are three sets of aerial photos that have been supplied since 2001, from a Photomapping consultant commissioned by BCSC through to 2007. The images were supplied with varying levels of metadata as shown below.
Table 11 : Aerial images and associated data of the site
AERIAL PHOTOGRAPHY AND ASSOCIATED AUTOCAD DRAWINGS FROM PHOTOMAPPING CONSULTANT
DATE FILE TYPES META DATA SUPPLIED WITH IMAGERY
2001 BlueCircle.ecw i1111
BlueCircle.ers
Blue Circle.dxf
Ortho rectified image utilizing 1-10m contours 1 : 15000 scale, 0.35 pixel resolution
Header file
AutoCAD reference box for imagery AGD66
06.2005 Wau0605r.jpg
Wau0605r.dxf
Orthorectified image
AutoCAD reference box for imagery AGD66
07.2007 Orth-wauhl07.jpg
Orth-wauhl07.tif Wauhlo7.dwg Waun0707oc.jpg Waun0707oc.tif waun0707boc.dwg Waun0707.dwg
Ortho rectified image, Scale 1: 6000
Ortho rectified image, Scale 1: 6000
AutoCAD reference box for imagery GDA94
Ortho rectified image
Scale 1: 6000
Site specific (cropped)
Ortho rectified image
Scale 1: 6000
Site specific (cropped)
AutoCAD reference box for imagery georeferenced GDA94
Site specific (cropped)
3D Feature line work from Image file, AutoCAD file
Site specific (cropped)
3.3.2 Terrestrial Survey Data
Data will come from a decade long client relationship between Earth Tech Engineering (ET) and BCSC. ET carries out twice yearly audits of the material removed from the mine site and material remaining in the factory area. This material is classed as overburden destined for reclamation areas and limestone of various classes destined for the milling process in the factory.
Surveyors enter the mine and collect data to map the terrain within the working quarry. Associated digital terrain models are created to calculate the volumes of materials removed. A comparison of this survey and the last audit survey give a bulk figure of material removed. When compared to geological survey DTM’s the volumes of specific material removed and the amount of materials remaining can be calculated. The geology DTM’s comprise of the existing natural surface, top of limestone and bottom of limestone being the top of mudstone
The past methods of data collection include topographical surveys using manual and fully Robotic total stations and real time kinematic GPS. The GPS surveys have utilized a base station and 2 rovers to collect data, auto log has also been utilized. Auto log involves the placement of a GPS rover unit on a vehicle and the vehicle is driven over the terrain to be mapped recording measurements at a defined interval. Generally after 15 – 20 metres have been covered another reading is automatically recorded. Both GPS and total station data have been used from these audit surveys, for input into LISCAD, AutoCAD and ArcGIS for the production of displays for the interactive map
Figure 9 : GPS base station unit logging data looking south, across rehabilitation areas the quarry to the factory
Over the years of survey three different survey datum’s have been used, these datum’s are shown in the table below:
Table 12 : Survey datum’s of terrestrial surveys
SURVEY DATUM’S OF TERRESTRIAL SURVEYS
Local Grid – arbitrary datum Horizontal and vertical datum
AMG zone 55 – Based on AGD66 and AHD levels
MGA94 zone 55 – Based on GDA94 and AHD levels
Table 13 : Audit surveys available for use
QUARRY AUDIT SURVEYS 2002 – 2007
AVAILABLE FOR INCLUSION IN MAP
DATE OF SURVEY SURVEY DATUM ET REFERENCE
31.10.2002 Local 62130
01.05.2003 Local 7703074-70
31.10.2003 Local 7703531-70
20.04.2004 Local 7704241-70
29.10.2004 AMG66 7704655-70
28.04.2005 AMG66 7705218-70
31.10.2005 AMG66 7705572-70
01.05.2006 AMG66 7706164-70
31.11.2006 AMG66 7706427-70
30.04.2007 AMG66 7707157-70
3.3.3 The Here Solution by GPS
Data is generally collected via GPS on the mine site. Recently the map projections have changed at this site as with most sites since the introduction of the Geocentric Datum of Australia 1994 (GDA 94) from the Australia Geodetic Datum 1966 (AGD66)
With extensive existing data sets on AMG66 Zone 55 a transformation of the existing data sets to the new datum has been performed and has involved a GPS survey to establish the new Datum on site incorporating previously known marks in AMG66 Zone 55. This survey has been used to establish the transformation parameters to required survey accuracies and occupy new marks to extend the survey network of marks over the site for terrestrial surveys, by theodolite. As the site was about to be flown for aerial photography, photo control points were placed over the site and located by GPS during this survey.
(via the here solution) transformation parameters can be calculated to enable a shift from the approximate coordinates from the ‘here solution’ to the known MGA94 Zone 55 values supplied by the governments survey department . This enables the calculation of sub centimetre coordinates horizontally and two centimetre accuracy for the reduced level values for survey control marks and photo control point established during this survey and provides transformation parameters for AMG66 to MGA94.
3.3.4 Photographic material
Photographs and digital video will be incorporated into the interactive map. This material was compiled on site over 2006 – 2007 using a Sony Digital Camera with 3X zoom lens and 32MB. Internal memory card.
Photographs have been stored in JPEG compliant format and movies in MPEG1 compliant format. The material has been downloaded from the camera and stored on computer hard drive. The JPEG file size is approximately 2 MB with an image size of 2592 pixels * 1944 pixels recorded on a fine setting using a low compression ratio and the MPG1 files vary in size with the larger files being approximately 30MB and running for 20 – 30 seconds.
3.3.5 Computer Hardware and Software
A desk top computer was used to produce the Interactive Map associated with tourism its specifications are as follows:
Table 14 : Computer hardware used for project
HARDWARE BRAND SIZE / SPEED
PROCESSOR Intel Core 2 Duo 6400 @ 213GHZ
RAM 2.00GB
VIDEO CARD NVIDIA GEFORCE 6200 256 RAM
OPERATING SYSTEM Windows XP
Service Pack 2
PRINTER CANNON PIXMA IP5200
Table 15 : Computer software used for project
SOFTWARE PURPOSE OTHER
ArcGIS Version 9.2
- ArcCatalog
- ArcView
- ArcScene
Image management
File Management
TIN creation
3D displays
Animations
3D Analyst extension
Animation extension
Georeferencing extension
LISCAD version 8.01 File viewing
Data formatting
Data export
AutoCAD 2006 File viewing
File editing
Nero Multimedia centre Digital video enhancement
PowerPoint Interactive map presentation Slide presentation
Microsoft Paint Picture enhancement
Windows Media Player Digital Video viewer Version 9
3.4
Data Processing
This section will discuss the processes and steps involved with the major data sources for insertion into Power point to create the interactive Map associated with tourism.
3.4.1 Photo Maps
Aerial photography will be the base of the photo maps in the interactive map and the process involved in creating the digital images and related issues to be used will be covered here.
Table 16 : Some limitations of aerial photography
SOME LIMITATIONS OF AERIAL PHOTOGRAPHY IN THE INTERACTIVE MAP
Final File size to large
Are all the images needed (information overflow)
Limited time frame to process data – Time consuming to georeference all the images
The image that will be used to create the 3D visualization is Waun07070c.tif. The are a number reasons for this file and these are shown in the table below:
Table 17 : Aerial photography selection criteria
AERIAL PHOTOGRAPHY SELECTION CRITERIA
REASON DESCRIPTION
Site specific. - Cropped from the over all orthophoto. This will reduce file size and improve display times..
File Format - With the TIFF file format loss of quality will be negligible as discussed previously and good redraw times compared to the JPEG in ArcGIS, which has made it easier to handle.
With Aerial photos utilized in this study orthorectification by the photomapping consultant used ground control points (GCPs) and unlike images from satellites covering larger areas. Orthorectification does not generally correct images for the curvature of the earth.
Below is an image of one of the GCPs used. It must be noted that the images received from the Photomapping consultant in 2007 were not on a map projection but had been orthorectified. An insertion box on MGA 94 zone 55 map projection, was provided and is found in waun0707boc.dwg for which the image could be inserted and georeferenced in AutoCAD only. For the purpose of this study the GCPs mentioned here will have been used to geocode Waun0707oc.TIF because the insertion box does exist on the relevant map projection as mentioned. This is the reason that waun0707oc.TIF was georeferenced in ArcGIS.
Figure 10 : Image showing one of the Ground Control Points, placed on site before the aerial photography was flown
In a simplified explanation of this orthorectification process the position of each GCP is located visually in the digitized image and assigned its corresponding coordinate values as defined by the GPS survey. A DEM is created (in this case) using the level values assigned to these points as the terrain needs to be identified to eliminate distortion in the image.
The accuracy of the final product is determined at this stage. As mentioned surveyed measurements of GCPs were supplied to an accuracy of +/- 20mm allowing the contour output to be at 1 metre intervals or better and decimetre accuracy horizontally.
As vertical information was supplied with the image from the Photomapping consultant random checks have been performed on reliable areas, such as fence corners in open view, with acceptable results as shown in the 2 figures below. The first figure shows the reduced level (RL) obtained from an existing terrestrial survey at the fence corner highlighted in the red rectangle, to be 92.43. The second figure shows the RL determined from aerial photograph at approximately the same fence corner to be 92.48.
Figure 12 : Level data in Aerial Photo in LISCAD
The Blue Circle.ecw image flown in 2001 (Table 6) was based on a Digital Cadastral data base and contour interval interpolated data of 1-10 metres all containing assumed data not verified by accurate survey. The accuracy of the data input would be reflected by the deviations shown at the final stages of the transformation computation process.
<