University of Southern Queensland
Faculty of Engineering and Surveying
Analysis of Engine Performance using Palm Oil
Methyl Ester
A dissertation submitted by
Cheah, Siew Lee
in fulfilment of the requirements of
Courses ENG4111 and 4112 Research Project
towards the degree of
Bachelor of Engineering (Mechatronic)
ABSTRACT
University of Southern Queensland
Faculty of Engineering and Surveying
ENG4111 & ENG4112
Research Project
Limitations of Use
The Council of the University of Southern Queensland, its Faculty of Engineering and Surveying, and the staff of the University of Southern Queensland, do not accept any responsibility for the truth, accuracy or completeness of material contained within or associated with this dissertation.
Persons using all or any part of this material do so at their own risk, and not at the risk of the Council of the University of Southern Queensland, its Faculty of Engineering and Surveying or the staff of the University of Southern Queensland.
This dissertation reports an educational exercise and has no purpose or validity beyond this exercise. The sole purpose of the course pair entitled "Research Project" is to contribute to the overall education within the student’s chosen degree program. This document, the associated hardware, software, drawings, and other material set out in the associated appendices should not be used for any other purpose: if they are so used, it is entirely at the risk of the user.
Prof G Baker
Dean
Certification
I certify that ideas, designs and experimental work, results, analyses and conclusions set out in this dissertation are entirely my own effort, except where otherwise indicated and acknowledged.
I further certify that the work is original and has not been previously submitted for assessment in any other course or institution, except where specifically stated.
Cheah, Siew Lee
Student Number: 0050012463
__________________________
Signature
DEDICATION
ACKNOWLEDGEMENT
First of all, I would like to express my sincere appreciation and gratitude to my project supervisors, Dr. Sai-Cheong Fok and Dr. Talal F.Yusaf for their valuable advice, guidance and willingness to share their expertise. Throughout this long period, they had given me best supports, which help a lot on my completion of the project.
Secondly, I wish to send my appreciation to Dr. Nigel Hancock, my final year project’s examiner for his time to grade my thesis.
I would like to express my gratitude and sincere thanks to Mr. Chris Snook for allowing me to take this project. It has been part of my personal goal to get involve in a project that enables me to develop and analyze the performance of engine using palm oil methyl ester, a chance I never had previously.
I would like to mention the staff of Engineering Faculty, especially to Ms. Suhaila as she has given me hundreds of suggestions. Thanks to her.
I would also like to thank my friends and contacts in industry. Mr. Chew, a project engineer from GALVAN Automation Pte Ltd, has shared his views regarding the parameter on engine performance with me in hundreds of discussions. Mr. Adran from PETRONAS Sdn Bhd ,Mr. Vincent Chu, engineer from CSC Sdn. Bhd. and Mr. Edwin Chua, engineer from C.H Engineering who have shared their views regarding palm oil with me in hundreds of discussions.
They have discussed their field of expertise, allowing me to expand my horizons and keep on top of new developments.
Last but not least, I would like to thank all my friends, who have worked together with me, giving me moral support and ideas to complete my final year project .Without them, this project cannot be accomplished in a good manner and on time.
Regards,
CHEAH SIEW LEE
TABLE OF CONTENTS
Page
TITLE PAGE i
ABSTRACT ii
DISCLAMER iii
CERTIFICATION iv
DEDICATION v
ACKNOWLEDGEMENT vi
TABLE OF CONTENTS vii
LIST OF TABLES xiii
LIST OF FIGURES xiv
NOMENCLATURE xvi
ABBREVIATIONS xxi
CHAPTER 1 Introduction
1.1 Introduction 1
1.2 Present Work 2
1.2.1 Project and Background Objective 2
1.2.2 Project Methodology 2
CHAPTER 2 Literature Review
2.1 Introduction and Background of Palm Oil 6
2.1.1 Palm oil fuel research 8
2.1.2 Development of Biodiesel 9
2.1.3 Environmental ,Economic and Social consideration 10
2.2 Palm Oil Methyl Ester (POME) 12
2.2.1 POME as an additive to CDF 12
2.3 CFD on Nozzle 14
2.3.1 General consideration of Nozzle 14
CHAPTER 3
Chemical and Physical Properties of fuel
3.1 Introduction 17
3.2 Production of POME 17
3.3 Chemical Properties of POME 19
3.4 Physical Properties of POME and CDF 20
3.5 Emission Characteristic of POME 22
CHAPTER 4
Engine Performance
4.1 Introduction 25
4.2.1 Major Equations for Matlab Programme 26
4.2.1.1 Engine Performance Equation 26
4.2.1.2 Derivative of Pressure with respect to Crank Angle 29
4.2.1.3 Derivation of heat release rate 31
4.3 Engine Performance 34
4.3.1 Fuel’s Power Performance 34
4.4 Emission Gas 39
4.4.1 Carbon Monoxide 39
4.4.2 Oxygen 40
4.4.3 Nitrogen Oxides 40
4.4.4 Exhaust Gas Temperature 41
CHAPTER 5
Computational Fluid Dynamics (CFD)
5.1 Introduction 44
5.2 Application of CFD 46
5.3 Validation of CFD 46
5.4 Mesh Generation 47
5.5 Governing Equation 49
5.5.1 Continuity Equation 49
5.5.2 Momentum Equation 50
5.5.3 Energy Equation 50
5.6 Discretization Method 53
5.6.1 Upwinding 55
5.6.2 First Order Scheme 55
5.6.3 Sequential Discretization 55
5.5.4 Steady State Implicit 56
5.7 Phenomena Simulated 56
5.7.1 Turbulent flow 56
5.7.2 Incompressible 57
5.7.3 Inlet Boundaries 58
5.7.4 Outlet Boundaries 58
5.8 Computational Resources 58
5.9 Concluding Remarks 59
CHAPTER 6
Fuel Injector (Nozzle)
6.1 Fuel Injector System 61
6.1.1 Characteristic of fuel injector system 61
6.1.2 Main Function of Fuel Injection 62
6.2 Nozzle Design 64
6.2.1 Impact region extension 65
6.2.2 Cone angle 65
6.2.3 Flow Stabiliser and exit orifice 66
6.4 Types of Design 68
6.5 Theoretical Calculation 70
6.6 Concluding Remarks 75
CHAPTER 7
Result and Discussion
7.1 Introduction 76
7.2 Engine Performance 77
7.3 Derivative of Pressure and Heat Net with respect to Crank Angle 81
7.4 Effects on nozzle 85
7.4.1 Effect of length of nozzle over exit orifice diameter (L/D) 85
7.4.2 Effect of POME Pressure 86
7.4.3 Flow Analysis 87
CHAPTER 8
Conclusion and Recommendation 88
REFERENCES 91
BIBLOGRAPHY 94
APPENDIX A 108
APPENDIX B 111
APPENDIX C 113
APPENDIX E 126
LIST OF TABLES
Table
2.1 The performance of Malaysian Palm Oil Industry 2.2 Percentages Composition of Conventional Diesel Fuel 3.1 Component of POME
3.2 Typical compositions POME
3.3 Properties of Malaysian Diesel and Palm Oil Methyl Ester 3.4 Cetane numbers of POME, CDF and their blends
3.5 Content of emission from Elsbett engine using CDF and CPO 6.1 Various nozzle designs tested in 2-D
Page
LIST OF FIGURES
Figure
1.1 Project Methodology Flowchart 2.1 Nozzle geometry
3.1 Structure of triglycerides and principle of the transesterification reaction
3.2 Percentage reduction of exhaust emission using Palm oil 4.1 Fuel Consumption as a Function of Engine Speed
4.2 Break Specific Fuel Consumption as a Function of Engine Speed 4.3 Torque as a Function of Engine Speed
4.4 Break Power as a Function of Engine Speed 4.5 Efficiency as a Function of Engine Speed 4.6 Carbon Monoxide vs. Engine Speed 4.7 Oxygen vs. Engine Speed
4.8 Nitrogen Oxide vs. Engine Speed 4.9 Temperature vs. Engine Speed 5.1 CFD flowcharts
5.2 Method of Hanging Node Adaption 6.1 Fuel injection system
6.2 Schematic of nozzle internal geometry 6.3a Sharp edge with taper
6.6b Rounded edge
7.1 Fuel Consumption vs. Engine Speed
7.2 Specific Fuel Consumption vs. Engine Speed 7.3 Torque vs. Engine Speed
7.4 Break Power vs. Engine Speed 7.5 Efficiency vs, Engine Speed
7.6 Derivative of Pressure vs. Crank Angle 7.7 Derivative of Heat Net vs. Crank Angle
NOMENCLATURE
θ Crank angle
θb Burn duration in degrees crank angle θ1 Crank angle at reference
θs Crank angle for the start of combustion µ Viscosity
ρ Density (kg/m3) Φ Equivalence ratio ω Reference angle A Area of cylinder
bmep Brake mean effective pressure C Blowby constant
Div Diameter of the inlets valves F Actual Fuel to Air ratio f Residual mass fraction
fmep Frictional loss mean effective pressure Fs Stoichiometric Fuel to Air ratio
h Heat transfer coefficient H Chemical symbol for hydrogen
h Heat transfer coefficient of the burnt gas imep Indicated mean effective pressure
imepc Mean effective pressure associated with manifold losses Kp Constant used to demonstrate an expression
m Mass of gas
nc Number of cylinders
niv Number of inlet valves per cylinder P Pressure in the cylinder
pa Atmospheric pressure
pi,g Pressure in the inlet manifold Pm Motoring pressure
Pmax Maximum pressure in the cylinder Pr Reference pressure
•
Q Rate of heat transfer
b
•
Q Rate of heat transfer from the burnt gas
s
•
Q Rate of heat transfer through the surface of the cylinder
u
•
Q Rate of heat transfer from the unburnt gas
R1,2,3 Constants used in the calculation of the NO formed t Time
Ts Temperature of the cylinder surface Tw Temperature of the cylinder wall
u Velocity component due to piston motion and pressure in the cylinder u Specific internal energy
ub Specific internal energy of the burnt gas uu Specific internal energy of the unburnt gas U Total internal energy of the control volume V Volume of the gas in the cylinder
Vs Swept volume
vb Specific volume of the burnt gas vp mean piston speed
v1-14 Volumetric fraction of chemical elements x Mass fraction burnt
o
p Pressure, velocity, and area at section 1
T
T A
p , Pressure, velocity and area at section 2 (throat)
o
T Inlet temperature
D
real
m Mass flow rate of air
o
d Orifice diameter
n number of orifices
γ Pressure ratio
2
p Pressure at the tip of the gas inlet
f
ρ Density of POME
f
V Velocity of the POME
Df
C Discharge coefficient
a
m Mass flow rate of air (kg/s)
f
m Mass flow rate of fuel (kg/s)
a
v Air intake velocity, m/s
f
v POME intake velocity, m/s
a
l Diameter of air intake, m
f
l Diameter of POME intake, m n Number of holes
m Mass flow rate
uj jthCartesian of the instantaneous velocity
Fluid density Static pressure
µ
Fluid dynamic viscosityij
δ Kronecker deltas
ij
J Total diffusive mass flux for species ai
i
h Enthalpy for species ai
a
S Additional sources due to surface reaction, radiation, and liquid spray
j
q j component of the heat flux K Thermal conductivity
H Total enthalpy
k Von Karman's constant (= 0.419) E Empirical constant (= 9.81)
Dynamic viscosity of the fluid
y Distance from point to the wall
u Perturbation velocities about the mean velocities U v Perturbation velocities about the mean velocities V w Perturbation velocities about the mean velocities W k Dissipation rate of turbulent kinetic energy
D Turbulent kinetic energy
µ
C Constant, normally 0.09
L Inlet height or diameter
pq
m Mass transfer between primary phase q and secondary phase p
t
∂ ∂
Material time derivative
v
p The pressure of vaporization
q
ρ The density of the liquid
n The number of bubbles per unit volume
ψ Specific gravity
ip Input Power
,
net v
Q Lowe calorific value of fuel Torque
P Load
N Engine speed in RPM
bp Break Power A Area of Piston L Length of stroke n number of cylinders
sfc Specific fuel consumption BT Break thermal efficiency
bhp Break Horse Power
c H
∆ Heating of combustion
f
H° Net enthalpy change
f
h° Enthalpy formation
h
∆ Specific heat change
fuel
ABBREVIATIONS
A/F Air to Fuel Ratio
AFV Alternative Fuel vehicle BDC Bottom Dead Centre
BTX Xylene
C Carbon
CDF Conventional Diesel Fuel CFD Computational Fluid Dynamics
CO Carbon Monoxide
CO2 Carbon Dioxide CPO Crude Palm Oil
H Hydrogen
HC Hydrocarbon
kW Kilowatt NO Nitric Oxide NOx Nitrogen Oxide
N2 Nitrogen Gas
N Nitrogen
O Oxygen
PM Particulate matters POME Palm Oil Methyl Ester
S Sulphur
SO2 Sodium Oxides
CHAPTER 1
INTRODUCTION
1.1
INTRODUCTION
Gasoline and diesel are considered as conventional fuel. Alternative fuel (AF) vehicle can be considered as any vehicle using non conventional fuel. In Malaysia, the research into AF has been carried out by many organizations such as PORIM and PETRONAS. One of the main AF studied is Palm Oil Methyl Esters (POME). This is because Malaysia has a large quantity of palm oil.
substitute in a wide range of cabs, buses, and trucks. In these studies, it was found that POMES could affect the performances of the engines.
One of the factors that can affect engine performance using POMES involves the fuel injection system. The penetration of the POME spray into the compressed charge of air depends upon the following factors; the length of the nozzle orifice, the diameter of the orifice outlet, the nature of the fuel and the pressure of the fuel. To understand the engine performance, the modelling of nozzle in the fuel injection system is critical. In this project, Computational Fluid Dynamic (CFD) FLUENT software is used to investigate the flow behaviour of POME in the nozzle of fuel injector.
1.2 THE PRESENT WORK
1.2.1 Project background and Objectives
Fuel is injected into the combustion chamber of the engine through the nozzle of the fuel injection system. The penetration of the spray into the combustion chamber depends upon factors such as the length of the nozzle orifice, the diameter of the orifice outlet, the viscosity of the fuel and the pressure of the fuel. The design of the nozzle may ultimately affect the fuel flow behaviour and the engine performance.
flow behaviour. This will provide a clear picture of the swirl ratio and the degree of turbulence associated with POME. The associated heat and fuel performance will be calculated using a Matlab program. The result of the simulation study can be used to design better fuel injection system for the engine using POME as an AF.
1.2.2 Project Methodology
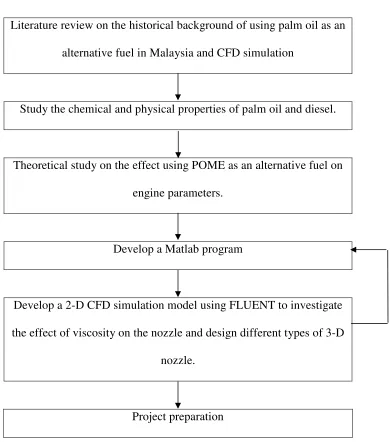
The first part concerns the familiarization with the material and organization. This involves literature reviews on the historical background of using palm oil as an alternative fuel in Malaysia and CFD simulation.
The second part of the study is to compare the chemical and physical properties of palm oil methyl ester and conventional diesel fuel. This is achieved through gathered data. The third part contains the theoretical study and calculation of fuel performance. The
Literature review on the historical background of using palm oil as an alternative fuel in Malaysia and CFD simulation
Study the chemical and physical properties of palm oil and diesel.
Theoretical study on the effect using POME as an alternative fuel on engine parameters.
Develop a Matlab program
Develop a 2-D CFD simulation model using FLUENT to investigate the effect of viscosity on the nozzle and design different types of 3-D
nozzle.
[image:26.612.128.518.82.524.2]Project preparation
1.2
OUTLINE OF THE REPORT
CHAPTER 2
LIRERATURE REVIEWS
2.1 INTRODUCTION
The oil palm, or Elaeis guineensis, originated in West Africa and was introduced to Malaysia in about 1870 as an ornamental plant. The current crop in Malaysia is a cross of the dura and pisifera varieties known as tenera, all belonging to the E. guineensis
species. By 1917, it was being cultivated on a commercial scale. Currently, palm oil tree production occurs on about three million hectares (Mha), which is well over one-third of Malaysia's total cultivated area (M.A Faud, A.R.Rohana & B.G. Chua 1997,p.125).
continue contributing significantly to the increase in the global oils and fats trade. In the meantime, the Malaysian palm oil statistics remain impressive.
Malaysia’s crude palm oil (CPO) production is forecasted to range between 13.5 million and 13.6 million tonnes in 2004, slightly above 2003 output of 13.4 million tonnes (The Star 28 July. 2004 , p.10). The production of crude palm oil (CPO) in 2003 increased by about 12.1%, from 1.4 million tonnes to 13.35 million tonnes compared with 11.91 million tonnes in 2002. Exports of palm oil have increased by 12.5% or 1.36 million tonnes to 12.25 million tonnes from 10.89 tonnes in 2002.
The increase was due to the expansion in matured planted area, weather conditions, constant sunshine, and rainfall distribution throughout the year.The fresh fruit bunches yield per hectare increased by 5.7% to 18.99 tonnes from 17.97 tonnes. However, the oil extraction rate fell by 0.8%.
Table 2.1 Performance of Malaysian Palm Oil Industry (MPOB 2003)
2002 2003 Diff (%)
Planting (Hectares)Area 3,670,243 3,790,636 3.3
Production (Tonnes) 11,909,298 13,354,769 12.1
Exports(Tonnes) 10,886,259 12,248,303 12.5
Closing stocks(Tonnes) 1,136,444 1,165,109 2.5
Imports(Tonnes) 402,507 460,633 14.4
Export Revenue (RM Million) 15,002.0 19,854.1 32.3
Total Revenue (RM Million) 19,644.5 26,148.0 33.1
Prices (RM/Tonne) 1,363.50 1,544.00 13.2
Oil Extraction Rate (%) 19.91 19.75 -0.8
Fresh Fruit Bunches Yields (Tonnes/Hectare) 17.97 18.99 5.7
2.1.1 Palm oil fuel research
Malaysia is trying to introduce palm oil as an alternative to diesel. This is because the country is the world leader in the production of palm oils. It is also the largest exporter of edible oils. Malaysia was the first, to use palm oil as fuel in vehicles in a field trial programme in 1983 .The results was promising and lead to more experimental work. Research on the use of palm oil as a diesel fuel alternative had been conducted at PORIM (the Palm Oil Research Institute of Malaysia), the University of Technology Malaysia (UTM), the University of Malaya (UM) , PROTON (National Automobile Industry of Malaysia) and Castrol Malaysia Sdn. Bhd.
carried out work on the thermal efficiency of palm oil and its product as a ignition fuel in engine. At the same time, an investigation was done on palm oil fuel at the National Chemical Laboratories for Industries; Japan.
There is cooperation between the University of Surrey and University of Technology Malaysia (UTM) to investigate the performance, emission, and carbon deposits in stationary diesel engines. Various studies on combustion parameters such as spray characteristics and the ignition delay of palm oil fuel has been carried out in the University of Leeds (S.M Sapuan , H.H. Masjuki & A.Azlan 1996,p.48).
2.1.2 Development of Biodiesel
Malaysia currently accounts for 51 % of world palm oil production and 62% of world exports, and therefore also for 8% and 22% of the worlds total production and exports of oils and fats. Malaysia produced approximately 12.4 million tonnes of palm oil in 2003 (The Malaysian Palm Oil Promotion Council (MPOPC) 2003).
2.1.3 Environmental, Economical, Social, and Political Considerations
It is envisaged that POME could be used as an energy source for transportation. This is one of the highest energy consumption sectors in Malaysia. Transportation is also a major contributor to air pollution. The major environment pollution from transportation systems is caused by the emission from the exhaust of diesel engine. The conventional diesel fuel used in the diesel engine contains a higher amount of particulate matters (PM) and harmful gases such as Nitric Oxide (NO), Nitrogen Oxide (NOx), Nitrogen Gas (N2), Sodium Oxides (SO2) etc. These gases are the main causes of greenhouse effect and acid rains. It is partly the resolute to reduce air pollution that has encouraged intensified search for alternative sources of energy that are both renewable and environment friendly.
POME has been identified as a potential source of energy that can substitute diesel. It has been tested in wide range of vehicles and the result was promising. POME has low sulphur content and almost biological decomposable. The combustion of POME leads to a near balanced CO2 cycle and a favourable reduction in greenhouse effects. It is due to these characteristics that PORIM has listed palm oil as an available and important alternative fuel. This is a truly benign fuel substitute especially for diesel engine.
Since the 1970s, Malaysia's economy has gone through a major transformation. From one based mainly on exporting palm oil, it has evolved into one of the most diversified
nineties, the unfavourable economics have inhibited development work of palm oil as diesel substitutes (Masjuki & Bharuddin 1993, p.108). There is the prediction that the cost of palm oil will decrease due to the current excess on the market. The future cost of producing palm oil for fuel within developing countries will depend on local factors such as land and the cost of labour (S.M Sapuan , H.H. Masjuki & A.Azlan 1996,p.51).
The cost of palm oil production could be offset by the profit if palm oil can make a marginal contribution as an alternative additive fuel. With the depletion of global fuel reserves, POME will contribute future wealth to the nation. Nevertheless, due to the current excess of palm oil in the market, there will be fluctuation of world market price. This makes it difficult to assess the economic viability and availability of palm oil compared to CDF (Schafer 1995,p.75).
Economic comparisons of palm oil and mineral oil are very difficult to make as it varies from country to country. Picken et al (1986) had outlined the factors that affect the cost, which include:
(a) Local cost of mineral oil and refining cost per litre; (b) Annual cost of a unit area of land for cultivation;
(c) Fuel used in cultivation and harvesting of land per unit area; (d) Fuel used as fertilizer on land per unit area;
(g) Transport and distribution costs per litre;
(h) Diesel oil equivalent of oil produced per unit area; (i) Taxation system;
(j) And value of residue after oil extraction per unit area
Besides economical consideration, one of the social advantages of using palm oil as a fuel in Malaysia is that the local community can largely control the fuel price and supply. In Malaysia, the supply of petroleum-based fuels depended mainly on external factors (Lowry et al 1990,p.97) and this could be undesirable. This is because the locals have the view that if the costs of palm oil and petroleum fuel are similar, they would prefer to spend the money within the community to promote local employment rather than on foreign imports (S.M Sapuan , H.H. Masjuki & A.Azlan 1996,p.51). Furthermore, urban air pollution has become a politically sensitive issue; substitution of POME for diesel fuel in the transportation sector can have a substantial impact on lowering smog-forming emissions.
The flow effects of the fuel in the injection system can influence the efficiency of POME in automobiles. The flow of POME through the fuel injector is important because of the effects on the spray and the atomization process can decisively affect the economical use of the fuel. In an effort to minimize fuel costs, increase reliability, and obtain
2.2 PALM OIL METHYL ESTER (POME)
2.2.1 POME as an additive to CDF
Malaysia produces about 13.6million tonnes of palm oil in 2004(The Star 28 July. 2004, p.10). This is one of the reasons why PORIM investigates the effects of POME on engines. The results of these studies indicated that the adoption of the emulsification approach between CDF and POME could produce viscosity and surface tension reduction, which yielded better combustion of fuel.
POME as CDF substitute is well acceptable as the two have similar characteristics. POME has advantages over CDF in several aspects, including environmental friendly, technically and economically feasibility. Table 2.2 gives the typical composition of CDF.
Table 2.2 Percentages Composition of Conventional Diesel Fuel (Heywood 1988,p.74)
Element Composition (%) Carbon ,C 83.0 – 87.0 Hydrogen, H 10.0 – 14.0 Nitrogen, N 0.1 – 2.0
2.3 CFD ON NOZZLE
A thorough understanding of the dynamics of flow is important in the future development of engine with high-performance. Modelling nozzle flow is complicated; this
investigation will use two-dimensional and three-dimensional models of nozzle flow to observe the effects of nozzle parameters.
The flow characteristics of the injected fuel at the nozzle are crucial. Viscosity of POME is the most significant of all liquid properties in the design because it can vary over an extreme range. Liquid viscosity resists surface formation. The nozzle may produce a mass of filaments if the viscosity is great enough; liquid viscosity is extremely sensitive to temperature and is a major effect on the spray characteristics.
The design and the flow characteristics will be analysed through CFD to predict the transfer of heat, chemical reaction, and fluid flow behaviour etc. CFD is based on the fundamental governing equations of fluid dynamics - the continuity, momentum and energy equation. It is a powerful tool to carry out numerical experiment. This project uses the Computational Fluid Dynamic software – FLUENT.
2.3.1 General Considerations of Nozzles
important for reducing emissions, although the nature of the connection between the injector and emissions appears to be quite complicated (Montgomery [1]).
The typical nozzle is roughly 0.2 mm diameter and the fluid is moving at several hundred meters per second making experimental measurements of the flow difficult. Studying real fuel injectors is also difficult because the nozzle geometry is often some variant of the plain orifice. This problem can be overcome with CFD by using a variety of geometries to make some practical observations. The results could further our understanding of fuel injector flow.
The penetration of the spray into the compressed charge of air depends on the following factors; the length of the nozzle orifice, the diameter of the orifice outlet, the nature of the fuel and the pressure of the fuel. The best atomizing results appear to be obtained by decreasing the ratio of the orifice length to its diameter (Arthur W.Judge 1967,p.1021). This means that the higher the pressure of fuel, the better will be the atomization effect. Other design aspects that have to be taken into account include the impact region
CHAPTER 3
CHEMICAL AND PHYSICAL PROPERTIES OF
PALM OIL METHYL ESTER AND DIESEL
3.1 INTRODUCTION
The properties of POME and CDF are very similar and POME is well acceptable as a CDF substitute. Furthermore, POME has advantages over CDF. This chapter summarizes the chemical compositions of palm oil.
3.2 PRODUCTION OF POME
esterification of fatty acids or transesterification of triglyceride. PORIM has developed a process that converts crude palm oil into methyl ester, which is used as a CDF substitute (Choo, Ma & Y. Barison 1995,p.3).
The processes consist of two steps: (a) esterification of the free fatty acids present in the oil into methyl ester, followed by (b) transesterification of neutral glycerides mixture into methyl ester without going through the washing stage. Figure 3.1 shows the
transesterification process. The esterification is carried out at 200°C -250°C under pressure (Choo, Ma & Y. Barison 1995,p.3). Methanols are used to deactivate lipase enzymes. Most crude palm oil are triglycerides (TGs; triglyceride = TG). Chemically, TGs are the triacylglyceryl esters of various fatty acids with glycerol (Ulf Schuchardt & Ricardo Serchelia 1997; Rogério Matheus Vargas 1997,p.199).
CH2OOR CH2OH | | CHOOR + 3 CH3OH3 CH3OOCR + CHOH | | CH2OOR CH2OH Triglyceride Methanol Methyl ester Glycerol
Figure 3.1 Structure of triglycerides and principle of the transesterification reaction
3.3
CHEMICAL PROPERTIES OF POME
The fatty acid composition of palm oil contains larger amounts of saturated fatty acid such as palmitic acid and small amount of myristic and stearic acid. It contains 40% of mono unsaturated oleic acid and 10 % of polyunsaturated acid. Table 3.1 shows the component of POME.
Table 3.1 Component of POME (S.M Sapuan, H.H Masjuki & A.Azlan 1997,p.47; Choo, Ma& Y. Barison 1995,p.16)
Component Chemical equation Percentage
Myristic Acid
C14:0 CH3(CH2)12CO2H 1
Palmitic Acid
C16:0 CH3(CH2)14CO2H 45
Saturated
Stearic Acid
C18:0 CH3(CH2)16CO2H 4
Mono
unsaturated Oleic Acid C18:1 CH3(CH2)7CH=CH(CH2)7CO2H 40 Poly unsaturated Linoleic Acid ( 6) C18:2 CH3(CH2)4=CHCH2CH=CH(CH2)7CH
CO2H 10
Table 3.2 Typical compositions POME (Schäfer 1995,p.202)
Element Composition
(%by mass) Formula Molecular Weight (g/mole)
Carbon, C 76.3 18.0 283.7
Hydrogen, H 12.4 34.9 283.7
Oxygen, O 11.3 2 283.7
3.4
PHYSICAL PROPERTIES OF POME AND CDF
POME has similar properties to those of petroleum diesel (Table 3.3). It has a higher cetane number than diesel fuel (Table 3.4) and is commonly used in direct injection diesel engines without modifications (Ma 1993,p.3). The viscosity of the fluid changes with temperatures – increasing as temperature is decreased, and decreasing as the
temperature is increased. At normal atmospheric condition, the viscosity of POME is ten times higher than that CDF.
The cetane number of POME is 50. The cetane index 50 for palm oil fuel is slightly lower than that of 53 for CDF. Ma et al used POME blended with diesel fuel in an automobile diesel engine and compared its performance and emission with diesel fuel .It was found that the cetane rating was higher for POME compare to diesel oil (Table 3.4)
Table 3.3 Properties of Malaysian Diesel and Palm Oil Methyl Ester (H. Masjuki & Baharuddin 1993,p.35)
Property Conventional Diesel Fuel
(CDF) Palm Oil Methyl Ester (POME) Specific gravity
ASTM D 1298 (°F) 0.8330 at 60.0 ° 0.8700 at 74.5 ° Sulphur content
(% Wt) IP 242 0.10 0.04
Viscosity at 40 °C (cST)
ASTM D445 4.0 4.5
Pour Point (°C)
ASTM D 97 15.0 ° 16.0 °
Distillation D 86 (°C) I.B.P. 10% 20% 50% 90% F.B.P. 228.0 258.0 270.0 298.0 376.0 400.0 324.0 330.0 331.0 334.0 343.0 363.0
Final recovery (%) - 98.0
Cetane Index ASTM D 976 53 50
Gross heat of combustion
(KJ/kg) ASTM D 2382 45800 40135
Flash Point (°C) ASTM D
93 98 174
Conradson carbon residue
(% Wt.) ASTM D 189 0.14 0.02
Table3.4 Cetane numbers of POME, CDF and their blends (H. Masjuki & Baharuddin 1993,p.11)
Blends
Palm Oil Methyl Ester (%) Diesel (%) Cetane number ASTM D 613 100 0 5 10 15 20 30 40 50 70 0 100 95 90 85 80 70 60 50 30 62.4 37.7 39.2 40.3 42.3 44.3 47.4 50.0 52.0 57.1
3.5
EMISSION CHARACTERISTIC OF POME
In Malaysia, the exhaust gases from vehicles using fossils fuel contain various kind of harmful pollutant such as carbon monoxide (CO), carbon dioxide (CO2), hydrocarbon (HC) , sulfur dioxide (SO2), aromatic hydrocarbon and smoke particulate. The use of fossils fuel such as benzene, toluene, ethyl benzene and xylene (BTX) affects human health (Hitam,T.S.Tang & Y. Barison 1998,p.1). If this issue is not addressed, it will destroy our environment and life.
smoke, exhaust odours and provides less engine wear problem. POME can also work as a substitute to reduce sulphur emission and aromatic. Vegetable oil is also oxygenated so there is no eye irritation. In addition, diesel can have more complete combustion with vegetable oil than any other fossil fuel. The combination can be handled as diesel oil due to high flash point (H.S. Sii, H. Masjuki & A.M. Zaki 1995,p.906)
A study by T.S Tang, Ahmad Hitam and Yusof Barison from PORIM using Elsbett engine showed that a engine can undergone a long term trial using POME. The exhaust emissions result from tests showed that there is reduction of emission when diesel was substituted with palm oil (T.S.Tang,Hj.Ahmad Hitam & Y. Barison 1995,p.4). It was found that the contents of hydrocarbon, carbon monoxide, carbon dioxide, particulate, and nitrogen oxide of the exhaust from diesel fuel were 0.13, 0.82, 1.47, 0.14, 1.12 g/km respectively. Whereas, those from palm oil fuel were 0.09, 1.48, 0.04, and 1.04 g/km respectively. Comparing this two sets data, using palm oil as fuel seemed to reduce the hydrocarbon, particulate, and nitrogen oxide. The results are summarized in Table 3.5 and Figure 3.2.
Table 3.5 Content of emission from Elsbett engine using CDF and CPO (T.S.Tang, Hj.Ahmad Hitam & Y. Barison 1995,p.13)
Emissions (g/km) CDF CPO Deviation (%)
Hydrocarbon (HC) 0.13 0.09 -29.70
Carbon Monoxide(CO) 0.82 0.84 2.45
Carbon Dioxide (CO2) 1.47 1.48 1.2
Particulate 0.14 0.04 -47.20
Figure 3.2 Percentage reductionof Exhaust Emission using Palm Oil (T.S.Tang,1995)
-29.7
2.45 1.2
-47.2
-7.59
-50 -40 -30 -20 -10 0 10
HC CO CO2 Particulate Nox
Exhaust Emission
%
R
ed
uc
tio
n
Deviation (%)
CHAPTER 4
ENGINE PERFORMANCE
4.1 INTRODUCTION
4.2 THEORETICAL CALCULATION AND MATLAB
The mass flow rate, torque, input power, brake power, brake mean effective pressure, specific fuel consumption, break thermal efficiency and the relationship between pressure and time will be investigated. From theoretical calculations, the graphs of mass flow rate versus engine speed, specific fuel consumption versus engine speed, torque versus engine speed, break thermal efficiency versus engine speed and pressure versus time are
obtained.
4.2.1 Major equations used for Matlab Programme 4.2.1.1 Engine Performance Equations
Engine torque is measured by the dynamometer. The engine is clamped on a test bed and the shaft is connected to the dynamometer rotor. The torque can be found as follow:
P
τ ω
= or 60
2
P N
τ π
= (4.1.1)
Where:
P = Power (kW)
N = Angular Speed (rev/s)
τ
= Torque (Nm)Input power is given by the
,
,
,
Where:
InputPower( )
is the lower calorific value of the fuel.
For CDF , 45000 / ,
POME, 41300 / ,
net v
net CFD
net POME
ip kW
Q
Q kJ kg
Q kJ kg
=
=
=
The mass flow rate is calculated by multiplying the volumetric flow rate with density of the fuel
x 1 x 10 x 3 x
water V
m
t ρ ψ
−
= (4.1.3)
Where:
m = Mass Flow Rate of Fuel (kg/s)
V = Volume Flow Rate of Fuel (cm3/s)
water
ρ = Density of Water (kg/cm3)
ψ = Specific gravity (kg/cm3)
0.833 kg/cm3 and 0.899 kg/cm3 for CFD and POME respectively
3 2 60 x 10
N
bp= π τ (4.1.4)
2bp bmep
ALNn
= (4.1.5)
Where:
bp = Break Power (kW)
bmep = Mean Effective Pressure (kPa) n = number of cylinder
A = Area of engine bore (m2)
L = Length of stroke (m)
The break fuel consumption is measured as a flow rate:
m bsfc
bp
= (4.1.6)
With break power and input power, the efficiency of the engine can be calculated using
x100%
BT bp
ip
η = (4.1.7)
4.2.1.2 Derivative of Pressure with respect to Crank Angle
In an engine, the crank angle θ changes with time. The relationship between pressure
and time will be investigated as the crank angle changes. The graph of dPvs.
dθ θ is
obtainable by solving the following equations:
(
)
1
180
in
in g w
P
dP k Q df hA T T k dV
d V d w V d
π
θ θ θ
−
= − − − (4.1.8)
2 2 1/ 2 sin 1 cos ( sin ) 2
d V
dV R
dθ = θ + θ − θ − (4.1.9)
2 2 1/ 2 1 cos ( sin ) 1 2
d d
V V
V R R
r θ
= + + − − −
− (4.2.0)
( ) 1 n a D f e θ θ θ − ° −
= − (4.2.1)
(
)
(
)
11 f na n
df d
θ θ
θ
θ
θ
−
− − °
=
∆ ∆ (4.2.3)
(
)
2 1/ 2
2 2
1 cos sin
2 2
B BS
From the characteristics of the pressure versus time graph, the maximum pressure can be
obtained. Different types of graph dPvs.
d
θ
θ
are produced at different compression ratio.It is assumed that the cylinder content behaves as an ideal gas. The mean cylinder gas temperature is obtained using the following expression:
(
1)
d in gr V P VMRu T
r
ρ
−
= (4.2.5)
The specific gas constant R is calculated from the mean gas composition estimated from the initially trapped mass and the amount of fuel burned at the current crank angle.
Qin =PV1 d (4.2.6)
The Nusselt number, defined as:
b hB
Nu K
B x
ρ
Spµ
=
=
(4.2.7)
4.2.1.3 Derivation of heat release rate
The net heat release rate is determined by applying the first law of thermodynamic.
dQnet C PdV V dP PV dm PdV
d
θ
= r dθ
+ dθ
− m dθ
+ dθ
(4.2.8)
w Re
(
)
(
4 4)
c w g w g
dQ K
A a T T r T T
d
θ
= B − + − (4.2.9)The Reynolds number, defined as
Re 4 g
m B
πµ
= (4.2.10)
The gross heat release rate, provides the actual rate of energy release, is then obtained by,
dQgross dQnet dQw
d
θ
= dθ
− dθ
(4.2.11)Where the heat loss rate dQw
dθ (negative from gas to walls) is obtained from Eq. (4.2.12)
using the heat transfer model of Annand [12].
w ( Re (b ) ( 4 4)
c w g r w g
dQ
A a T T c T T
( ) C w m e θ π − +
= (4.2.13)
dm Cm
d
θ
w−
= (4.2.14)
Where:
h = heat transfer coefficient
K = Thermal conductivity = 0.15 W/m.K
x = varies from 0.35 to 0.8 for normal combustion = 0.6
Sp = mean piston speed = 2Sw
= Dynamic viscosity = 7x10⁵ kg/ms
w = speed of the piston
P1 = Atmospheric pressure Qin = Overall heat input (J/rev)
k = p
v C
C = 1.4 (air)
R = 1
c
R l is connecting rod
Vd =
2 4
B S
π
B is bore S is stroke
Vd is swept volume
R = d c
c
V V
V
+
, Vc is clearance volume
ƒ = fraction of heat added = Crank angle
o = Angle of the start of the heat addition
∆
= Burn durationa = 5
b =0.7
n = 3
A = surface area of the cylinder
Tg = average gas temperature
M = Molar mass of the fuel per air mixture
Ru = universal gas constant
= Density of the fuel per air mixture
C =0.8 /s (constant)
4.3 ENGINE PERFORMANCE 4.3.1 Fuel’s Power Performance
The engine specification were used according to a stationary Perkins diesel engine model 4-108V. The direct injection has the following specifications: 4 strokes, 4 cylinders, bore 79.5mm, stroke 88.9mm, compression ratio 22, and 32 kW rated power output at 4000 rpm.
The performance of POME and CDF are compared at a fixed throttle opening within the speed range from 1000 to 3000 rpm .The results obtained show two distinct trends when speed is below or above 2000 rpm. The results under standard operation condition with CDF and POME are shown in Table C.1 and Table C.2 respectively in Appendix C.
Specific fuel consumption is one of the best indicators of engine performance in terms of efficiency. Theoretically specific fuel consumption is initially high due to the pumping work, increase magnitude of friction and increase relative heat transfer which reduce the fuel conversion efficiency (Heywood 1989,p.125).
consumption of POME-CDF mixtures was higher than CDF and increased as mixture increase.
This result is comparable with the results by Talal et al, 1999 and Masjuki et al, 1998 where the rate of fuel delivery to engine speed was affected by specific gravity and viscosity of fuel. In general, emulsions of POME and CDF have similar characteristics.
Figure 4.2 shows the brake fuel consumption (BSFC) of POME compare to CDF. At low speed, BSFC of POME is greater than CDF. As the speed increases, the BSFC of POME becomes lower compare to CDF at 2200 to 2500 rpm. However, BFSC increased for both fuel at high speed. This indicates good combustion of POME at the high-speed range.
The engine torque versus speed for POME and CDF are shown in Figure 4.3. The torque reaches maximum for both fuels within the range speed of 1800 to 2000 rpm. However, the torque produced by POME is higher compare to CDF in general. The torque produced by POME-CDF was higher when the percentage of POME increased. Torque reduced as the speed increase for both fuels.
higher when POME-CDF was increased. According to Talal F. Yusaf et al, 1999, the POME-CDF mixtures could produce higher power than CDF .This is due to the lower calorific value. This result also matches with the result by Masjuki et al, 1998.
Figure 4.5 shows the efficiency in percentage vs. speed. The result for POME shows that the efficiency is not constant and fluctuates between the speeds of 2000 to 2800 rpm. The POME efficiency is greater than CDF within this range. For CDF, it is at the transient state and start to drop when the speed is beyond 2000 rpm. The efficiencies for POME-CDF are comparable with POME-CDF. These results agreed with those from Masjuki et al, 1998 where they found the brake power reduces as the engine speed increases and this affect the low efficiency.
Figure 4.1 Fuel Consumption as a Function ofEngine Speed (Talal F. Yusaf et. al, 1999)
0.000 1.000 2.000 3.000 4.000 5.000 6.000 7.000 8.000 9.000
1000 1200 1400 1600 1800 2000 2200 2400 2600 2800 3000
ENGINE SPEED (RPM)
Fu el C on su m pt io n( lit re /h r) 100% CPO 75% CPO+25% CDF 50% CPO+50% CDF 25% CPO+78% CDF 100 % CPO
Figure 4.2 Break Specific Fuel Consumption as a Function ofEngine Speed (Talal F. Yusaf et. al, 1999) 0.0000 0.2000 0.4000 0.6000 0.8000 1.0000 1.2000 1.4000
1000 1200 1400 1600 1800 2000 2200 2400 2600 2800 3000
ENGINE SPEED (RPM)
B SF C (k g/ kW
h) 100% CPO
75% CPO+25% CDF 50% CPO+50% CDF 25% CPO+78% CDF 100 % CPO
Figure 4.3 Torque as a Function ofEngine Speed (Talal F. Yusaf et. al, 1999)
0.0 20.0 40.0 60.0 80.0 100.0 120.0
1000 1200 1400 1600 1800 2000 2200 2400 2600 2800 3000
ENGINE SPEED (RPM)
T or qu e( N m
) 100% CPO75% CPO+25% CDF
50% CPO+50% CDF 25% CPO+78% CDF 100 % CPO
Figure 4.2 Brake Specific Fuel Consumption as a Function of Engine Speed (Talal F. Yusaf et.al, 1999)
Figure 4.2 Brake Specific Fuel Consumption as a Function of Engine Speed (Talal F. Yusaf et. al, 1999)
Figure 4.4 Break Power as a Function of Engine Speed (Talal F. Yusaf et. al, 1999) 0.000 5.000 10.000 15.000 20.000 25.000
1000 1200 1400 1600 1800 2000 2200 2400 2600 2800 3000
ENGINE SPEED (RPM)
B re ak P ow er (k W
) 100% CPO
75% CPO+25% CDF 50% CPO+50% CDF 25% CPO+78% CDF 100 % CPO
Figure 4.5 Efficiency as a Function of Engine Speed (Talal F. Yusaf et. al, 1999)
0.0000 0.0500 0.1000 0.1500 0.2000 0.2500 0.3000 0.3500 0.4000
1000 1200 1400 1600 1800 2000 2200 2400 2600 2800 3000
ENGINE SPEED (RPM)
E ffi ci en cy (%
) 100% CPO
75% CPO+25% CDF 50% CPO+50% CDF 25% CPO+78% CDF 100 % CPO
Figure 4.Brake Power as a Function of Engine Speed (Talal F. Yusaf et. al, 1999)
4.4 EMMISION GAS
Major environmental pollution from transportation systems is caused by the emission from the exhaust of diesel engine. The CDF used in the diesel engine contains higher amount of particulate matters (PM) and harmful gases such as nitrogen oxide (NOx), carbon monoxide (CO) etc. These causes damage to the environment.
POME has been used for research over the past few years in a wide range of engines. The exhaust gas was found to be much cleaner. It contained comparable nitrogen oxide (NOx) but less carbon monoxide. The emission effects were studied by El-Awad et al (1999). The engine was running within the range of 1000 to 3000 rpm with three crude palm oil (CPO) mixtures containing 25%, 50% and 75% of CPO by volume. The engine also ran with 100% CPO and CDF for comparison. The data obtained are given in Table C.3 to C.7 Appendix C.
4.4.1 Carbon Monoxide
CPO, which helps to achieve better combustion. These results show that CPO is more environmentally friendly in all sense.
4.4.2 Oxygen
Air-fuel mixing cannot be perfect even though the combustion is complete. There is always the possibility of some O2 appearing in the exhaust gas. Figure 4.7 shows the percentage of O2 in the exhaust under different engine speeds. For all fuels, the percentage of O2 passes through its minimum value within the speed range of 1800 to 2000 rpm. This minimum value indicates that the air fuel ratio is closest to the
stoichiometric value (H.S. Sii, H. Masjuki & A.M. Zaki 1995,p.906). At low speed, all CPO-CDF mixtures showed lower O2 percentage in the exhaust compared to 100% CDF. These results show that the higher the concentration of CPO in the mixture, the lower is the percentage of CO2 in the exhaust. A good combustion of the 25% and 50% CPO-CDF mixtures in the high-speed range has made up for the low fuel consumption so that the fuel’s brake power was comparable to CDF. There lowered the O2 content in the exhaust for 75% CPO-CDF to CDF for all engine speeds (Talal F. Yusaf &El-Awad, 1999,p.4).
4.4.3 Nitrogen Oxides
higher level of NOx emissions. The emissions could probably be due to higher temperature and an extended delay period (Talal F. Yusaf & El-Awad 1999,p.4).
4.4.4 Exhaust gas Temperature
A high exhaust gas temperature can be taken as the combustion temperature. The gas analyser measures the difference (T*) between the temperature of the exhaust gas (Tg)
and the ambient atmospheric temperature (Ta) i.e. T*= (Tg-Ta). From the experimentation
results, Figure 4.9 shows that T*, the temperature for 100% CDF and all CPO-CDF mixtures reached their peak values at engine speeds lower than 1800 rpm. The 50% CPO mixture produced higher exhaust gas temperatures compared to 100% CDF at low engine speed. The 75% CPO-CDF mixture produced higher exhaust gas temperatures compare to CDF for all engine speeds. The exhaust gas temperature of 25% CPO mixture was comparable to CDF in the low speed range. (Refer Figure 4.9)
Figure 4.6 Carbon Monoxide vs. Engine Speed (Talal F. Yusaf et. al, 1999)
0.0 1000.0 2000.0 3000.0 4000.0 5000.0 6000.0 7000.0 8000.0
1000 1200 1400 1600 1800 2000 2200 2400 2600 2800 3000
ENGINE SPEED (RPM)
C O (P PM ) 100% CPO 75% CPO+25% CDF 50% CPO+50% CDF 25% CPO+78% CDF 100 % CPO
Figure 4.7 Oxygen vs. Engine Speed (Talal F. Yusaf et. al, 1999) 0.0 2.0 4.0 6.0 8.0 10.0 12.0 14.0 16.0 18.0
1000 1200 1400 1600 1800 2000 2200 2400 2600 2800 3000
ENGINE SPEED (RPM)
O
2
(%
)
100% CPO 75% CPO+25% CDF 50% CPO+50% CDF 25% CPO+78% CDF 100 % CPO
Figure 4.8 Nitrogen Oxide vs. Engine Speed (Talal F. Yusaf et. al, 1999)
0.0 50.0 100.0 150.0 200.0 250.0 300.0 350.0
1000 1200 1400 1600 1800 2000 2200 2400 2600 2800 3000
ENGINE SPEED (RPM)
N O x (P PM ) 100% CPO 75% CPO+25% CDF 50% CPO+50% CDF 25% CPO+78% CDF 100 % CPO
Figure 4.7 Oxygen vs.Engine Speed (Talal F. Yusaf et. al, 1999)
Figure 4.9 Temperature T* vs. Engine Speed (Talal F. Yusaf et. al, 1999) 0.0 50.0 100.0 150.0 200.0 250.0 300.0 350.0 400.0 450.0
1000 1200 1400 1600 1800 2000 2200 2400 2600 2800 3000
ENGINE SPEED (RPM)
T em pe ra tu re T * (° C
) 100% CPO
75% CPO+25% CDF 50% CPO+50% CDF 25% CPO+78% CDF 100 % CPO
CHAPTER 5
COMPUTATIONAL FLUID DYNAMICS
5.1 INTRODUCTION
CFD is a sophisticated analysis technique that enables the analyst to predict transfer of heat, chemical reaction, and fluid flow behaviour etc. CFD is based on the fundamental governing equations of fluid dynamics - the continuity, momentum and energy equation. It is a powerful tool to carry out numerical experiments. This project uses the
Computational Fluid Dynamic – FLUENT software package.
alternative of creating grids for FLUENT is using ANSYS (Swanson Analysis Systems, Inc.) or I-DEAS (SDRC); or MSC/ARIES, MSC/PATRAN or MSC/NASTRAN (all from MacNeal-Schwendler Corporation). PreBFC and GeoMesh are the names of FLUENT pre-processors that were used before the introduction of GAMBIT.
Once a grid has been read into FLUENT, all remaining operations are performed within the solver. These include setting the boundary conditions, defining fluid properties, and material properties, executing the solution, refining the grid, viewing and post-processing the results. The procedure using FLUENT can be summarized as in Figure 5.1;
Figure 5.1 CFD flowcharts prePDF
• Calculation of PDF look-up
GAMBIT
• Geometry setup
• 2D/3D mesh generation
FLUENT
• Mesh import and adaptation • Physical models
• Boundary conditions • Material properties • Calculation
• Post-processing
Other CAD/CAE packages
TGrid
• 2D triangular mesh • 3D tetrahedral mesh • 2D or 3D hybrid mesh Geometry or
mesh
Boundary and/or volume mesh 2D or 3D
5.2 APPLICATION OF CFD
CFD is a useful tool in performing theoretical experimentation. It solves all problems concerning fluid flows such as incompressible and compressible flow, Newtonian or non-Newtonian flow, swirl, transfer of heat, in viscid, laminar and turbulent flow, radiation, mixing, chemical reaction, spray models etc.
CFD can be applied to solve industrial flow problems due to rapid growth of powerful computer resources and the development of CFD software packages. In engineering applications, it is much cheaper to use CFD than conventional design process. In CFD simulation, we can simulate different set of parameters for the same design without any additional cost. This reduces the time and cost of experimental work.
5.3 VALIDATION OF CFD
Validation of a code is important in assessing its usefulness before applying to a practical application. This could involve comparison of present computational data with other published experimental or computational data. The simplest situation is considered for validation before the work is extrapolated to the more complex phenomena.
5.4 MESH GENERATION
The local flow characteristics of high speed liquids are not necessarily parallel to the flow of direction. Therefore, it is pertinent to use unstructured triangular grids. The
commercial mesh generation package GAMBIT is used. GAMBIT uses the Delaunay triangulation automatic mesh generation technique, with an advancing front method. All the meshes are axi-symmetric in two and three-dimensions. The advantages of Delaunay triangulation are that no point is contained in the circum-circle of any triangle and it maximises the minimum angle for all triangular elements, which is a requirement for good quality finite elements, i.e. the mesh has a low skewness.
The mesh is generated by applying points along the boundaries of geometry with certain stretching function. The geometry is made of edges and faces. It was found that
geometries, which had interiors that were made of multiple faces, performed better in calculation. This was due to the increase in versatility of the stretching function that minimised a large cell volume jumps within the domain.
Figure 5.2 Method of Hanging Node Adaptation
The adaptation function is used under the assumption that the greatest error occurs in high-gradient regions. The equi-distribution adaptation technique used multiplies the undivided Laplacian of the solution variable by a characteristics length scale. The length scale is the square root of the cell volume. The introduction of this length scale permits resolution of both strong and weak disturbances, increasing the potential for more accurate solutions. The gradient function has the following form:
(
)
2r 2i cell
e = A ∇ f (5.4.1)
Where ei is the error indicator, Acellis the cell area, r is the gradient volume weight and
2f
5.5 GOVERNING EQUATION
In the CFD methodology, fluid flows are stimulated by numerical solving partial differential equations that govern the transport of flow quantities also known as flow variables. These variables include mass, momentum, energy, turbulent quantities, and species concentrations. In designing the POME- nozzle, the basic governing equations that will be used are the conservation of mass, momentum and energy equations.
5.5.1 Continuity Equation
In any fluid flow, the equation for conservation of mass, or continuity equation, can be written as follows:
( )
u m xjt ∂ j =
∂ + ∂
∂
ρ
ρ
(5.5.1)Where uj is the jthCartesian of the instantaneous velocity, is the fluid density and m
represents the rate of mass generation in the system. This equation is valid for incompressible as well as compressible flows.
5.5.2 Momentum Equation
The law of conservative of momentum states that
( )
(
)
ii ij i j
i
i xi uu x x f
Where is the static pressure, ij is the viscous stress tensor and ƒj is the body force.
For Newtonian fluids:
ij k k i j j i ij x u x u x u
δ
µ
µ
τ
∂ ∂ − ∂ ∂ + ∂ ∂ = 32 (5.5.3)
Where
µ
is the fluid dynamic viscosity andδ
ij is the Kronecker deltas.Substitute equation (5.5.3) into (5.5.2) results in the Navier –Strokes Equation
( )
(
)
ij ik k i j i i j i i j
i x x f
u x u x j u x u
t
δ
ρ
µ
µ
µ
ρ
ρ
+ ∂ ∂ − ∂ + ∂ ∂ ∂ ∂ + ∂ ∂ + ∂ ∂ 32 (5.5.4)
6.5.3 Energy Equation
The energy equation governs the enthalpy balance. For CFD, the static enthalpy is used. Conservation of energy is described by
( )
( )
( )
ij i ai j i ij j j j j j j S h J x x u x u x q h u x h + ∂ ∂ − ∂ ∂ + ∂ ∂ + ∂ ∂ + ∂ ∂ − = ∂ ∂
+ ρ τ
ρ ρ ρ
ρ (5.5.5)
WhereJij is the total diffusive mass flux for species ai, hiis the enthalpy for species ai,
a
S stands for additional sources due to surface reaction, radiation and liquid spray and
j
j k x T K q ∂ ∂ −
= (5.5.6)
Where K is the thermal conductivity. This equation is only true for incompressible flow at low March number. The total enthalpy of the energy equation is fully conservative and is recommended for high-speed compressible flows. The total enthalpy H is defined as
2 j ju u h
H = + (5.5.7)
The governing equation for H can be obtained by adding the fluid kinematics energy equation to the static enthalpy equation:
( )
(
)
( )
( )
ij i a i ij j ij i j j j j u f S h J x u x t x T K x H u x H
t τ ρ
ρ ρ
ρ + +
∂ ∂ − ∂ ∂ + ∂ ∂ + ∂ ∂ ∂ ∂ = ∂ ∂ + ∂ ∂ (5.5.8)
5.5.4 Reynolds (Ensemble) Averaged Equation
solution variables in the instantaneous Navier-Stokes equations are decomposed into the mean (ensemble-averaged or time-averaged) and fluctuating components. If the Navier-Strokes equations are averaged over time, the average equations are yielded. Reynolds Averaging can be defined as
ρ
φ
ρ
φ
φ
φ
φ
= ~+ ′′where~= (5.5.9)Applying the equation (5.5.8) into (5.5.1), the averaged continuity equation developed is
( )
u m xt j
j
= ∂
∂ + ∂
∂
ρ
ρ
~ (5.5.10)5.6 DISCRETIZATION METHOD
The method contains settings that control the discretization of the convection terms in the solution equations. It is a numerical method to solve the above equation by discretization of the partial Differential Equations on a computational grid, the formation of a set algebraic equations and the solution of the algebraic equations.
FLUENT allows choosing the discretization scheme for the convection terms of each governing equation. The numerical method yields a discrete solution of the flow field, which is comprised of the values of the flow variables at the grid points. One of the most important terms that need to be discretized is convection. Second-order accuracy is automatically used for the viscous terms.
The mathematical code uses a control-volume-based technique to convert the governing equations to algebraic equations that can be solved numerically. It consists of integrating the governing equations about each control volume.
For example, take an unknown scalar quantityφ, and integrate it for an arbitrary control volume V:
. .
V
v dA φ dA S dVφ
ρφ = Γ ∇φ + (5.6.1)
Where:
v = velocity vector= ˆui vj+ ˆ
A = surface area
φ
Γ = diffusion coefficient forφ
φ
∇ = gradient of iˆ ˆj
x y
φ φ
φ = ∂ + ∂
∂ ∂
Sφ = source of φ per unit volume
When the above equation is applied to the control volume or cells in the computational domain, the discretization yields:
Nforces Nforces
( )
f f f f
f v φ A = f Γ ∇φ φ n A +S Vφ (5.6.2)
Where:
forces
N = number of faces enclosing cell
f
φ = value ofφ convected through face
f
v = mass flux through the face
f
A = area of face f , A = A i A jxˆ+ yˆ
These equations can be applied readily to unstructured, multi-dimensional meshes. Each discrete scalar value of φ is stored in the cell centre. The cell face values
( )
φf requiredof an upwinding scheme. In up winding, the face valueφfis derived from quantities in the
cell upstream, or upwind, relative to the direction of the normal velocity vn. The diffusion
terms in the equations are all central differenced.
5.6.1 Upwinding
Due to the computational domain, the initialised values are quite different from those expected in the final solution after the iteration process has begun. For this reason, first order upwinding scheme is utilised until a more realistic solution is achieved, afterwhich a more accurate second order upwinding scheme could be implemented.
5.6.2 First Order Scheme
When first order accuracy is desired, quantities at cell faces are determined by assuming that the cell-centre values of any field variable represent a cell-average value and hold throughout the entire cell; the face quantities are identical to the cell quantities. Thus when first –order upwinding is utilised, the face value φf is set equal to the cell-centre
value of φ in the upstream cell.
5.6.3 Sequential Discretization
5.6.4 Steady State Implicit
An Euler implicit discretization in time of the governing equations is combined with Newtonian-type linearization of the fluxes to produce the following linearized system in delta form: 1 , force N n n j k j
D+ S ∆Q + = −R (5.6.3)
The centre and off-diagonal coefficient matrices Dand Sj k, are given by:
, , force N j i j j j j k k k V D S t F G S Q Q
= Γ +
∆ ∂ ∂ = − ∂ ∂ (5.6.4) n
R and ∆t are defined in Equations (5.6.5) and (5.6.7) in Appendix D.
5.7 PHENOMENA SIMULATED
5.7.1 Turbulent flow
turbulence characteristics at the inlet. If K and D are specified, the value for L will be ignored. It is sometimes more convenient to provide a length scale instead of a value for dissipation rate. In the derivation of the k-ε model, it was assumed that the flow is fully turbulent, and the effects of molecular viscosity are negligible. The turbulent kinetic energy can be calculated as follows;