This is a repository copy of
Recognizing Human Activity in Free-Living Using Multiple
Body-Worn Accelerometers
.
White Rose Research Online URL for this paper:
http://eprints.whiterose.ac.uk/123964/
Version: Accepted Version
Article:
Fullerton, E., Heller, B. and Munoz-Organero, M. orcid.org/0000-0003-4199-2002 (2017)
Recognizing Human Activity in Free-Living Using Multiple Body-Worn Accelerometers.
IEEE Sensors Journal, 17 (16). pp. 5290-5297. ISSN 1530-437X
https://doi.org/10.1109/JSEN.2017.2722105
[email protected]
https://eprints.whiterose.ac.uk/
Reuse
Unless indicated otherwise, fulltext items are protected by copyright with all rights reserved. The copyright
exception in section 29 of the Copyright, Designs and Patents Act 1988 allows the making of a single copy
solely for the purpose of non-commercial research or private study within the limits of fair dealing. The
publisher or other rights-holder may allow further reproduction and re-use of this version - refer to the White
Rose Research Online record for this item. Where records identify the publisher as the copyright holder,
users can verify any specific terms of use on the publisher’s website.
Takedown
If you consider content in White Rose Research Online to be in breach of UK law, please notify us by
This is a
n author produced version of
Recognizing Human Activity in Free-Living Using
Multiple Body-Worn Accelerometers
.
White Rose Research Online URL for this paper:
http://eprints.whiterose.ac.uk/123964/
Article:
Fullerton, E, Heller, B and Munoz-Organero, M orcid.org/0000-0003-4199-2002 (2017)
Recognizing Human Activity in Free-Living Using Multiple Body-Worn Accelerometers.
IEEE SENSORS JOURNAL, 17 (16). pp. 5290-5297. ISSN 1530-437X
https://doi.org/10.1109/JSEN.2017.2722105
promoting access to
W
hite Rose research papers
Abstract— Objectives: Recognising human activity is very useful for an investigator about a patient's behaviour and can aid in prescribing activity in future recommendations. The use of body worn accelerometers has been demonstrated to be an accurate measure of human activity, however research looking at the use of multiple body worn accelerometers in a free living environment to recognise a wide range of activities is not evident. This study aimed to successfully recognise activity and sub-category activity types through the use of multiple body worn accelerometers in a free living environment.
Method: Ten participants (Age = 23.1 ± 1.7 years, height =171.0 ± 4.7 cm, mass = 78.2 ± 12.5 Kg) wore nine body-worn accelerometers for a day of free living. Activity type was identified through the use of a wearable camera, and sub category activities were quantified through a combination of free-living and controlled testing. A variety of machine learning techniques consisting of pre-processing algorithms, feature and classifier selections were tested, accuracy and computing time were reported.
Results: A fine k-nearest neighbour classifier with mean and standard deviation features of unfiltered data reported a recognition accuracy of 97.6%. Controlled and free-living testing provided highly accurate recognition for sub-category activities (>95.0%). Decision tree classifiers and maximum features demonstrated to have the lowest computing time.
Conclusions: Results show recognition of activity and sub-category activity types is possible in a free living environment through the use of multiple body worn accelerometers. This method can aid in prescribing recommendations for activity and sedentary periods for healthy living.
Index Terms— Human Activity Recognition, Machine
Learning, body-worn accelerometers
I. INTRODUCTION
Physical activity and its benefits to health have recently been a popular area of research [1,2]. The increase or maintenance of a certain level of physical activity has been demonstrated to
8th February 2017
This work was supported by the Centre for Sports Engineering research, Sheffield Hallam University, Sheffield, UK
E. F Elliott Fullerton was with the Centre for Sports Engineering Research, Sheffield Hallam University, Sheffield, UK S10 2HP. He is now with the National Centre for Sport and Exercise Medicine, Loughborough University, Loughborough, UK LE11 3TU ([email protected]).
B. H. Dr. Ben Heller – Centre for Sports Engineering Research, Sheffield Hallam University, Sheffield, UK, S10 2HP ([email protected]). M. M Professor Mario Munoz-Organero – Department of Telematic Engineering, University Carlos III de Madrid, Madrid, Spain ([email protected])
reduce the risk of chronic diseases and is now widely accepted in promoting a healthier lifestyle [1,2]. Despite this knowledge, statistics show that average healthy life expectancies, where one perceives oneself to be in "Good" health, are still falling [3]. In order to change current behaviour, understanding the determinants and barriers to physical activity behaviours is important in designing interventions to improve healthy life expectancies [4]. Therefore, accurate measurement of activity types and the intensity they are performed at is important [5]. The use of wearable technology, more specifically body-worn accelerometers is a common tool for activity recognition which has allowed researchers to gain accurate insight into activity types [6,7].
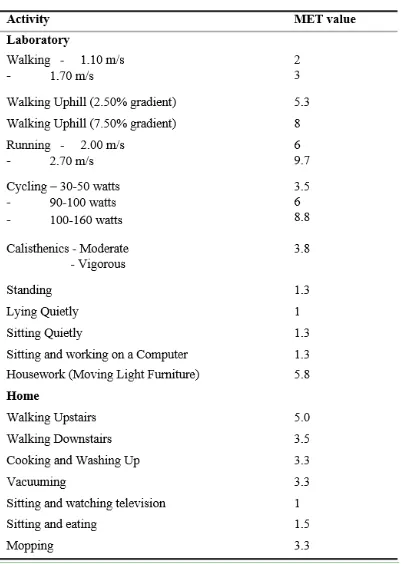
Typically, physical activity is viewed as either engaging in sport or some form of exercise; in fact, it is actually defined as any bodily movement produced by skeletal muscles resulting in energy expenditure above resting level [8]. This entails all activity whether it be cleaning the kitchen or playing a computer game. Quantifying and comparing activity types is possible through looking at the ratio of exercise metabolic rate, where one metabolic equivalent of a task (MET) is defined as the energy used when simply lying quietly. For the average adult, one MET averages at 3.5 ml of oxygen uptake per kilogram of body weight per minute. Furthermore, any activity with two METs requires twice the amount of metabolic energy used than lying quietly [9]. For nearly all activity types, the Taylor Compendium of Physical Activity contains a MET value [10]. For activity prescription purposes any value between three and six METs can be identified as moderate activity, which has been shown to have a positive impact on a person's wellbeing and is often the range recommended to populations [6].
With the decrease in healthy life expectancies and increases in long term health care costs on a yearly basis [11], highlighting activity type and intensity is essential to providing populations with recommendations of what is necessary to improve; disease prevention, musculoskeletal, mental and performance health. Currently adult populations in many countries are advised to take part in 150 minutes of moderate activity a week [12, 13]. Furthermore, patients with obesity, heart disease, or diabetes are often given a specific exercise routine to follow [14]. Reference [15] stated that continuous physical and physiological monitoring in any environment would shorten hospital stays for patients, improve recovery, reliability of diagnosis and improve
Recognising human activity in free
-
living using
multiple body
-
worn accelerometers
patients' quality of life [15]. On the other hand, rises in sedentary behaviour have also been correlated with health risks [16]. Sitting and watching television is now one of the most popular activities and over two hours a day can have an unfavourable effect on body composition and decreased fitness [16]. As a result, recognising activities whether sedentary, moderate or vigorous becomes very useful for an
investigator or practitioner about the participant’s or patient’s
behavior [17], and can aid in prescribing activity in future recommendations.
Human activity recognition (HAR) dates back to the 1990s where ambulatory movements were recognised from the use of sensor based systems in controlled environments [18]. More recently, HAR systems have been modelled outside of a laboratory environment which involve the use of accelerometers [19,20]. Other methods such as computer vision and motion capture techniques have also been used and have reported high accuracies [21]. However, these techniques are often only capable of being used in a controlled environment where participants are instructed to perform specific activities. Body-worn accelerometers have the capability to monitor participants in uncontrolled environments for long periods of time [22].
Recognition of activity type from accelerometer data has been achieved by many researchers using machine learning techniques [17,23]. These techniques take large data sets that undergo filtering, segmentation and feature extractions, like the mean of a specified signal, this information is then used to train a percentage of the data with a specific classification method; the recognition accuracy is then reported when the training algorithm is tested on the remaining data set. A wide variety of classification methods have been reported to be accurate., Reference [24] showed the accurate classification through the use of a simple decision tree approach to discriminate between standing and sitting, Reference [25] showed the use of a nearest neighbour method in correlation with multiple sensors for an activity recognition platform and Reference [26] used a support vector machine method for a more complex recognition of multiple tasks that mainly involved hands and arms. Moreover, the key to successful recognition is that filtering, segmentation and feature extraction is specific to the activities that have been defined [17]. With this knowledge high activity recognition is now reported frequently [23], what is more concerning is the computing time necessary to process complex filters, features and classifiers if the user is looking for immediate feedback about their activity level. Recently Reference [6] showed the use of multiple accelerometers and simple filters alongside a simple and fast decision tree classification method which utilises mean and variance features to be just as good predictor (>90% recognition accuracy) of a range of activities (lying, sitting, standing and walking) compared to more complex approaches. When using multiple sensors though the output heavily depends on the position at which it is placed and its stability [19].
Whilst many studies have looked at HAR outside of a laboratory and in a controlled environment, there is a lack of
research evidence that looks at accelerometer data in a free-living environment. Recently Reference [27] looked at the identification of activities in free living through a body worn camera and a two accelerometers [27]. Each activity was defined from the Taylor compendium of physical activities [10], and intensities were determined from a guide that investigators followed. Reference [27] reported identification of 81% of images captured but highlighted the need for more in depth analysis with the use of wearable sensors. It is worth noting that in addition to a hip mounted accelerometer, another was not mounted as is standard in the physical activity research community, instead was freely suspended from a lanyard. Also, intensity and nature of activities performed were not used to create a classification model that could be used with other free-living data.
Therefore, this study aims to successfully recognise human activity in a free living environment through the use of multiple body worn accelerometers and machine learning analytic techniques, where not only multiple accelerometers are used to gain high recognition accuracy but also the efficiency of different feature and classifiers selections are shown. Whilst main activity types can be identified through a wearable camera, more specific activities and intensities can be validated in a controlled environment under the investigators control. The following sections present the steps taken to identify each activity type and what machine learning techniques are used and are most suited for this data. If successful, these techniques can be used to help aid recognising a wider range of physical activities in the future that can help with better understanding of prescribing activity levels for a healthy population.
II. METHODS
Ten participants (Age = 23.1 ± 1.7 years, height =171.0 ± 4.7 cm, mass =78.2 ± 12.5 Kg, male = 8, female = 2) participated in the study. All participants were free from illness and injury at the time of data collection. Participants were briefed on study procedures and made aware of the associated risks and benefits. Consent was given by all and each participant was informed they were free to withdraw from testing at any point, without prejudice. Prior to data collection, ethical approval was given by the faculty of Health and Wellbeing in Sheffield Hallam University. All data were recorded and stored confidentially.
Controlled testing
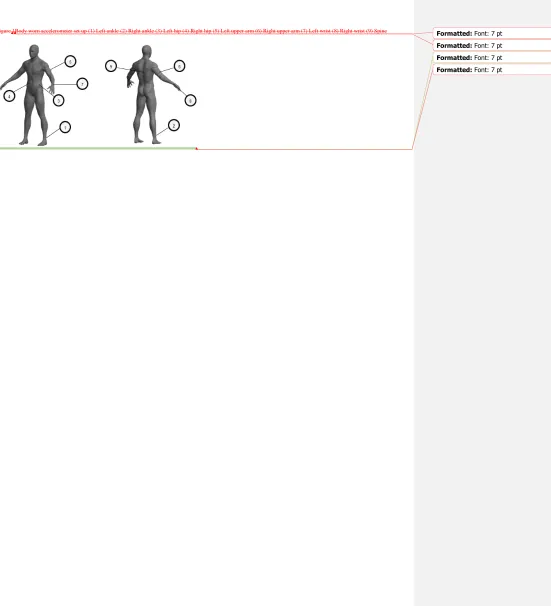
sensor set up shown in Fig 1 consisted of nine body worn runscribe™ inertial sensors (Scribe Labs, California,USA) containing a tri- axial accelerometer which were applied to the: left and right lateral ankle, left and right hip (ASIS), left and right wrist (resting on the radius), left and right upper arm (resting on the brachialis) and Spine (T10) by the same investigator for all participants. Locations of sensors were based on a collection of previous research that looked at a range of activity types [6,23]. Sampling frequency for each sensor was set at 10 Hz with the addition of a low pass anti-alliasing filter of 5 Hz. All sensors were synchronised via time of initialisation.
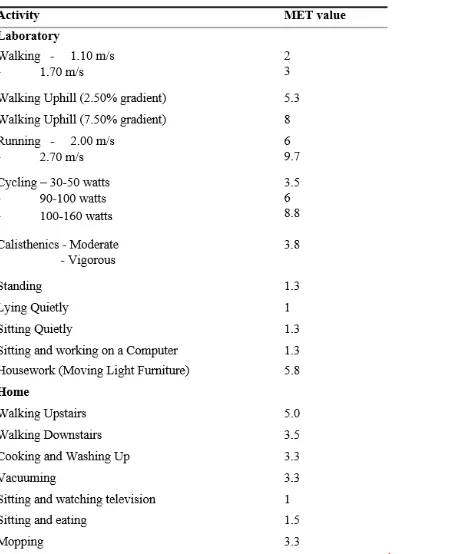
Table 1Activity Types performed in controlled testing with associated MET Value
All walking and running activities were performed on a treadmill (Pulsar, HP Cosmos, Germany) and cycling activities were performed on a cycle ergometer (Monark Exercise, Sweden). Participants were instructed to perform callisthenic exercises that they would normally do in a free living environment, they were not restricted to a specific set of movements to allow for variability between participants. Activities performed outside of the laboratory were completed in a home environment. Walking up and downstairs was performed on a flight of six stairs where all other activities were performed in a kitchen and living room setting.
F igure 1Body worn accelerometer set up (1) Left ankle (2) Right ankle (3) Left hip (4) Right hip (5) Left upper arm (6) Right upper arm (7) Left wrist (8) Right wrist (9) Spine
Free Living
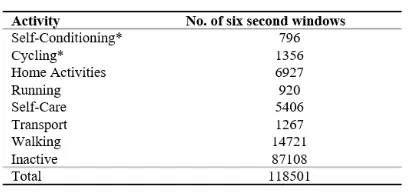
Ten participants (seven male and three female) wore the same accelerometer set up as controlled testing (Fig 1), sampling frequency was kept at 10 Hz with a low pass filter of 5 Hz and all sensors were synchronised via time of initialisation. Accelerometers were applied to participants as they woke up and removed before going to sleep. Primary activity types and sub-categories if possible were defined from a wearable camera (SnapcamLite, iON Ltd, UK) that captured an image every 30 seconds; To highlight if any drift was present, the on board timer of the camera was compared against a stopwatch that assessed the difference in time from start to finish of data capture. Participants were instructed to remove the camera during free living if they did not want a picture to be recorded at that point in time (for example going to the toilet or getting changed). Activity types were categorised into eight main categories 1) Self-Conditioning 2) Cycling 3) Home activities 4) Running 5) Self-Care 6) Transport 7) Walking 8) Inactive. Within sub-categories another 29 activities were defined (Appendix A) taken from the Taylor compendium for physical activities [11]. The primary investigator followed a set of guidelines for image identification; the reliability of identification was also reported for a subset of the data from a secondary investigator who followed the same guidelines.
Data analysis
Data were stored and analysed using Matlab (Mathworks 2015b, USA). Once all images were identified, two different high pass filters (Chebyshev and Eliptic) and a discrete wavelet analysis were run using Matlab Filter design toolbox (Mathworks 2015b,USA) as previous research has shown the benefits of these pre-processing techniques on recognition accuracy [23].
An activity-defined window approach was used to define the activity at each picture taken during free living. This window was segmented into six second windows which had a 50% overlap. Data for controlled testing was segmented into the same six second period and overlap. Previous research has used much smaller windows [6], based on suggestions that
[image:6.612.38.239.292.574.2]increased window size reduces sensitivity [19], however the nature of the 30 second image capture and the large dataset means that a large window is more suited.
A variety of heuristic, frequency and time domain features were created based on recommendations from a wide variety of successful features [23]; for each feature and classification method, the computing time was calculated and the recognition accuracy was reported for every sub category the same analysis was run again and the highest accuracy was reported for specific features and classifiers.
Feature Selection
Time-domain features were directly derived from the data segment using MATLAB script files (Mathworks 2015b, USA) created in-house. All features were extracted from the average signal output over a windowed period. Features consisted of: mean, standard deviation, root mean square, peak count and peak amplitude. Features were extracted from each sensor and each axis (9 sensors and 3 axes, 27 different values for each feature).
Frequency-domain features focused on the periodic structure of the signal, features included spectral energy and spectral power. Spectral energy has shown to highlight the periodicity in an acceleration signal and distinguish between different intensity activities [28]. Spectral entropy features calculated the frequency domain entropy from a Fast Fourier transformation, previous research has shown this can help discriminate values with similar energy [28]. As before all frequency- domain features were extracted from each axis for each sensor and kept singular.
Heuristic features have been derived from a fundamental understanding of how specific movements can create distinguishable sensor signals [29]. Signal magnitude area has been shown to effectively identify periods of daily living [20]. (1) shows the calculation for signal magnitude area.
(1)
Where , and refer to the , and axis signal for each windowed output Signal vector magnitude (SVM) features have also been used with recognition in human activity; it essentially provides a measure of movement intensity. (2) shows the calculation of SVM.
(2)
Where is the value of the signal , as is the same for and . In this case was taken as the maximum value. Unlike time or frequency domain features each sensor collates all three axes which essentially reduces 27 different signals down to nine features for each window.
Classification
For each recognition processall methods, 80% of the data were used for training and 20% was tested using the MATLAB Classification Learner toolbox (Mathworks 2015b, USA). Decision tree classifiers are support tools which make decisions based on tree-like models. A complex decision tree structure was chosen for this dataset which contained 42 levels of decisions based on acceleration output from specific sensors. Split criterion was based on Ginis diversity index. Support vector machines (SVMs) are supervised learning methods used for classification. For this dataset a cubic method approach was chosen meaning a kernel value of three was used. Box constraint was equal to one and one vs one multiclass method was used where all data was standardized. Nearest Neighbour methods are used for classification of activities based on the closest training examples in the feature space. For this data set the number of neighbours was set to one for optimum computing time, distance between neighbours were euclidean and weights were equal where all data was again standardized. Ensemble classifiers are not as common in HAR studies but have recently been reported to
improve recognitionbe accuracyteand improve efficiency in other machine learning areas [30]. Essentially this method combines a set of trained weak learner models from above and data on which these learners were trained. It can predict ensemble responses for new data by aggregating predictions from its weak learners. For this data set a set of 200 as standard in the decision tree learners MATLAB classification Learner toolbox were bagged together.
III. RESULTS
Table 2 Recorded Episodes of Activityy -
*Show aActivities not included in free-living recognitiony types that
were not RECOGNISED DURING FREE-LIVING
Formatted: Space After: 6 pt
Formatted: Font: Bold
Formatted: Font: Bold
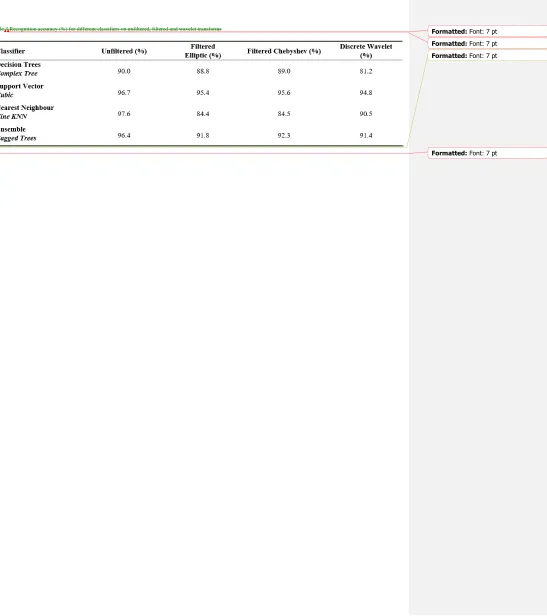
[image:8.612.36.240.181.278.2]Table 3 Recognition accuracy (%) for different classifiers on unfiltered, filtered and wavelet transforms
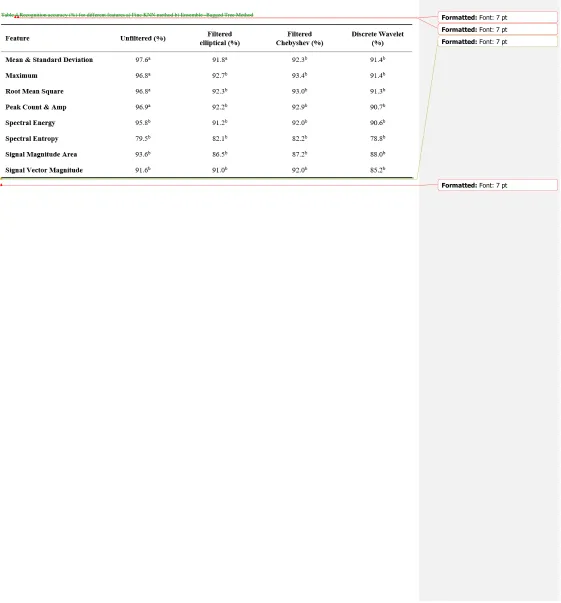
Table 4 Recognition accuracy (%) for different features on unfiltered, filtered and wavelet transforms. Best performing classifier is shown:
a) F ine KNN method b) Ensemble -Bagged Tree Method
A recognition accuracy of 97.6% was found for main activity types using unfiltered data, mean and standard deviation features along with a fine k-nearest neighbour method. A full representation of the performance of different classifiers on unfiltered, filtered and wavelet transformed data is shown in Table 3. All pre-processing techniques showed no increase in recognition accuracy and high recognition accuracies were also achieved with ensemble (96.4%) and support vector machine (96.7%) methods.
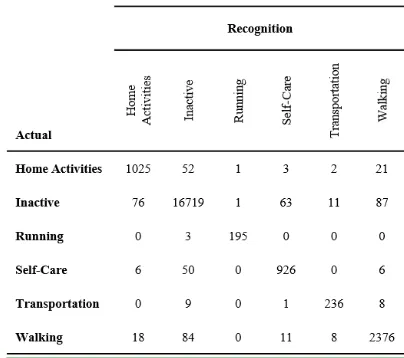
Mean and standard deviation features together provided the best accuracy out of all features selected for both nearest neighbour and ensemble methods. The worst feature, spectral entropy produced recognition accuracy of 79.5%, however it did improve through the use of filters as did signal vector magnitudes. Results for all features used are displayed in Table 4. A confusion matrix from the fine KNN method with mean and standard deviation features from unfiltered data is shown in Table 5. 283 (1.30%) inactive episodes and 121 (0.55%) walking episodes were predicted instead of correct activity types.
[image:9.612.35.453.161.380.2] [image:9.612.37.457.414.573.2]Table 5 Confusion matrix for free living activities using fine KNN method with mean and standard deviation features
Analysis of the impact of calculation of various features and classifiers was completed using a pre -defined Matlab timing function (Mathworks 2015b, USA). Table 6 shows the computing time for the range of features and classifiers selected. Feature calculation times were assessed for one sensor of the free-living dataset. Maximum feature values showed fastest execution times of 4.0 milliseconds whilst Spectral Entropy showed to be the slowest at 100.0 seconds.
Classifier times were assessed using mean and standard deviation features. A decision tree method proved to be fastest (6.2 seconds) but not as accurate, where a fine KNN approach demonstrated to be accurate with some sacrifice on computing time (76.6 seconds). The SVM approach showed accurate results however computing time was 70 times larger compared to other classifiers.
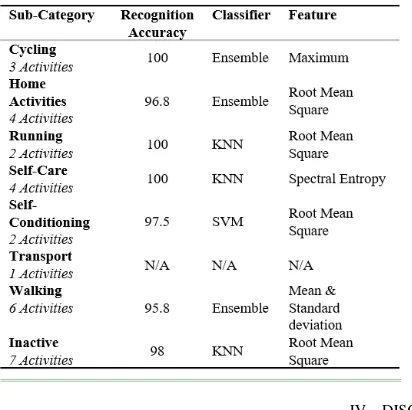
Considering the recognition accuracy obtained for main activity types, only unfiltered data was analysed for each sub -category. Sub-categories utilised data from controlled and free living data. As above for each sub-category a range of classifiers and features were analysed. Table 7 shows the highest recognition accuracy achieved for each sub category and what feature and classifier it was achieved with. 100% recognition was achieved for cycling, running and self-care activities, whilst all other activities accuracy was above 95.0%. Root mean square features showed to be a strong predictor for three of the categories, however when using other features, high recognition accuracy was also shown. For example, peak count and amplitude features for cycling showed an accuracy of 99.3% and mean and standard deviation features showed an accuracy of 99.5% for running activities. Decision tree methods fell below 90.0% accuracy for walking, calisthenics and inactive categories, all other classifiers showed accuracies above 90.0%.
[image:10.612.34.236.189.368.2]Table 6 Computing time of different features and classifiers for free-living data set
Table 7 Optimal F eature and Classifier representation for Sub-Category activity types
IV. DISCUSSION
In this study, the design of a sensory system of multiple body worn accelerometers consisted of signal pre -processing algorithms, feature and classifier selections. The use of a wearable camera presented to be reliable r=0.93 and r=0.92 for image identification of main and subcategory activity type respectively which agrees with previous research [27]. Three different signal pre -processing algorithms were tested along with a wide range of features and classifiers. Results showed the use of unfiltered data along with the use of mean and standard deviation features recognised six main activity types accurately for 97.60% of the ti me with a fine KNN classification method.
[image:11.612.38.239.158.280.2] [image:11.612.37.243.301.506.2]for free living recognition, however when considering training, nearest neighbour methods produced much higher accuracies (>7.0%) with a sacrifice of 76.6 seconds/sensor in computing time. It is worth noting that this increase in computing time may be too high when using many sensors, it is therefore ideal to reduce the number of sensors when using this method.
The use of different methods for each sub category with a combination of data from controlled testing showed to be useful and is recommended in future investigations. No sub-category accuracy fell below 95.0% recognition; this is likely due to the small amount of activities within each sub-category. On the other hand, within the walking category, a range of activities which were based on gradient, intensity and stair based activities were identified and a 95.8% accuracy was still achieved which shows t hat a wide range of activities within a contained category can still produce accurate recognition.
Whilst testing was defined as free living, where participants were free to act how they normally would, it was reported that camera set up had an influence on participants, participants often mentioned that they felt uncomfortable in performing daily activities, this likely correlates with the high number of inactive episodes recorded. In future, sensor -compatibility with participants should be addressed to ensure that free-living is as free as can be. Image identification proved to be reliable, however the process of image identification is time consuming and experience on the researcher's behalf is necessary for reliable res ults. Moreover, common misclassification was shown in episodes of inactivity (1.3%) and walking periods (0.55%), it is likely that more than one activity is performed in a 30 second window. andtThis is where most of the misclassification lies.a limitation to this study and F future research should therefore look into the use of video or smaller image windows to gain greater insight into activity type and duration performed. Of all 29 activities recognised, it is worth noting that none were overly vigorous caus ing high accelerations, it is possible that accuracy may have been hindered if more vigorous activities were included. The robustness of the model trained may not be applicable to a wider population and it is recommended that future investigation use a smaller testing set.
Though the accuracy of multiple body worn accelerometers has been shown to be successful in activity recognition in a free living environment, the accuracy of the number of sensors and what set up is most user friendly should be assessed in future studies. More activities taken from the Taylor compendium of physical activities should also be recorded for each category to gain more insight into specific activities and help better understand the dose of activity needed.
V. CONCLUSION
Successful recognition of six main activities in a free living environment was achieved from the use of multiple body worn accelerometers. A fine k-nearest neighbour classification method with the use of mean and standard deviation features was shown to be the best predictor of activity types. The use of different classifiers from free-living and controlled testing to recognise sub categories demonstrated high accuracies and is recommended for future investigations. Future studies should loo k at how many sensors are required to achieve successful recognition and also look at a wider variety of activities that are sedentary, moderate and vigorous.
VI. PRACTICALIMPLICATIONS
APPENDIX
ACKNOWLEDGMENT
The authors would like to thank the Centre for Sports Engineering research at Sheffield Hallam University for their support throughout the project.
REFERENCES
[1] Warburton DE, Nicol CW, Bredin SS. Health benefits of physical activity: The evidence. CMAJ. 2006;174(6):801-809.
[2] Penedo FJ, Dahn JR. Exercise and well-being: A review of mental and physical health benefits associated with physical activity. Curr Opin Psychiatry. 2005;18(2):189-193.
[3] Steel K. (2013) Healthy life expectancy at birth for upper tier local authorities: England, 2011 to 2013 [Online] Available:
https://www.ons.gov.uk/peoplepopulationandcommunity/healthandsocialcare/healthandlifeexpectancies/bulletins/healthylifeexpectancyatbirthforuppertierlocalau thoritiesengland/2015-03-26
[4] Bauman AE, Reis RS, Sallis JF, et al. Correlates of physical activity: Why are some people physically active and others not? The lancet. 2012;380(9838):258-271.
[5] Koorts H, Mattocks C, Ness AR, et al. The association between the type, context, and levels of physical activity amongst adolescents. Journal of physical activity and health. 2011;8(8):1057.
[6] Gao L, Bourke AK, Nelson J. Evaluation of accelerometer based multi-sensor versus single-sensor activity recognition systems. Med Eng Phys. 2014;36(6):779-785.
[7] Godfrey A, Conway R, Meagher D, OLaighin G. Direct measurement of human movement by accelerometry. Med Eng Phys. 2008;30(10):1364-1386. [8] Caspersen CJ, Powell KE, Christenson GM. Physical activity, exercise, and physical fitness: Definitions and distinctions for health-related research. Public Health Rep. 1985;100(2):126-131.
[9] Ainsworth BE, Haskell WL, Leon AS, et al. Compendium of physical activities: Classification of energy costs of human physical activities. Med Sci Sports Exerc. 1993;25(1):71-80
[10] Ainsworth BE, Haskell WL, Herrmann SD, et al. 2011 compendium of physical activities: A second update of codes and MET values. Med Sci Sports Exerc. 2011;43(8):1575-1581.
[11] Berry C, Murdoch DR, McMurray JJ. Economics of chronic heart failure. European journal of heart failure.
2001;3(3):283-291.
[12] Colley RC, Garriguet D, Janssen I, Craig CL, Clarke J, Tremblay MS. Physical activity of canadian adults: Accelerometer results from the 2007 to 2009 canadian health measures survey. Health reports. 2011;22(1):7.
[13] Tucker JM, Welk GJ, Beyler NK. Physical activity in US adults: Compliance with the physical activity guidelines for americans. Am J Prev Med. 2011;40(4):454-461.
Formatted: Centered
Formatted: Centered
[14] Jia, Y., 2009, November. Diatetic and exercise therapy against diabetes mellitus. In Intelligent Networks and Intelligent Systems, 2009. ICINIS'09. Second International Conference on (pp. 693-696). IEEE.
Vancouver [15] Wu WH, Bui AA, Batalin MA, Au LK, Binney JD, Kaiser WJ. MEDIC: Medical embedded device for individualized care. Artif Intell Med. 2008;42(2):137-152.
[16] Tremblay MS, LeBlanc AG, Janssen I, et al. Canadian sedentary behaviour guidelines for children and youth. Applied Physiology, Nutrition, and Metabolism. 2011;36(1):59-64.
[17] Lara OD, Labrador MA. A survey on human activity recognition using wearable sensors. Communications Surveys & Tutorials, IEEE. 2013;15(3):1192-1209.
[18] Foerster F, Smeja M, Fahrenberg J. Detection of posture and motion by accelerometry: A validation study in ambulatory monitoring. Comput Hum Behav. 1999;15(5):571-583.
[19] Mathie MJ, Coster AC, Lovell NH, Celler BG. Accelerometry: Providing an integrated, practical method for long-term, ambulatory monitoring of human movement. Physiol Meas. 2004;25(2):R1.
[20] Karantonis DM, Narayanan MR, Mathie M, Lovell NH, Celler BG. Implementation of a real-time human movement classifier using a triaxial accelerometer for ambulatory monitoring. Information Technology in Biomedicine, IEEE Transactions on. 2006;10(1):156-167.
[21] Cai Q, Aggarwal JK. Tracking human motion in structured environments using a distributed-camera system. IEEE Trans Pattern Anal Mach Intell. 1999;21(11):1241-1247.
[22] Tapia, E.M., Intille, S.S. and Larson, K., 2004, April. Activity recognition in the home using simple and ubiquitous sensors. In International Conference on Pervasive Computing (pp. 158-175). Springer Berlin Heidelberg.
[23] Avci A, Bosch S, Marin-Perianu M, Marin-Perianu R, Havinga P. Activity recognition using inertial sensing for healthcare, wellbeing and sports applications: A survey. Architecture of Computing Systems (ARCS), 2010 23rd International Conference. 2010:1-10.
[24] Carós JS, Chételat O, Celka P, Dasen S, CmÃral J. Very low complexity algorithm for ambulatory activity classification. European Medical & Biological Engineering Conference and IFMBE European Conference on Biomedical Engineering. 2005.
[25]Maurer, U., Smailagic, A., Siewiorek, D.P. and Deisher, M., 2006, April. Activity recognition and monitoring using multiple sensors on different body positions. In Wearable and Implantable Body Sensor Networks, 2006. BSN 2006. International Workshop on (pp. 4-pp). IEEE.
[26] Wang S, Yang J, Chen N, Chen X, Zhang Q. Human activity recognition with user-free accelerometers in the sensor networks. International Workshop on Wearable and Implantable Body Sensor Networks (BSN'06). 2005;2:1212-1217.
[27] Doherty AR, Kelly P, Kerr J, et al. Using wearable cameras to categorise type and context of accelerometer-identified episodes of physical activity. Int J Behav Nutr Phys Act. 2013;10(22.10):1186.
[28] Yang J, Wang J, Chen Y. Using acceleration measurements for activity recognition: An effective learning algorithm for constructing neural classifiers. Pattern Recog Lett. 2008;29(16):2213-2220.
[29] Preece SJ, Goulermas JY, Kenney LP, Howard D, Meijer K, Crompton R. Activity identification using body-mounted sensors—a review of classification techniques. Physiol Meas. 2009;30(4):R1.
[30] 1. Azmi MSM, Sulaiman MN. Accelerator-based human activity recognition using voting technique with NBTree and MLP classifiers. International Journal on Advanced Science, Engineering and Information Technology. 2017;7(1):146-152.Wang H, Fan W, Yu PS, Han J. Mining concept-drifting data streams using ensemble classifiers. Proceedings of the ninth ACM SIGKDD international conference on Knowledge discovery and data mining. 2003:226-235.
Elliott Fullerton received the B.Sc degree in mathematics and Sport Science from Nottingham Trent University, UK in 2014, the MSc degree in sports engineering from Sheffield Hallam university, UK in 2016. He is currently a PhD student at Loughborough University as part of the Sport Science and Exer cise Health sciences group looking at the use of wearable technology to examine physical training and bone health in a military population. His work focuses on the implementation of machine learning techniques in health and wellbeing to better understand human behavior.
Ben Heller received the B.A. degree in Engineering Science from the University of Cambridge, Cambridge, U.K. in 1985 and the Ph.D. degree in Biomedical Engineering from the University of Strathclyde, Glasgow, U.K. in 1992.
He worked in Medical Physics at Sheffield Teaching Hospitals, Sheffield, U.K. for 14 years where he specialized in the design of medical instrumentation and the clinical measurement of movement. He is currently a Principal Research Fellow in the Centre for Sports Engineering Research (CSER) at Sheffield Hallam University, Sheffield, U.K. where his research interests include the ambulatory measurement of human physical activity in spo rts, health and disease applications.
Formatted: Font: 7 pt
Formatted: Font: 7 pt
Formatted: Font: 7 pt
M. M. Muñoz Organero (M’08) received the M.Sc. degree in telecommunications engineering from the Polytechnic University of Catalonia, Barcelona, Spain, in 1996, and the Ph.D. degree in telecommunications engineering from the Carlos III University of Madrid, Leganes, Spain, in 2004.
FIGURES AND TABLES
Table 1Activity Types performed in controlled testing with associated MET Value Formatted: Font: 7 pt
Formatted: Font: 7 pt
Formatted: Font: 7 pt
Figure 1Body worn accelerometer set up (1) Left ankle (2) Right ankle (3) Left hip (4) Right hip (5) Left upper arm (6) Right upper arm (7) Left wrist (8) Right wrist (9) Spine Formatted: Font: 7 pt
Formatted: Font: 7 pt
Formatted: Font: 7 pt
Table 2 Recorded Episodes of Activity - *Show Activity types that were not recognised during free-living Formatted: Font: 7 pt
Formatted: Font: 7 pt
Formatted: Font: 7 pt
Table 3 Recognition accuracy (%) for different classifiers on unfiltered, filtered and wavelet transforms Formatted: Font: 7 pt
Formatted: Font: 7 pt
Formatted: Font: 7 pt
Table 4 Recognition accuracy (%) for different features a) Fine KNN method b) Ensemble -Bagged Tree Method Formatted: Font: 7 pt
Formatted: Font: 7 pt
Formatted: Font: 7 pt
Table 5 Confusion matrix for free living activities using fine KNN method with mean and
standard deviation features Formatted: Font: 7 pt
Formatted: Font: 7 pt
Formatted: Font: 7 pt
Table 6 Computing time of different features and classifiers for free-living data set Formatted: Font: 7 pt
Formatted: Font: 7 pt
Formatted: Font: 7 pt
Table 7 Optimal Feature and Classifier representation for Sub-Category activity types Formatted: Font: 7 pt
Formatted: Font: 7 pt
Formatted: Font: 8 pt