Multi-Factor Coupling Model of Concrete Chloride-Ion Diffusion
Coefficient in a Salt Lake
Liming ZHANG
1,
Jia Li
2,
Hongfa YU
31.School of civil and architectural engineering , Nanchang Institute of Technology, Nanchang 330099,China
2.Library, Nanchang Institute of Technology, Nanchang 330099, China
3.Department of Civil Engineering, Nanjing University of Aeronautics and Astronautics, Nanjing 210016, China
Abstract: Immersion in salt-lake solution was adopted to periodically test the concrete chloride-ion diffusion coefficient. The regression analysis was also completed. Also investigated was the time-dependent law of concrete chloride-ion diffusion coefficient with time. The influence of chloride-ion concentration in solution, water-to-cement ratio, and corrosion time on the largeness and accumulation rate of the concrete chloride-ion diffusion coefficient was also analyzed. Test results show that the concrete chloride-ion diffusion coefficient gradually decreased with increasing time and increased with increasing chloride-ion concentration in a salt lake . Taking into account the influence of factors such as water–binder ratio, chloride-ion concentration, and time-varying
characteristics, a multi-factor calculation model for the concrete chloride-ion diffusion coefficient was established. Combining the prediction results and the measured data reported in this paper, the effectiveness and applicability of the established concrete chloride-ion diffusion coefficient calculation model were compared and verified, and the durability design and service life of a concrete structure under cool chlorine were compared. The results of analysis provide important boundary conditions.
Keywords: salt-lake environment, concrete, concrete chloride-ion diffusion coefficient, multi-factor coupling model, chloride-ion concentration
1.introduction
The chloride-ion concentration of salt solutions [1] is more than 10 times that of the marine
environment, with the dry climate and the difference in the morning and evening temperatures
being large. Therefore, in salt-lake environments, the problem of insufficient durability of concrete
structure generally [2,3]leads to the lack of durability of concrete structure, which is the main factor
causing the difference between the internal and external chloride-ion concentration caused by
chloride-ion diffusion [4,5] and steel corrosion in concrete structures [6]. Thus, there is an urgent
need to adopt the corresponding technical means to achieve more than 50 years of service life for
concrete structures.The current method of estimating the service life of concrete structures in
salt-lake environments is mainly based on Fick’s second law of diffusion [7]; therefore, the concrete
chloride-ion diffusion coefficient is an important parameter in predicting the service life of
concrete structures.
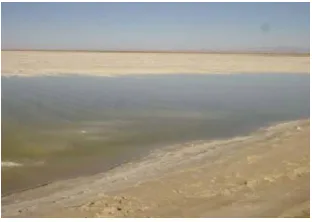
Fig. 1. Chaerhan Salt Lake, Qinghai, China.
Many scholars [7–11] have established the concrete chloride-ion diffusion coefficient of the prediction model for marine environments, the model parameters are mainly sometimes become
model [7,8], water-to-binder ratio [9–11], the time-varying model, etc. However, neither the concentration of chloride ions in an environment influencing the chloride-ion diffusion coefficient of concrete has been reported nor has a model been set up to determine the concrete chloride-ion
diffusion coefficient of chloride-ion concentration in a salt environment.
Furthermore, a multi-factor model of determining the chloride-ion diffusion coefficient of concrete in a salt-lake environment has not been published, to the best of our knowledge, in the literature. In
view of this, analyses of actual salt-lake brine immersion test data from the Qinghai, Inner Mongolia, Xinjiang, and Tibet regions have been carried out,, and the concentration of chloride-ion solution,
water-to-cement ratio, and the influence of the exposure time of surface chloride-ion concentration discussed. A salt-lake environment was built using experimental data from a concrete chloride-ion diffusion coefficient calculation model using multiple factors. An experiment comparing empirical
model calculation values with measured data was conducted and the results compared with the
corrected values, thus verifying the effectiveness and applicability of the model.
2 Test design
2.1 Test plan
A simulated salt-lake-brine immersion test was carried out to study the concentration of
chlorine-ion solution, water-to-cement ratio of surface chloride-ion concentration, and the influence of exposure time. The concrete test was divided into two test groups as shown in Table 1. The tests
used a mix of conch cement, p.o. 42. 5 cement, medium-grade natural river sand, stone produced in Nanchang Anyi with a (5–16)-mm continuous gradation of gravel, tap water, and carboxylic acid as a superplasticizer, with a water-reduction rate of >20%. The differences in proportion between the
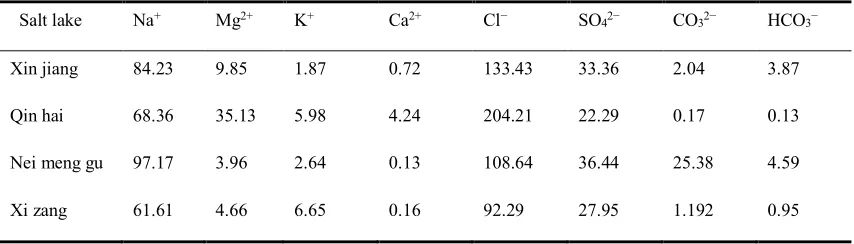
concrete in the two test groups are shown in Table 1. The chemical compositions of the salt solution
are shown in Table 2.
Group Factors Sample no.
Cl−
concentr ation
(%)
Water- to-cement
ratio
Material content / (kg.m−3)
Cement Stone Sand Water Superpla sticizer
1
Salt-lake solution
XZ 9.2
0.55 369 1103 735 203 0
NMG 10.8
XJ 13.3
QH 20.4
2 W/C
S50
20.4
0.50 398 1362 690 196 0
S45 0.45 407 1328 715 183 0
S40 0.40 435 1085 665 174 0
S35 0.35 452 1131 679 158 0
S30 0.30 500 1116 657 150 4.07
S25 0.25 544 1062 708 136 5.85
Table 2. Chemical compositions of various salt-lake brines
Salt lake Na+ Mg2+ K+ Ca2+ Cl− SO
42− CO32− HCO3−
Xin jiang 84.23 9.85 1.87 0.72 133.43 33.36 2.04 3.87
Qin hai 68.36 35.13 5.98 4.24 204.21 22.29 0.17 0.13
Nei meng gu 97.17 3.96 2.64 0.13 108.64 36.44 25.38 4.59
Xi zang 61.61 4.66 6.65 0.16 92.29 27.95 1.192 0.95
2.2 Test steps
The test steps are as follows:
1) The sizes of all concrete block specimens were 100 mm×100 mm×100 mm and were cured,
on average, for 28 d. After removing the specimens from molds, specimens designated Group 1 were soaked in Xinjiang, Inner Mongolia, Qinghai, and Tibet experimental salt solutions, while
designated Group 2 specimens were soaked in a Qinghai salt-lake experimental solution. The exposure times were t=28, 56, 90, 270, and 520 d.
As described in the literature [12,13], the three-dimensional was derived based on Fick's second
2 2 2 2 2 2
0
3 2 2 2
1,3,5 1,3,5 1,3,5 1 2 3 1 2 3
64
sin sin sin exp +
f S S t
m n p
m n p m n p
C C C C x y z Dt
mnp L L L L L L
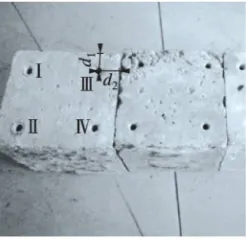
2) The specimens were removed after different exposure times and powder was collected from the two sides of the specimen by drilling. The drilling equipment comprised a small drill with a drill diameter of 6 mm; the drilling position is shown in Fig. 2. In the figure, labels I–IV show the four
powder collection points. The distances from a collection point to the two sides of the specimen are d1=20 mm and d2=20 mm. Eight holes were drilled on each test piece. The sampling depths were
selected as 0–5, 5–10, 10–15, 15–20, and 20–25 mm, and the powder collected from each concrete sample weighed approximately 5 g. A sieve with a pore size of 0.15 mm was used to remove coarse
particles.
Fig. 2. Sample drilling position.
3) The concrete chloride-ion content determination method used for different exposure times can be
found in [14].
3 Test results analysis
3.1 Relationship between chloride-ion diffusion coefficient and solution concentration
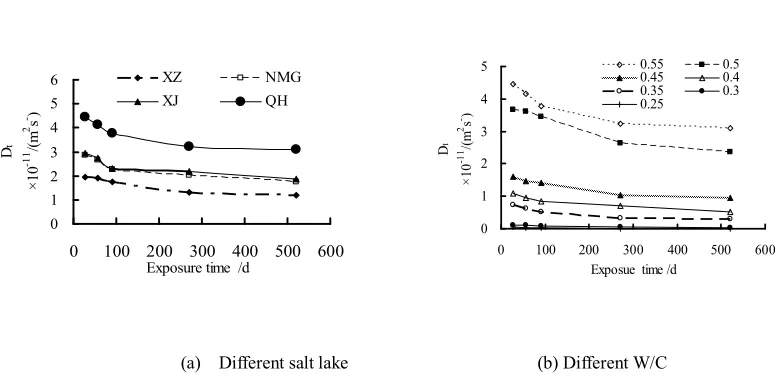
As shown in Fig. 3(a), the chloride-ion diffusion coefficient of concrete in each group increases with increasing chloride-ion concentration in the salt-lake solution. In addition, the growth rate is faster when the chloride-ion concentration is less than 10.8%, and then gradually slows down and
gradually increases until it reaches a stable state. In the same salt-lake solution, the longer the corrosion time, the smaller the chloride ion diffusion coefficient of the concrete. The linear function,
power function, exponential function, polynomials, and other functions of MatLab software (MathWorks, USA) were used to perform regression analysis on the data plotted in Fig. 2. Considering the boundary value (i.e., the chloride-ion diffusion coefficient when the corrosion time
is zero is also zero), the results show that the chloride-ion diffusion coefficient on the concrete surface has a significant power-function relationship with the chloride-ion concentration in the
salt-lake solution for exposure times of 28 and 56 d, The correlation coefficients R for exposure times of 28, 56, 90, 270 and 520 d are 0.953, 0.951, 0.942, 0.958, and 0.961, respectively. Therefore, the relationship between the chloride diffusion coefficient of the concrete surface and the chloride-ion
C l t
D
C
(2)
where α and β are the fitting parameters as shown in Table 3. Dt is the chloride-ion diffusion
coefficient and CCl is the chloride-ion concentration in salt-lake solution in percent.
3.2 Relationship between chloride-ion diffusion coefficient and water-to-cement ratio
As shown in Fig. 3(b), the chloride-ion diffusion coefficient of the concrete surface increases
with increasing water-to-cement ratio. When the water-to-cement ratio is the same, the longer the corrosion time, the smaller is the chloride-ion concentration on the concrete surface. The same
regression analysis described above was performed on the data plotted in Fig. 3 in MatLab. Considering the boundary value (i.e., the chloride-ion diffusion coefficient when the water-to-cement ratio is zero is also zero), the results show that the chloride-ion diffusion coefficient on the
concrete surface has a significant exponential function relationship with the water-cement ratio. For exposure times of 28, 56, 90, 270, and 520 d, the correlation coefficients R2 are 0.973, 0.970, 0.965,
0.967, and 0.936, respectively Therefore, the relationship between the chloride-ion concentration on the concrete surface and the water-to-cement ratio can be expressed by the following power–
function equation that follows the law in [16]:
B W
bR n t
D
10
/(3)
where n and B are fitting parameters with values shown in Table 3, Dt, the concrete chloride-ion
diffusion coefficient, and RW/B, the concrete water-to-binder ratio.
(a) Different salt lake (b) Different W/C Fig. 3. Relationship between concentration, W/C and Dt.
Many studies [14–17] have shown that the time-varying model of the concrete chloride-ion diffusion time-varying model o can more reasonably describe the time-varying characteristics of the chloride-ion diffusion coefficient of concrete. Values for concrete chloride-ion diffusion time
dependence coefficient m are shown in Table 3. As shown in the table, the time-varying coefficient
0 1 2 3 4 5 6
0 100 200 300 400 500 600
Exposure time /d
D
t
×
1
0
-1
1 /(
m
2 s - )
XZ NMG
XJ QH
0 1 2 3 4 5
0 100 200 300 400 500 600
Exposue time /d
D
t
×
1
0
-1
1/(
m
2s -)
0.55 0.5
0.45 0.4
0.35 0.3
m decreases as the chloride-ion concentration and water-to-binder ratio in the salt-lake solution
increases. The m values in Table 3 were fitted using a spreadsheet m was exponentially related to the chloride-ion concentration and water-to-binder ratio in the salt-lake solution. The correlation
coefficients were both higher than 0.90, namely, 0.957 and 0.989. The functional relationship is established, as is the relationship between m and the solution’s chloride-ion concentration and
water-to-binder ratio:
m t
t
D
D
28(
28
)
(4)
where D28 is the chloride-ion diffusion coefficient of the concrete exposed for 28 d, Dt, the
chloride-ion diffusion coefficient of concrete, t, the exposure time (in d), and m, the time-varying
coefficient:
0.2 / Cl 0.133
W B
m R C
(5)
where CCl is the chloride ion concentration (in %) in the salt-lake solution and RW/B is the concrete water-to-binder ratio.
Table 3. Test data-fitting parameters. Expo
sure time (d)
Fitting parameter
R
Fitting parameter
R
Cl−
(%)
m R
RW/B m R
α β n B 0.5 0.164 0.934
28 3E-12 0.937 0.953 -13.8 6.763 0.973 9.2 0.183 0.987 0.45 0.195 0.969 56 2E-12 0.894 0.951 -14.5 8.175 0.970 10.8 0.166 0.948 0.4 0.235 0.967 90 1E-12 0.865 0.942 -14.8 8.475 0.965 13.3 0.149 0.969 0.35 0.334 0.983 270 8E-13 0.801 0.958 -15.3 8.838 0.967 20.4 0.132 0.945 0.3 0.501 0.914 520 6E-13 0.757 0.961 -15.6 9.115 0.969 - - - 0.25 0.596 0.952
4. Establishment and verification of the multi-factor model for chloride-ion diffusion
coefficient
The Life365 model [17] was applied to calculate the chloride-ion diffusion coefficient and
water-to-binder ratio using the following formula:
2 . 0 ) 40 . 2 06 . 12 (
) 28 (
10 /
t
D RW B
t
(6)
4.1 Establishment of the multi-factor model for chloride-ion diffusion coefficient
It is found through the analysis of test results that there is a significant power-function relationship between the chloride-ion diffusion coefficient of the concrete and the chloride-ion
concentration and corrosion time of the solution [18,19]. In addition an exponential function relationship with the concrete water-to-binder ratio was found. Based on the comprehensive analysis of experimental data, in this paper we propose the following calculation model to reflect the effects
of solution chloride-ion concentration, water-to-binder ratio, and time-varying factors on the diffusion of chloride ions in concrete. Inserting Eqs. (4) and (5) into Eq. (6), we obtain the model
proposed:
0.2
/ / Cl
0.133
( 12.93 2.682 )
0.468 Cl
28
1.732 10 RW B ( )RW BC
t
D C
t
(7)
where t is the exposure time (in d), RW/B, the water-to-binder ratio, and CCl, the chloride-ion
concentration (in %) in the solution.
4.2 Verification of the multi-factor model of chloride-ion diffusion coefficient
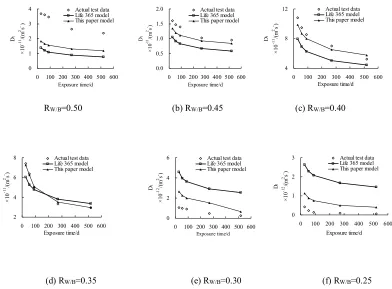
Using the test data in this paper, the results of various calculation models for verifying the chloride-ion diffusion coefficient of concrete, including the Life365 model and a multi-factor chloride-ion diffusion coefficient model are shown in Fig. 4. It can be seen from the figure that the
a fore-mentioned two models both reflect that the chloride-ion coefficient of concrete decreases with increasing exposure time. In general, the results obtained by multi-factor chloride-ion
diffusion coefficient model are closest to the measured values, while the Life365 prediction results deviate significantly from the measured values.
Through further comparison and analysis of the difference between the value predicted by the
Life365 model and the model proposed in this paper and the field-measured values, it can be seen from Fig. 4 that the value predicted by the Life365 model increases rapidly with decreasing water-to-binder ratio, while the increase of the value predicted by the proposed model is relatively flat. It
can also be seen that when the water-to-binder ratio is greater than 0.35, the values predicted by both the Life365 model and the proposed model are smaller than the measured values. Moreover,
the values predicted by the model proposed in this paper are closer to the measured values. When the water-to-binder ratio is 0.35, the values predicted by the Life365 model and the proposed model are consistent with the measured values; when the water-to-binder ratio is less than 0.35, the values
predicted by the Life365 model and the proposed model are larger than the measured values, but the values predicted by the model proposed in this paper are closer to the measured values. The reason
for these results is that the Life365 model does not consider the effect of solution chloride-ion concentration on the chloride-ion diffusion coefficient of concrete. It can be seen that, when compared with the Life365 model, the proposed model is better adapted to include the effects of the
0 1 2 3 4
0 100 200 300 400 500 600 Exposure time/d D t × 1 0 -1 1/( m 2s - )
Actual test data Life 365 model This paper model
0.0 0.5 1.0 1.5 2.0
0 100 200 300 400 500 600 Exposure time/d D t × 1 0 -1 1/( m 2s -)
Actual test data Life 365 model This paper model
4 8 12
0 100 200 300 400 500 600 Exposure time/d D t × 1 0 -1 1/( m 2s -)
Actual test data Life 365 model This paper model
RW/B=0.50 (b) RW/B=0.45 (c) RW/B=0.40
2 4 6 8
0 100 200 300 400 500 600 Exposure time/d D t × 1 0 -1 1/( m 2s -)
Actual test data Life 365 model This paper model
0 2 4 6
0 100 200 300 400 500 600
Exposure time/d D t × 1 0 -1 2/( m 2s -)
Actual test data Life 365 model This paper model
0 1 2 3
0 100 200 300 400 500 600
Exposure time/d D t × 1 0 -1 2/( m 2s -)
Actual test data Life 365 model This paper model
(d) RW/B=0.35 (e) RW/B=0.30 (f) RW/B=0.25
Fig. 4. Comparison between different prediction models and measured values of concrete chloride-ion diffusion coefficient.
5 Conclusions
We draw the following conclusions:
1) When concrete is immersed in salt-lake solution, the chloride-ion diffusion coefficient of
the concrete increases with increasing chloride-ion concentration and water-to-cement ratio in the salt-lake solution, and decreases with the delay in the corrosion time. The chloride-ion diffusion
coefficient of concrete has a power–function relationship with solution chloride-ion concentration, water-to-binder ratio, and exposure time. The time-dependence coefficient m decreases with
increasing chloride-ion solution concentration and water-to-binder ratio.
2) Based on the measured data reported in this paper, a multi-factor coupling calculation model for the chloride-ion diffusion coefficient of concrete is proposed by considering factors like
water-to-binder ratio, chloride-ion content, and time-varying characteristics in the solution.
3) Under different water-to-binder ratios and corrosion time conditions, the proposed
multi-factor coupling calculation model of the concrete chloride-ion diffusion coefficient is more suitable for salt-lake environments than the Life365 model, which is critical to informing the durability design and service life of concrete structures under salt-lake environments. The results of the
analysis also provide important boundary condition.
ACKNOWLEDGMENTS
This work was partially supported by the Science and Technology Project of Jiangxi education
department (No. GJJ180930) and National Key Research and Development Plan "Solid Waste
Resources" Key Projects(No. 2018YFC1903402)
References
[1] Yu Hongfa. STUDY ON HIGH PERFORMANCECONCRETE IN SALT LAKE: DURABILITY, MECHANISM ANDSERVICE LIFE PREDICTION[D]. Southeast University,2004 (in chinese)
[2] Zhang Sanping, Xiao Yide.Emphasis on Material Corrosion in West Environment[J]. Material Protection, 2002,35(7):58-60. (in chinese)
[3]Liu Lianxin. Brief Introduction on the study of Erosion and Prevention of Concrete in Salt lake and Saline Area of Chaerhan,Chaidamu [J].Journal of Building Materials. 2001,4(4):395-400. (in chinese)
[4]HaibingZheng,Jian-GuoDai,WeihuaLi,et al. Influence of chloride ion on depassivation of passive film on galvanized steel bars in concrete pore solution [J].Construction and Building Materials,2018,166(3) : 572-580 [5]Han-SeungLee,Hyun-MinYang,Jitendra KumarSingh,et al. Corrosion mitigation of steel rebars in chloride
contaminated concrete pore solution using inhibitor: An electrochemical investigation[J]. Construction and Building Materials, ,2018,173(6) : 443-451
[6] Abd Elmoaty M. AbdElmoaty. Four-years carbonation and chloride induced steel corrosion of sulfate-contaminated aggregates concrete[J]. Construction and Building Materials, ,2018,163(2) : 539-556
[7] MejlbroL.Thecomplete solution of Fick′s second law of diffusion with time-dependent diffusion coefficient And surfaceconcentration[ C]//Durabilityofconcreteinsalineenvironment, CementAB, Danderyd, 1996:127-158. [8] Pack S W,Jung M S,Song H W,et al. Prediction oftime dependent chloride transport in concrete
structuresexposed to a marine environment[J].Cement and Concrete Research,2010,40(2):302 312. [9]YuanzhanWang,LinjianWu,YuchiWan,et al. Prediction model of long-term chloride diffusion into plain
concrete considering the effect of the heterogeneity of materials exposed to marine tidal zone [J].Construction and Building Materials,2018,159(1):297-315.
[10] JunzhiZhang,JingZhao,YurongZhang, et al. Instantaneous chloride diffusion coefficient and its time dependency of concrete exposed to a marine tidal environment[J].Construction and Building Materials , 2018,167(4): 225-234.
[11] LuFengYang,QianMa,BoYu. Analytical solution and experimental validation for dual time-dependent chloride diffusion in concrete[J].Construction and Building Materials,2018,161(2):676-686
[12] YU Hong-fa, SUN Wei, YAN Liang-hui, et al. Study onprediction of concrete service life Ⅰ: Theoretical model[J]. JChin Ceramic Soc, 2002, 30(6): 686−690. (in chinese)
[14]Zhang Li-ming, Yu Hong-fa, He Zhong-mao. Chloride ion diffusivity of salt lake concrete. Journal of Central South University (Science andTechnology), (2011),42(6):1752–1755. (in chinese)
[15]TangLuping,JoostGulikers. On the mathematics of time-dependent apparent chloride diffusion coefficient in concrete[J]Cement and Concrete Research,2007,37(4):589-595.
[16] H A-WON SONG, H YUN-BO SH IM . Service life prediction of repaired concrete structures unde r chloride environment using finite diffe rence method [J] . Cement &Concrete Composite s, 2009, 31 :120-127. [17] Life-365 Ser vice Life Prediction Modle [ CP/OL] . http:// ww w .life-365 .o rg/dow nload .html .
[18] Luping, T., and Nilsson, L.-O. Chloride Diffusivity in High-StrengthConcrete at Different Ages[J]. Nordic Concr.Res.,1992(11):162-170.