White Rose Research Online URL for this paper: http://eprints.whiterose.ac.uk/113773/
Version: Accepted Version
Article:
Fricke, S. orcid.org/0000-0003-2706-121X, Burgoyne, K., Bowyer-Crane, C. et al. (6 more authors) (2017) The efficacy of early language intervention in mainstream school settings: a randomized controlled trial. Journal of Child Psychology and Psychiatry. ISSN
0021-9630
https://doi.org/10.1111/jcpp.12737
[email protected] https://eprints.whiterose.ac.uk/ Reuse
Items deposited in White Rose Research Online are protected by copyright, with all rights reserved unless indicated otherwise. They may be downloaded and/or printed for private study, or other acts as permitted by national copyright laws. The publisher or other rights holders may allow further reproduction and re-use of the full text version. This is indicated by the licence information on the White Rose Research Online record for the item.
Takedown
If you consider content in White Rose Research Online to be in breach of UK law, please notify us by
The efficacy of early language intervention in mainstream school settings: A Randomised
Controlled Trial
Silke Fricke1
Kelly Burgoyne2
Claudine Bowyer-Crane3
Maria Kyriacou2
Alexandra Zosimidou1
Liam Maxwell1
Arne Ola Lervåg4
Margaret J. Snowling5
Charles Hulme6
1Department of Human Communication Sciences, University of Sheffield, UK
2Division of Psychology and Language Sciences, UCL, UK
3Department of Education, University of York, UK
4Department of Education, University of Oslo, Norway
5Department of Experimental Psychology, and St John’s College, University of Oxford, UK
Declaration of conflicting interests
Revenue from sales of the Nuffield Early Language Intervention programme
are used for charitable purposes. The authors declare that they have no financial interests in
Abstract
Background
Oral language skills are a critical foundation for literacy and more generally for educational
success. The current study shows that oral language skills can be improved by providing
suitable additional help to children with language difficulties in the early stages of formal
education.
Methods
We conducted a Randomized Controlled Trial with 394children in England, comparing a
30-week oral language intervention programme starting in nursery (N=132) with a 20-30-week
version of the same programme starting in Reception (N=133). The intervention groups were
compared to an untreated waiting control group (N=129). The programmes were delivered by
trained Teaching Assistants working in the children’s schools/nurseries. All testers were blind
to group allocation.
Results
Both the 20- and 30-week programmes produced improvements on primary outcome
measures of oral language skill compared to the untreated control group. Effect sizes were
small to moderate (20-week programme: d=.21; 30-week programme: d=.30) immediately
following the intervention and were maintained at follow-up 6 months later. The difference in
improvement between the 20-week and 30-week programmes was not statistically significant.
Neither programme produced statistically significant improvements in children’s early word
reading or reading comprehension skills (secondary outcome measures).
Conclusions
This study provides further evidence that oral language interventions can be delivered
nursery and Reception classes. The methods evaluated have potentially important policy
implications for early education.
Keywords:
It is generally assumed that children enter school with sufficiently
well-developed oral language skills to benefit from education. Indeed, language is the medium of
instruction in all mainstream schools and, importantly, it is also the foundation of literacy
skills (Hulme, Nash, Gooch, Lervåg, & Snowling, 2015; NICHD Early Child Care Research
Network, 2005). It follows that children who enter school with poor language skills are at
high risk of educational underachievement (e.g. Conti-Ramsden, Durkin, Simkin, & Knox,
2009; Roulstone, Law, Rush, Clegg, & Peters, 2011; Snowling, Adams, Bishop, & Stothard,
2001). There is particularly strong evidence that a wide range of non-phonological language
skills, including vocabulary knowledge and grammatical skills are critically important for the
development of reading comprehension (Clarke, Snowling, Truelove, & Hulme, 2010;
Fricke, Bowyer-Crane, Haley, Hulme, & Snowling, 2013). We target those skills in the
intervention reported here.
Interventions to improve the language skills of children with difficulties in this
area are potentially of great educational importance. Studies have typically involved
vocabulary training and shared book reading activities. In general, vocabulary interventions
produce improvements on measures of directly taught words with moderate effect sizes but
generalization is poor. For example, Neuman, Newman, and Dwyer (2011) reported that
12-15 minutes of vocabulary training each day for ‘at-risk’ preschoolers had negligible effects
on a standardized vocabulary measure. More generally, Elleman, Lindo, Morphy, and
Compton (2009), in a meta-analysis of vocabulary interventions for children from pre-school
to grade 12 both with and without learning difficulties, found small effect sizes for
vocabulary measures (d=.29, k=14), but a large effect size for directly taught skills (d=.79,
k=18).
The practice of shared book reading, in which a child and adult ‘read’ a book
language skills. Lonigan, Shanahan, and Cunningham (2008) reported a large effect of shared
book reading on measures of oral language (d=.73, k=16) whether implemented by parents or
in school settings. Moderate to large effects were also found in a meta-analysis by Mol, Bus,
de Jong, and Smeets (2008).
A similar picture emerges from studies which have investigated the efficacy of
speech and language therapy for children’s language disorders. A review by Law, Garrett,
and Nye (2004), excluding interventions of less than 8 weeks duration, found no overall
effect of language interventions on expressive language skills though there were significant
effects for both syntax and vocabulary when children with receptive language impairments
were excluded. None of the therapies improved receptive language abilities. Similar negative
conclusions come from reviews by Cirrin and Gillam (2008), and Boyle, McCartney, O’Hare,
and Law (2010), although a review of ‘what works’ integrating data from treatment studies
with views of parents suggests there are a growing number of language interventions for
which there is ‘indicative’ evidence (Law, Roulstone, & Lindsay, 2015). There is therefore an
urgent need for studies evaluating suitable interventions for use in the early years (before age
6) using rigorous methodologies.
One approach that has been found to be effective in mainstream schools is an
oral language intervention promoting vocabulary, narrative and listening skills, delivered by
trained Teaching Assistants (TAs; Bowyer-Crane et al., 2008). Children receiving this
intervention shortly after school entry made more progress in vocabulary and grammar than
children receiving an alternative treatment focusing on phonology and early reading skills
(see also Bianco et al., 2010). An extension of this approach, starting the intervention before
school entry and supplementing it with training in pre-reading skills for the final 10 weeks,
knowledge (ds=.30-.83; Fricke et al., 2013). Children receiving intervention also showed
significant gains in reading comprehension one year after the intervention finished.
Here we report a replication and extension of the study by Fricke et al. (2013)
in which the UK-based children’s communication charity I CAN was licensed to distribute
the programme, and trained and supported TAs in its delivery. We had the following
hypotheses:
1) The intervention would lead to gains in oral language skills for children
with poor language.
2) We anticipated that the size of the intervention effects would be reduced
compared to the original trial, given that there is typically a reduction in effect size over
successive trials (Ioannidis, 2006). This is likely to be particularly the case when the research
team is not involved in training.
3) A subsidiary aim was to compare the extent to which a 30-week
programme, beginning in the last term of nursery and continuing for 20 weeks in Reception
class, was more effective than simply delivering a 20-week programme starting in Reception
class. We predicted that the 30-week programme would produce larger gains though we had
no confident predictions about the size of such an effect.
4) Since oral language interventions have been found to promote reading
comprehension (Clarke, et al., 2010; Fricke et al., 2013), we predicted that the intervention
group would show improved reading comprehension.
Method
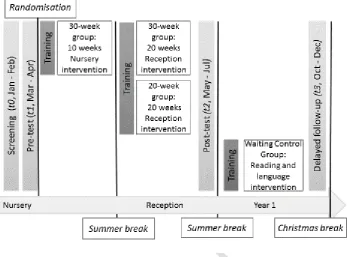
A randomized controlled trial (RCT) was conducted where children from 34
nurseries were allocated to a 30-week intervention, a 20-week intervention or a waiting
Language Intervention programme (following Fricke et al., 2013). This was delivered for 10
weeks in nursery (last term of preschool in England before entering formal schooling; ages
3-4) and continued for 20 weeks in Reception (first year of primary school in England; ages
4-5). The 20-week intervention group received only the final 20 weeks of the intervention in
their primary schools (Reception), while the waiting control group received their usual school
provision. It should be noted that this design with children in different conditions nested
within schools means that there is the possibility of contamination effects. In practice such
effects seem unlikely to have occurred since nurseries/schools were aware of the importance
of adhering to the study design. To the extent to which such leakage does occur it can only
serve to reduce the estimates of the effectiveness of the interventions.
From the beginning of Year 1 (term following post-testing), schools were
given permission to deliver additional language and literacy support to the waiting control
group. Fifteen schools opted for TA training to enable delivery of a targeted language and
literacy intervention provided by the research team to the waiting control group. The
programme offered was different to the Nuffield Early Language Intervention (which would
not have been age-appropriate). However, by delayed follow-up testing only eight of these
schools had started to implement it. The remaining 19 schools chose to include children in the
waiting control group in the school’s existing language and reading support programmes.
The study was granted ethical approval by UCL’s Research Ethics Committee.
Schools were recruited and trained to deliver the intervention programme by I CAN. Head
teachers gave consent for the intervention to be delivered in their schools, and for screening
assessments. Informed parental consent was obtained for all project phases following
screening.
Children were assessed before the start of intervention at screening (t0) and
roughly 6 months after t2). All testers were blind to group allocation. While the waiting
control group remained untreated until post-test, by the time of the delayed follow-up some
of these children had started to receive school-based language and literacy support, though
the specific nature, quality and intensity of this varied widely. The timeline for assessments
and intervention delivery is presented in Figure 1.
-Figure 1 about here–
Participants
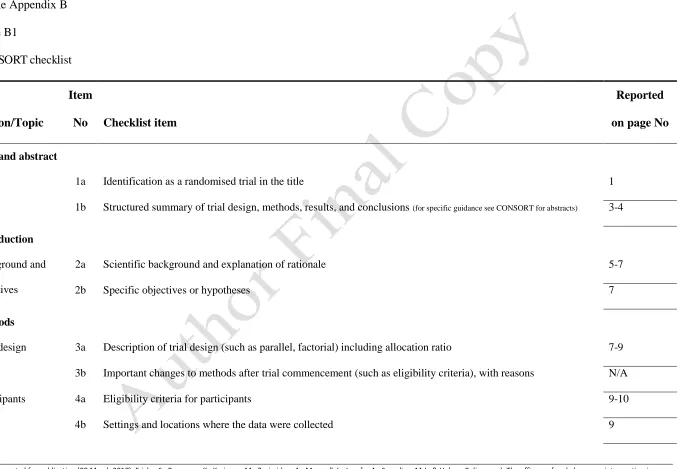
In accordance with the CONSORT guidelines (Schulz, Altman, & Moher,
2010) Figure 2 shows details of the recruitment, allocation and flow of participants through
the study. Sample size was determined based on budget constraints, and a formal power
calculation that showed that with N=120 per arm there was better than 80% power to detect a
difference between groups equivalent to d=.29 (p<.05, 2-tailed).
Our intervention (Fricke et al., 2013) is designed to improve the oral language
skills of children with language difficulties in mainstream nurseries and Reception classes.
We therefore used an equivalent recruitment procedure to that in our previous study. Three
hundred and two primary schools with attached nurseries in generally disadvantaged areas
and with mainly monolingual English-speaking pupils on their registers were approached by I
CAN with information about the study. Of these, 34 schools (Greater London: 17;
Yorkshire/Nottinghamshire: 17) agreed to take part. All children in these nurseries who were
due to enter school (Reception in England) the following academic year were screened.
Children who were on a school’s special educational needs register for difficulties other than
language, and children learning English as an Additional Language who had not yet acquired
sufficient English language skills to participate in the assessments, were not included in the
screening.
Within each school/nursery, 15 children with the lowest mean verbal
composite score based on scaled scores on the screening measures (Child Evaluation of
Language Fundamentals (CELF) Preschool IIUK Sentence Structure and Expressive
Vocabulary subtests; Semel, Wiig, & Secord, 2006) were selected as possible participants in
the study. To validate this initial selection, individual assessments using further language and
early literacy measures were conducted (t1; see below). Up to 12 children in each nursery
(N=394; Mage=3;11) were selected to take part in the RCT based on the following criteria; a)
having the lowest mean verbal composite scores in their school/nursery (derived from
z-scores on screening measures and the British Picture Vocabulary Scale (BPVS; Dunn, Dunn,
& Style, 2009) and b) entering Reception at the same primary school they attended for
nursery. Within each school/nursery children were allocated to either the 30-week
intervention (N=132), the 20-week intervention (N=133) or waiting control groups (N=129).
Group allocation was conducted independently by the Institute for Fiscal Studies and
involved minimisation (Altman & Bland, 2005) for gender, age and the verbal composite
score.
We assessed the number of children in the sample who could be considered to
have clinically significant language difficulties by using standard scores from three
standardized tests administered at screening and pre-test (BPVS, CELF Expressive
Vocabulary, CELF Sentence Structure). The mean standard scores for the sample as a whole
on these tests were: BPVS=86.21 (range 69-118), CELF Expressive Vocabulary=86.95
(range 50-145), CELF Sentence Structure=78.35 (range 60-120). Thus, the sample recruited
has standardised language scores in the low-average range. However, some 186/394 (47%)
children were at the 14th centile or below on the three tests and 149/394 (38%) were at or
below the 10th centile on all three tests. Thus, a high proportion of the sample had clinically
Assessment measures
Primary outcome measures were standardized and non-standardized tests of
language ability. Early literacy skills (letter-sound knowledge and word reading) and reading
comprehension were secondary outcome measures. The same measures as those used in
Fricke et al. (2013) were employed where possible to allow direct comparisons. Some
additional measures such as statutory data collected by schools are not reported here.
Screening (t0), pre- (t1), post- (t2), and delayed follow-up (t3) tests
Language skills
Vocabulary: Expressive vocabulary knowledge was measured using the CELF
Expressive Vocabulary subtest (t0, t2, t3) and the Information Score from the Renfrew Action
Picture Test (APT; Renfrew, 2003; t1-t3). Receptive vocabulary skills were assessed using
the BPVS (t1-t3).
Grammar: Grammatical skills were measured using the CELF Sentence
Structure subtest (t0, t2, t3) and the APT Grammar Score (t1-t3).
Listening Comprehension: Children’s listening comprehension skills were
tested by asking children to listen to two short stories adapted from the York Assessment of
Reading for Comprehension (YARC, Snowling et al., 2009) and answer questions about them
(t1-t3).
Taught Vocabulary: A random selection of the vocabulary taught in the
nursery and Reception parts of the intervention was assessed using Picture Naming (t1-t3)
and by asking children to provide a definition of words (Definitions; t1-t3).
Early literacy skills
Letter-sound knowledge: The Letter-Sound Knowledge subtest from the
Word Level Reading: Word level reading accuracy was measured using the
YARC Early Word Reading subtest (t1-t3; Hulme, et al., 2009).
Reading Comprehension: The two beginner passages from the YARC Passage
Reading test (Snowling et al., 2009) were used to assess children’s reading comprehension
(t3).
Training and intervention programme
Children allocated to the intervention groups received the Nuffield Early
Language Intervention which aims to improve children’s vocabulary, develop narrative skills,
encourage active listening, and build confidence in independent speaking. Children allocated
to the 30-week intervention group received the intervention in nursery (10 weeks) and
continued in Reception (20 weeks) as described by Fricke et al. (2013). Children allocated to
the 20-week intervention group only received the Reception part of the programme.
During the first 10 weeks in nursery, three 20-minute sessions were delivered each
week to groups of 2-4 children (total small group intervention time: 10hrs). Topic areas
covered as part of the vocabulary work are ‘Family & Friends’ (15 sessions) and ‘Our House’
(15 sessions). The 20 weeks in Reception consist of 57 30-minute small group sessions (2-4
children) and 37 15-minute individual sessions with children participating in three group and
two individual sessions per week (total intervention time: small group 28.5hrs; one-to-one
9.25hrs). In the last 10 weeks the active listening work is extended to incorporate explicit
activities to promote phonological awareness and letter-sound knowledge; these programme
elements were designed to reinforce the literacy instruction all children receive in school.
Whenever possible, phonological awareness and letter-sound knowledge activities
incorporated taught vocabulary in order to further consolidate these words. The topic areas
covered in Reception are ‘My Body’, ‘Things we wear’, ‘People who help us’, ‘Growing’,
listening skills and incorporates auditory discrimination, memory, and sequencing as well as
rhyming activities in line with phase 1 of the phonics resource Letters and Sounds (DfES,
2007). In the last 10 weeks, the listening activities are extended to include activities targeting
phonological awareness (blending and segmenting) and letter sound knowledge.
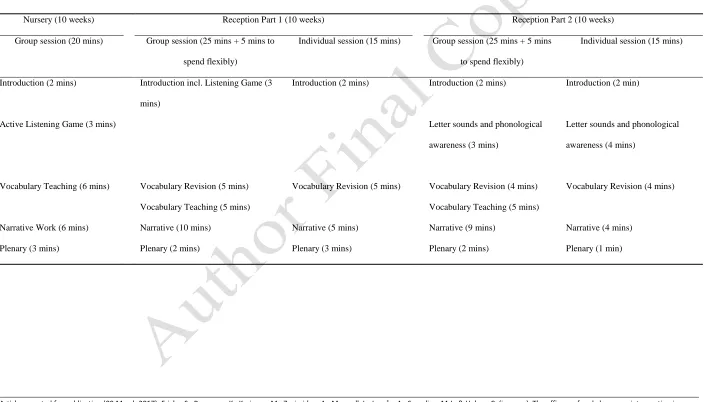
The Nuffield Early Language Intervention teaches children using
multi-sensory techniques within a standard framework (see Online Appendix A for details). The
programme was designed with reference to the Primary Framework for Literacy and
Mathematics (DfES, 2006), the Statutory Framework for the Early Years Foundation Stage
(DCSF, 2008), and in consultation with teachers and speech and language therapists. Topics
and vocabulary were selected to cover different word types and vocabulary is taught using a
multi-contextual approach within a repetitive framework that follows established principles
for teaching listening, vocabulary and narrative (e.g., Beck & McKeown, 2007; Beck,
McKeown, & Kucan, 2013; Carroll, Bowyer-Crane, Duff, Hulme, & Snowling, 2011; Locke
2006). Narrative work allows the use of taught vocabulary in connected speech and
introduces children to key story elements and sequencing of events while encouraging
expressive language and grammatical competence.
The intervention was delivered by TAs selected by their nursery/school who
were trained and supported by I CAN. The training content was based on that used in Fricke
et al. (2013). TAs received one day of training prior to delivering the nursery part and two
further training days prior to the Reception part. I CAN also offered telephone support on
request to TAs. The training for this field trial differed from the research trial in two ways: in
contrast to Fricke et al. (2013), TAs did not receive a one-day refresher training before the
last 10-week block in Reception, and the level of support they received during the
intervention phase was much reduced. The role of the research team in delivering the
of teaching in nursery (one group session) and Reception (two group and two individual
sessions), and collecting completed record forms from TAs. Following the observations,
feedback was provided and areas of improvement discussed as necessary.
Results
TAs delivered on average 28.44/30 (SD=4.35, Range: 10-30) group sessions
to the 30-week intervention group in nursery and 49.17/57 (SD=13.22, Range 10-58) group
sessions in Reception. For the 20-week intervention group TAs delivered on average
48.72/57 (SD=13.55, Range: 10-57) group sessions in Reception. The number of sessions
each child attended varied considerably (30-weeks: Nursery group sessions: M=24.69,
SD=6.37, Range: 0-30; Reception group sessions: M=38.51, SD=20.62, Range: 0-57;
Individual sessions: M=21.91, SD=15.37, Range: 0-43; 20-weeks: Reception group sessions
M=41.11, SD=19.65, Range: 0-57; Individual sessions: M=23.01, SD=15.40, Range: 0-44).
Although the range of sessions completed varied widely, preliminary analyses showed no
significant relationship between the number of sessions delivered and the degree of
improvement on measures of language skills. Data from all children for whom t2 data are
available are included in the analyses.
In addition to recording the number of sessions attended, some teaching
sessions were observed to assess treatment fidelity. We graded the quality of teaching of
different session components on a 5-point scale with the manual instructions as a reference
point (1=several aspects missing/not satisfactory, 2=some aspects missing/not satisfactory,
3=according to manual, 4=according to manual with good use of
resources/questions/techniques to support language, 5=according to manual with very good
use of resources/questions/techniques). On average, TAs achieved a mean quality rating of
2.83 (SD=0.46, Range 2.00-3.83) for group sessions observations in nursery, 2.95 (SD=0.49,
the second ten weeks in Reception. Fidelity and quality ratings for individual sessions tended
to be lower than for more manualised group sessions (first ten weeks in Reception: M=2.74,
SD=0.55, Range 1.20-3.80; second ten weeks: M=2.83, SD=0.56, Range 1.83-4.00).
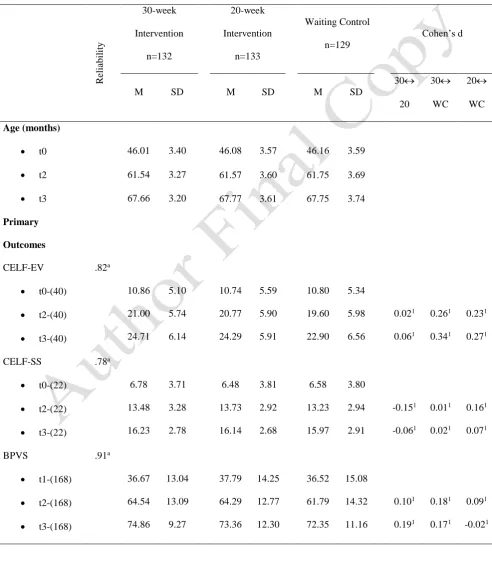
Descriptive statistics for all outcome measures at screening, pre-test, post-test
and delayed follow-up for the 30-week intervention, 20-week intervention and waiting
control groups are shown in Table 1. It is clear that the groups are approximately equated on
all measures at screening/pre-test (all ps>.273), as expected given allocation with
minimisation for age, gender and verbal composite scores. It is also clear that both the
20-week and 30-20-week interventions are associated with improvements on the majority of
language measures although effect sizes differ between measures (30-week intervention:
ds=.01-.46; 20-week intervention: ds=.08-.23).
-Table 1 about here-
All analyses were performed on an intention-to-treat basis. The majority of the
analyses were conducted in Stata 14.0 (Stata Corp, College Station, Texas, USA). Structural
equation models (SEM) were constructed using Mplus 7.4 (Muthen & Muthen, 1998-2015)
with Full Information Maximum Likelihood estimators to allow for missing data and robust
(Huber–White) standard errors to allow for the clustering of children within schools. Little’s
MCAR test confirmed that missing data for the language and literacy measures used in the
SEM models could be considered to be missing completely at random ( ²=22.12; df=17;
p=.181).
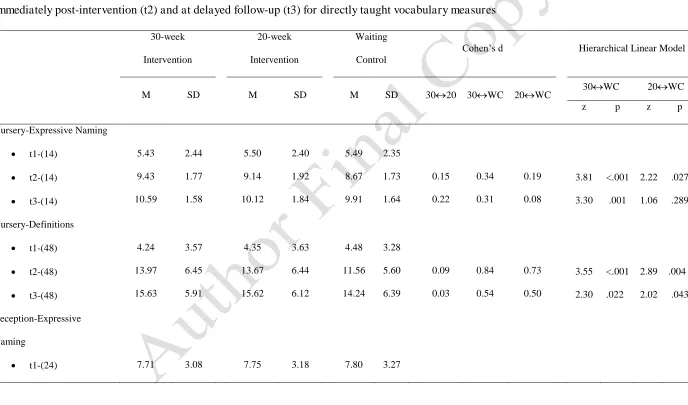
Effects of intervention on directly taught skills
Table 2 shows descriptive statistics for each group on taught vocabulary
measures and a summary of the effects of intervention. There were effects for both
intervention groups on taught vocabulary measures compared to the waiting control group
contrast, differences between the 30-week and 20-week intervention groups were very small
(post-test: ds=.04-.15; delayed follow-up: ds=.03-.22). Differences between groups on
directly taught vocabulary measures were assessed in hierarchical linear (ANCOVA) models
with initial level of performance on the same measure as covariate, and with varying
intercepts and fixed slopes across schools. These models account for the non-independence of
observations due to children being clustered within schools. To test the assumption of
homogeneity of regression slopes across groups the group x covariate interaction terms were
included in initial models but were dropped from the models reported since these effects were
not significant and of negligible magnitude. The absence of group by covariate interactions
justifies the use of the simpler models with parallel slopes.
-Table 2 about here-
Effects on primary outcomes (standardized and non-standardized measures of oral
language)
Our principal interest was to examine the extent to which the interventions
produced improvements on a broad language factor defined by our primary outcome
measures (i.e. standardized and non-standardized tests of language ability: CELF Expressive
Vocabulary, CELF Sentence Structure, BPVS, Listening Comprehension, APT Information
and Grammar scores). Such a measure assesses an underlying language factor that captures
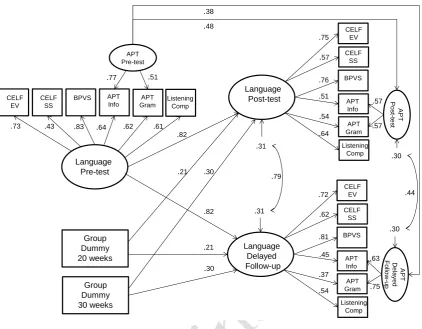
the common variance shared by the different language measures. The model used is shown in
Figure 3 and provides an excellent fit to the data ( 2 (145)=178.582, p=.030; RMSEA=.024
[90% CI .008-.035]; CFI=.890; TFI=.986). In this model variance in the pre-test, post-test
and delayed follow-up language scores is captured by six latent variables (Language Pre-test,
Language Post-test, Language Delayed Follow-up, APT Pre-test, APT Post-test, APT
Delayed Follow-up). The language pre-test, post-test and delayed follow-up factors reflect
account for variance that is shared by APT Information and Grammar scores but which is not
shared with the other language measures. The APT factors were included in the model to
improve fit since the APT measures shared significant variance with each other which was
not accounted for by the language latent variable (it is likely that the APT factor reflects
shared measurement variance since both scores come from the same test).
It is notable that the language factors show considerable longitudinal stability
and the APT factors moderate stability. In this model, the unstandardized regression weights
from the language pre-test to the two language post-test factors are fixed to be equal (a Wald
Test shows that this constraint results in no loss of fit in comparison to a model in which the
paths were freely estimated; 2 (1)=2.991, p=.084). Also, each pair of unstandardized
regression weights from each of the dummy codes (20-week interventionLanguage
Post-test; 20-week interventionLanguage Delayed Follow-up and 30-week intervention
Language Post-test; 30-week interventionLanguage Delayed Follow-up) were fixed to
be equal. These constraints provide a direct test of whether each of the intervention effects
differ in size between the immediate and delayed post-tests. Once again imposing these
constraints resulted in negligible changes in model fit (Wald Test: 2 (2)=0.628, p=.730)
confirming that the size of the intervention effects did not differ between the two testing
times.
-Figure 3 about here–
The most critical result from this analysis is that both the 20-week and
30-week intervention groups show a significantly greater increase in their scores on the language
post-test and delayed follow-up factors (controlling for pre-test scores) than the waiting
control group (d=.21 [95% CI .044-.366] and d=.30 [95% CI .130-.468] respectively). The
extent of improvement does not differ between the two intervention groups (Wald test: 2
between language pre-test and language post-test factor scores across groups. Analyses which
included the interaction terms between pre-test and group dummy codes confirmed that the
slopes for the intervention groups did not differ significantly from the slope for the waiting
control group at either post-test (20-week intervention: =.037, p=.236; 30-week
intervention: =.021, p=.520) or at delayed follow up (20-week intervention: =-.053,
p=.258; 30-week intervention: =-.071, p=.077).
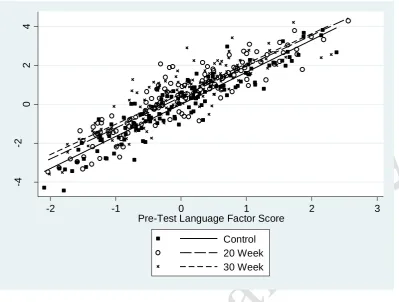
The clear absence of interactions between group and pre-test scores in these
analyses confirm that the slopes relating pre-test to post-test language scores do not differ
between groups. In other words, children with the most severe language difficulties at pre-test
respond to our intervention to the same degree as children with less severe difficulties. This
pattern is illustrated in Figure 4.
-Figure 4 about here–
It should also be noted that the model used here does not display factorial
invariance (unstandardized loadings on the language factor differ across different testing
times). This finding shows that the composition of the language factor varies over time
(possibly partly because the different language tests show different degrees of improvement
as a result of intervention). One implication of this is that we cannot make strong claims
about the intervention having effects on a unitary underlying language factor. Nevertheless,
the model gives an estimate of the size of change in language skills produced by our
interventions when language is assessed by a latent variable with high reliability.
Effects on secondary outcomes (early literacy and reading comprehension)
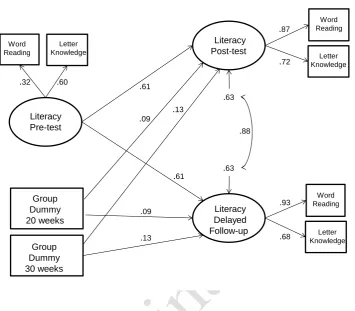
We also examined whether the intervention had any effects on early literacy
skills (i.e. letter-sound knowledge and word reading). Table 1 shows descriptive statistics for
the effects of the intervention on these measures. We constructed a latent variable model for
an excellent fit to the data ( 2 (15)=23.235, p=.079; RMSEA=.037 [90% CI .000-.066];
CFI=.989; TFI=.980). In this model variance in pre-test and post-test literacy scores is
captured by three latent variables (Literacy Pre-test, Literacy Post-test, Literacy Delayed
Follow-up). The literacy factor shows moderate longitudinal stability which is consistent with
the fact that this is a time of rapid changes in literacy skills, which were very low when first
assessed in nursery.
In this model, the unstandardized regression weights from the literacy pre-test
to the two literacy post-tests were fixed to be equal as this did not result in a significant loss
of fit (Wald Test: 2 (1)=1.001, p=.317). Furthermore, each pair of unstandardized regression
weights from each dummy code to the post-test and delayed follow-up factor were fixed to be
equal (20-week interventionLiteracy Post-test; 20-week interventionLiteracy Delayed
Post-test, and 30-week interventionLiteracy Post-test; 30-week interventionLiteracy
Delayed Follow-up). These constraints provide a direct test of whether each of the
intervention effects differ in size between immediate post-test and delayed follow-up. Once
again imposing these constraints resulted in negligible changes in model fit ( 2 (2)=1.837,
p=.399), confirming that the size of the intervention effects did not differ between the two
testing times.
The most critical result from this analysis is that, as expected from the means
in Table 2, neither the 20-week nor the 30-week intervention groups show a significantly
greater increase in their scores on the early literacy immediate post-test or delayed follow-up
factor (controlling for pre-test scores) than the waiting control group (d=.09 [95% CI
-.131-.317] and d=.13 [95% CI -.125-.387] respectively). Once again a model with interactions
between group dummy and Literacy Pre-test confirmed that a model where slopes are
factor does not show factorial invariance (unstandardized factor loadings vary across testing
times).
-Figure 5 about here-
In addition to word level reading and letter-sound knowledge, we assessed
intervention effects on reading comprehension when it was first administered at delayed
follow-up in a hierarchical linear model with children nested within schools (with varying
intercepts but fixed slopes across schools). Using baseline listening comprehension skill as
the covariate, there was no sign of a difference between the 20-week intervention and the
waiting control group (marginal mean group difference=.59, 95% CI -.29-1.49, z=1.30,
p=.193) or the 30-week intervention and the waiting control group (marginal mean group
difference=.37, 95% CI -.54-1.28; z=0.79, p=.427).
Discussion
This study evaluated the effectiveness of the Nuffield Early Language
Intervention in a field trial. A key aim was to assess the extent to which the programme is
effective when delivered without the extensive support used in our earlier research trial
(Fricke et al., 2013). A subsidiary aim was to evaluate whether the original 30-week
programme (10 weeks at the end of nursery in England (age 3-4) followed by 20 weeks in
first two terms of primary school, i.e. Reception in England (age 4-5)) differed appreciably
from simply delivering a 20-week programme starting in Reception. The overall pattern of
results is clear; both the 20- and 30-week programmes produce small improvements on
standardized tests of oral language skill immediately following the intervention and these
effects are maintained 6 months later. Although the size of improvements tended to be larger
for the 30-week programme, this difference was not statistically significant. In contrast to the
effects on oral language, we did not find evidence that the programmes reliably improved
The effects of the 30-week programme on oral language skills is broadly in
line with findings from Fricke et al. (2013) though the effects are smaller. The smaller effect
sizes likely reflect differences in treatment fidelity (many children in the current study
received less than the full “dose” of the programme) and differences in the quality of training
and ongoing support given to the TAs in this study compared to our earlier trial (Fricke et al.
2013). To put the size of these effects in context, according to the method of reporting
favoured by the Education Endowment Foundation (2016) the 30-week programme produced
gains in language skills equivalent to roughly 4 months additional progress and the 20-week
programme gains of roughly 2 months. For studies of educational interventions at least two
organizations (Promising Practices Network, 2007; What Works Clearing House, 2007) have
suggested that d=.25 should be seen as educationally important although it is also worth
noting that smaller effect sizes can in certain circumstances be considered to have high
practical importance (see Cooper, 2008).
It is encouraging that the intervention effects are maintained at delayed
follow-up, by which time some of the children in the waiting control group were receiving
some form of intervention, albeit of highly variable quality and quantity. It is hard to know
why some schools preferred not to be trained in the additional language and literacy support
that we offered for the waiting control group, or why some who accepted the training delayed
its implementation. However, it is encouraging to note that, immediately following the trial,
10 schools continued to use the Nuffield Early Language Intervention in nursery and/or
Reception and a further 9 schools intended to use it again.
We found no statistically significant difference between the 30-week and
20-week programmes. The preschool component of the programme, however, was of limited
duration (10hrs) and consisted only of group work with no individual sessions. Further work
The absence of intervention effects on early literacy skills replicates Fricke et
al. (2013). This likely reflects the fact that all children were receiving intensive systematic
phonics teaching in their schools. In addition, whereas Fricke et al. (2013) found significant
improvements in reading comprehension some six months after the end of the intervention,
this was not the case in the current study, most likely because the improvements in language
skills here are much smaller than those in the earlier study.
Conclusion
Oral language skills are critical to educational success (Roulstone et al., 2011)
and this study provides evidence that the benefits of the Nuffield Early Language Intervention
(Fricke et al., 2013) are reproducible when training is delivered by an independent
organisation, in ‘real world’ educational settings (cf. Savage, Carless, & Erten, 2009). Further
research is needed to evaluate whether a more intensive nursery-based language intervention
programme would be effective in boosting the language skills of preschool children (we
suspect it would). It would also be desirable for future studies to assess the longer term
effects of early language interventions and their potential cost effectiveness.
Key points
Oral language skills are critical to educational success.
Data from an RCT show that both a 30-week language intervention delivered in nursery
and Reception classes in England and a 20-week intervention delivered in Reception only
can improve oral language skills.
The intervention did not bring about reliable gains in early literacy or reading
comprehension skills.
The findings provide further evidence that oral language interventions can be delivered
Acknowledgements
The research was funded by a grant from the Education Endowment
Foundation (EEF). Funding for the development of the Nuffield Early Language Intervention
programme was provided by the Nuffield Foundation. We thank many colleagues for their
assistance with data collection, and the teaching assistants, schools, children and parents for
their participation.
Correspondence to
Silke Fricke, Department of Human Communication Sciences, 362 Mushroom
Lane, Sheffield, S10 2TS, UK, Tel: +44(0)114-2222419, Email: [email protected]
References
Altman, D.G. & Bland, J. M. (2005). Treatment allocation by minimization. British Medical
Journal, 330, 843. DOI: https://doi.org/10.1136/bmj.330.7495.843
Beck, I., & McKeown, M.G. (2007). Increasing young low-income children's oral vocabulary
repertoires through rich and focused instruction. The Elementary School Journal,
107(3), 251-271. DOI:10.1086/511706
Beck, I.L., McKeown, M.G., & Kucan, L. (2013). Bringing words to life: Robust vocabulary
instruction: Guilford Press.
Bianco, M., Bressoux, P., Doyen, A.L., Lambert, E., Lima, L., Pellenq, C., & Zorman, M.
(2010). Early training in oral comprehension and phonological skills: Results of a
three-year longitudinal study. Scientific Studies of Reading, 14(3), 211-246.
Bowyer-Crane, C., Snowling, M.J., Duff, F.J., Fieldsend, E., Carroll, J.M., Miles, J., Götz,
K., & Hulme, C. (2008). Improving early language and literacy skills: Differential
effects of an oral language versus a phonology with reading intervention. Journal of
Child Psychology and Psychiatry, 49, 422-432.
DOI:10.1111/j.1469-7610.2007.01849.x
Boyle, J., McCartney, E., O’Hare, A., & Law, J. (2010). Intervention for mixed receptive–
expressive language impairment: a review. Developmental Medicine & Child
Neurology, 52(11), 994-999. DOI:10.1111/j.1469-8749.2010.03750.x
Carroll, J. M., Bowyer-Crane, C., Duff, F. J., Hulme, C. J., & Snowling, M. J. (2011).
Developing Language and Literacy: Effective Intervention in the Early Years. Oxford:
Wiley-Blackwell
Clarke, P.J., Snowling, M.J., Truelove, E., & Hulme, C. (2010). Ameliorating children’s
reading comprehension difficulties: A randomized controlled trial. Psychological
Science, 21, 8, 1106-1116. DOI:10.1177/0956797610375449
Cirrin, F.M., & Gillam, R.B. (2008). Language intervention practices for school-age children
with spoken language disorders: A systematic review. Language, Speech, and
Hearing Services in Schools, 39(1), S110-S137. DOI:10.1044/0161-1461(2008/012)
Conti Ramsden, G., Durkin, K., Simkin, Z., & Knox, E. (2009). Specific language
impairment and school outcomes. I: Identifying and explaining variability at the end
of compulsory education. International Journal of Language & Communication
Cooper, H. (2008). The search for meaningful ways to express the effects of interventions.
Child Development Perspectives, 2, 181–186.
DOI:10.1111/j.1750-8606.2008.00063.x
DCSF. (2008). Statutory Framework for the Early Years Foundation Stage. Nottingham:
Department for Children, Schools and Families
DfES. (2006). Primary framework for literacy and mathematics. Norwich: Department for
Education and Skills.
DfES. (2007). Letters and Sounds: Principles and practice of high quality phonics. Norwich:
Department for Education and Skills.
Dunn, L.M., Dunn, D.M., & Styles, B. (2009). British Picture Vocabulary Scale: Third
Edition. GL Assessment.
Education Endowment Foundation. (2016). Nuffield Early Language Intervention: Evaluation
report and executive summary. Available from:
https://educationendowmentfoundation.org.uk/our-work/projects/nuffield-early-language-intervention
Elleman, A.M., Lindo, E.J., Morphy, P., & Compton, D.L. (2009). The impact of vocabulary
instruction on passage-level comprehension of school-age children: A meta-analysis.
Journal of Research on Educational Effectiveness, 2(1), 1-44.
DOI:10.1080/19345740802539200
Fricke, S., Bowyer-Crane, C., Haley, A., Hulme, C., & Snowling, M. (2013). Efficacy of
language intervention in the early years. Journal of Child Psychology and Psychiatry,
Hulme, C., Nash, H., Gooch, D., Lervåg, A., & Snowling., M. (2015). The foundations of
literacy development in children at familial risk of dyslexia. Psychological Science,
Early-View-Online. DOI:10.1177/0956797615603702
Hulme, C., Stothard, S.E., Clarke, P., Bowyer-Crane, C., Harrington, A., Truelove, E., &
Snowling, M.J. (2009). York assessment of reading for comprehension: Early
reading. London: GL Assessment.
Ioannidis, J. P. (2006). Evolution and translation of research findings: from bench to where.
PLOS Clinical Trials, 1(7), e36. DOI:10.1371/journal.pctr.0010036
Law, J., Garrett, Z., & Nye, C. (2004). The efficacy of treatment for children with
developmental speech and language delay/disorder a meta-analysis. Journal of
Speech, Language, and Hearing Research, 47(4), 924-943.
DOI:10.1044/1092-4388(2004/069)
Law, J., Roulstone, S., & Lindsay, G. (2015). Integrating external evidence of intervention
effectiveness with both practice and the parent perspective: development of 'What
Works' for speech, language, and communication needs. Developmental Medicine and
Child Neurology, 57(3), 223-228. DOI:10.1111/dmcn.12630
Locke, A. (2006). One Step at a Time. London: Network Continuum Education.
Lonigan, C.J., Shanahan, T., & Cunningham, A. (2008). Impact of shared-reading
interventions on young children’s early literacy skills. Developing early literacy:
Report of the National Early Literacy Panel, 153-171.
Mol, S.E., Bus, A.G., de Jong, M.T., & Smeets, D.J. (2008). Added value of dialogic parent–
child book readings: A meta-analysis. Early Education and Development, 19(1), 7-26.
Neuman, S.B., Newman, E.H., & Dwyer, J. (2011). Educational effects of a vocabulary
intervention on preschoolers' word knowledge and conceptual development: A
cluster randomized trial. Reading Research Quarterly, 46(3), 249-272.
DOI:10.1598/RRQ.46.3.3
NICHD Early Child Care Research Network (2005). Pathways to reading: The role of oral
language in the transition to reading. Developmental Psychology, 41(2), 428-442.
DOI:10.1037/0012-1649.41.2.428
Promising Practices Network. (2007). How programs are considered. Retrieved March 25,
2007, from http://www.promisingpractices. net/criteria.asp
Renfrew, C. (2003). Action Picture Test. Milton Keynes, England: Speechmark Publishing.
Roulstone, S., Law, J., Rush, R., Clegg, J., & Peters, T. (2011). Investigating the role of
language in children’s early educational outcomes (Project Report). Bristol: DfE.
Savage, R., Carless, S.U.E., & Erten, O. (2009). The longer-term effects of reading
interventions delivered by experienced teaching assistants. Support for Learning,
24(2), 95-100. DOI:10.1111/j.1467-9604.2009.01405.x
Schulz, K.F., Altman, D.G., & Moher, D. (2010). Consort 2010 statement: updated guidelines
for reporting parallel group randomised trials. British Medical Journal, 340, c332.
DOI:10.1136/bmj.c332
Semel, E., Wiig, E., & Secord, W. (2006). Child Evaluation of Language
Fundamentals-Preschool UK (2nd ed.). Oxford: Pearson Assessment.
Snowling, M., Adams, J., Bishop, D.V.M., & Stothard, S. (2001). Educational attainments of
Journal of Language & Communication Disorders, 36(2), 173-183. DOI:
10.1080/13682820120976
Snowling, M., Stothard, S., Clarke, P., Bowyer-Crane, C., Harrington, A., Truelove, E., ...&
Hulme, C. (2009). YARC York Assessment of Reading for Comprehension: Passage
Reading. London: GL Assessment.
What Works Clearinghouse. (2007). Review process: Standards. Retrieved February 26,
Figure 2: CONSORT diagram showing flow of participants through RCT study January-February 2013 (t0): N=1164 children
in 34 nursery schools screened for participation in intervention
March 2013: N=510 children (n=15/setting) selected for further testing (t1; March-April
2013)
n=28 unavailable for testing (absent or no parent/carer consent) n=482 children tested April 2013: N=408 children selected to take part
in the RCT (n=12/setting) Enrolment
N=394 randomized (n=9-12/setting)
Allocated to Intervention (N=265; n=132 to 30-week Intervention Group; n=133 to 20-week Intervention Group)
Received allocated intervention (N=258) Did not receive allocated intervention due
to moving schools before intervention started (30-week Intervention Group n=3; 20-week Intervention Group n=4)
Allocated to Waiting Control Group (N=129)
Allocation
Intervention Groups
Lost to follow-up due to moving schools or low attendance:
t2=18 (30-week Intervention Group n=13; 20-week Intervention Group n=5) t3=10 (30-week Intervention Group n=4; 20-week Intervention Group n=6) Lost to follow-up due to school
withdrawing consent for testing phase: t3=13 (30-week Intervention Group n=7; 20-week Intervention Group n=6)
Waiting Control Group
Lost to follow-up due to moving schools or low attendance:
t2=11 t3=7
Lost to follow-up due to school withdrawing consent for testing phase:
t3=6 Follow-up
Table 1
Mean raw scores (SD) for 30-week intervention, 20-week intervention and waiting control
groups for primary and secondary outcome measures at screening (t0), pre-intervention (t1),
immediately post-intervention (t2) and delayed follow-up (t3; with effect sizes for intervention
effects). R eliab ilit y 30-week Intervention n=132 20-week Intervention n=133 Waiting Control n=129
Cohen’s d
M SD M SD M SD
30 20 30 WC 20 WC Age (months)
t0 46.01 3.40 46.08 3.57 46.16 3.59
t2 61.54 3.27 61.57 3.60 61.75 3.69
t3 67.66 3.20 67.77 3.61 67.75 3.74
APT information t1-(40) t2-(40) t3-(40) .83b 20.70 28.08 29.93 6.38 4.66 4.23 20.02 28.24 29.85 6.08 4.58 4.15 20.44 27.60 29.15 6.00 4.74 4.52 -0.141 -0.101 0.041 0.081 0.181 0.191 APT grammar t1-(38) t2-(38) t3-(38) .89b 14.33 22.70 25.83 6.31 4.72 3.87 13.53 22.05 24.92 5.96 5.23 4.55 13.89 21.31 24.00 5.59 4.99 4.79 -0.031 0.021 0.161 0.231 0.191 0.221 Listening comprehension t1-(16) t2-(16) t3-(16) .99b 1.19 5.02 6.62 1.51 2.55 2.96 1.44 4.86 6.42 1.79 2.87 3.07 1.39 4.55 6.25 1.43 2.51 2.47 0.251 0.271 0.461 0.391 0.151 0.071 Secondary Outcomes YARC-Letter Knowledge t1-(17) t2-(32) t3-(32) .95a 1.60 27.12 29.65 2.71 3.86 2.55 2.14 26.87 29.41 2.96 5.66 3.47 1.79 26.57 29.12 2.58 5.49 3.90 0.261 0.271 0.281 0.271 0.001 -0.021 YARC-Early Word Reading t1-(30) t2-(30) t3-(30) .98a 0.34 8.90 16.20 2.10 5.99 7.98 0.12 9.94 16.27 0.86 7.14 8.53 0.09 8.87 14.72 0.80 6.74 7.63 -0.172 -0.012 0.002 0.192 0.172 0.192 YARC-Reading Comprehension t3-(16) .77a
6.34 3.42 6.84 3.44 6.28 2.94 -0.152 0.022 0.182
Reliability: aCronbach’s alpha; bInterrater reliability
Table 2
Mean raw scores (SD) and intervention effects for 30-week intervention, 20-week intervention and waiting control groups pre-intervention (t1),
immediately post-intervention (t2) and at delayed follow-up (t3) for directly taught vocabulary measures
30-week Intervention 20-week Intervention Waiting Control
Cohen’s d Hierarchical Linear Model
M SD M SD M SD 3020 30WC 20WC 30WC 20WC
z p z p
Nursery-Expressive Naming t1-(14) t2-(14) t3-(14) 5.43 9.43 10.59 2.44 1.77 1.58 5.50 9.14 10.12 2.40 1.92 1.84 5.49 8.67 9.91 2.35 1.73 1.64 0.15 0.22 0.34 0.31 0.19 0.08 3.81 3.30 <.001 .001 2.22 1.06 .027 .289 Nursery-Definitions t1-(48) t2-(48) t3-(48) 4.24 13.97 15.63 3.57 6.45 5.91 4.35 13.67 15.62 3.63 6.44 6.12 4.48 11.56 14.24 3.28 5.60 6.39 0.09 0.03 0.84 0.54 0.73 0.50 3.55 2.30 <.001 .022 2.89 2.02 .004 .043 Reception-Expressive Naming
t1-(24) 7.71 3.08 7.75 3.18 7.80 3.27
t2-(24) t3-(24) 14.83 15.52 3.08 2.76 14.74 15.46 3.37 2.82 11.52 13.52 2.84 3.02 0.03 0.03 1.07 0.66 1.03 0.62 10.24 6.35 <.001 <.001 9.80 5.93 <.001 <.001 Reception-Definitions t1-(54) t2-(54) t3-(54) 4.03 13.43 16.00 3.46 6.50 5.20 4.17 13.35 15.55 3.59 6.80 5.91 4.12 11.68 14.38 3.74 5.86 5.56 0.06 0.17 0.51 0.47 0.44 0.31 2.67 2.78 .008 .005 2.05 1.75 .040 .080
Figure 3: Modelshowing the effects of the interventions on language skills at immediate
post-test and delayed follow-up. Standardized coefficients shown (except for dummy variables
where y-standardized values are shown). Robust (Huber-White cluster estimators) standard
errors are shown which do not differ appreciably from simple standard errors. A number of
covariances between the same measures at adjacent time points were significant and
included in the model, but not shown in the diagram. Note. CELF=Clinical Evaluation of
Language Fundamentals, EV=Expressive vocabulary, SS=Sentence structure, BPVS=British
Picture Vocabulary Scale, APT=Action picture test, Info=Information, Gram=Grammar,
Comp=Comprehension. Language Pre-test Group Dummy 20 weeks
.73 .43 .83 .62 CELF EV CELF SS BPVS APT Info APT Gram .64 APT Pre-test
.77 .51
Listening Comp .61 Group Dummy 30 weeks Language Delayed Follow-up CELF SS BPVS CELF EV APT Gram APT
Info De APT
Figure 4: Scatterplot showing the relationship between the outcome variable (post-test
language factor score) and the covariate (pre-test language factor score) for the 30- and
20-week intervention and the waiting control groups.
-4
-2
0
2
4
-2 -1 0 1 2 3
Pre-Test Language Factor Score
Figure 5: Modelshowing the effects of the interventions on literacy skills at immediate
post-test and delayed follow-up. Standardized coefficients shown (except for dummy variables
where y-standardized values are shown). Robust (Huber-White cluster estimators) standard
errors are shown which do not differ appreciably from simple standard errors. Some
covariances between the same measures at adjacent time points were significant and
included in the model, but not shown in the diagram.
Literacy Pre-test
Group Dummy 20 weeks
.60 .32
Word Reading
Letter Knowledge
Group Dummy 30 weeks
Literacy Delayed Follow-up
Literacy Post-test
.61
.61 .13
.13 .09
.09
.87
.93
.68
Word Reading
Letter Knowledge
Word Reading
Letter Knowledge .72
.88 .63
Online Appendix A
Table A1
Group and individual session schedule for Nuffield Early Language Intervention programme in Nursery and Reception
Nursery (10 weeks) Reception Part 1 (10 weeks) Reception Part 2 (10 weeks)
Group session (20 mins) Group session (25 mins + 5 mins to
spend flexibly)
Individual session (15 mins) Group session (25 mins + 5 mins
to spend flexibly)
Individual session (15 mins)
Introduction (2 mins) Introduction incl. Listening Game (3
mins)
Introduction (2 mins) Introduction (2 mins) Introduction (2 min)
Active Listening Game (3 mins) Letter sounds and phonological
awareness (3 mins)
Letter sounds and phonological
awareness (4 mins)
Vocabulary Teaching (6 mins) Vocabulary Revision (5 mins) Vocabulary Revision (5 mins) Vocabulary Revision (4 mins) Vocabulary Revision (4 mins)
Vocabulary Teaching (5 mins) Vocabulary Teaching (5 mins)
Narrative Work (6 mins) Narrative (10 mins) Narrative (5 mins) Narrative (9 mins) Narrative (4 mins)
Online Appendix B
Table B1
CONSORT checklist
Section/Topic
Item
No Checklist item
Reported
on page No
Title and abstract
1a Identification as a randomised trial in the title 1
1b Structured summary of trial design, methods, results, and conclusions (for specific guidance see CONSORT for abstracts) 3-4
Introduction
Background and
objectives
2a Scientific background and explanation of rationale 5-7
2b Specific objectives or hypotheses 7
Methods
Trial design 3a Description of trial design (such as parallel, factorial) including allocation ratio 7-9
3b Important changes to methods after trial commencement (such as eligibility criteria), with reasons N/A
Participants 4a Eligibility criteria for participants 9-10
Interventions 5 The interventions for each group with sufficient details to allow replication, including how and when they were
actually administered
12-14, 29, 39
7 6a Completely defined pre-specified primary and secondary outcome measures, including how and when they
were assessed
11-12
6b Any changes to trial outcomes after the trial commenced, with reasons N/A
Sample size 7a How sample size was determined 9
7b When applicable, explanation of any interim analyses and stopping guidelines N/A
Randomisation:
Sequence
generation
8a Method used to generate the random allocation sequence 10
8b Type of randomisation; details of any restriction (such as blocking and block size) 10
Allocation
concealment
mechanism
9 Mechanism used to implement the random allocation sequence (such as sequentially numbered containers),
describing any steps taken to conceal the sequence until interventions were assigned
10
Implementation 10 Who generated the random allocation sequence, who enrolled participants, and who assigned participants to
interventions
10
Blinding 11a If done, who was blinded after assignment to interventions (for example, participants, care providers, those
assessing outcomes) and how
11b If relevant, description of the similarity of interventions 6-7, 12-14
Statistical methods 12a Statistical methods used to compare groups for primary and secondary outcomes 14, 15, 16, 18
12b Methods for additional analyses, such as subgroup analyses and adjusted analyses N/A
Results
Participant flow (a
diagram is
strongly
recommended)
13a For each group, the numbers of participants who were randomly assigned, received intended treatment, and
were analysed for the primary outcome
30
13b For each group, losses and exclusions after randomisation, together with reasons 30
Recruitment 14a Dates defining the periods of recruitment and follow-up 29, 30
14b Why the trial ended or was stopped N/A
Baseline data 15 A table showing baseline demographic and clinical characteristics for each group 31-32
Numbers analysed 16 For each group, number of participants (denominator) included in each analysis and whether the analysis was
by original assigned groups
15
Outcomes and
estimation
17a For each primary and secondary outcome, results for each group, and the estimated effect size and its precision
(such as 95% confidence interval)
14-20, 31-32,
34-35, 36, 38
17b For binary outcomes, presentation of both absolute and relative effect sizes is recommended N/A
specified from exploratory
Harms 19 All important harms or unintended effects in each group (for specific guidance see CONSORT for harms) N/A
Discussion
Limitations 20 Trial limitations, addressing sources of potential bias, imprecision, and, if relevant, multiplicity of analyses 20-22
Generalisability 21 Generalisability (external validity, applicability) of the trial findings 20-22
Interpretation 22 Interpretation consistent with results, balancing benefits and harms, and considering other relevant evidence 20-22
Other information
Registration 23 Registration number and name of trial registry N/A
Protocol 24 Where the full trial protocol can be accessed, if available N/A