Theme
Population and social conditions
eurostat
OFICINA ESTADÍSTICA DE LAS COMUNIDADES EUROPEAS
DE EUROPÆISKE FÆLLESSKABERS STATISTISKE KONTOR
STATISTISCHES AMT DER EUROPÄISCHEN GEMEINSCHAFTEN
ΣΤΑΤΙΣΤΙΚΗ ΥΠΗΡΕΣΙΑ ΤΩΝ ΕΥΡΩΠΑΪΚΩΝ ΚΟΙΝΟΤΗΤΩΝ
STATISTICAL OFFICE OF THE EUROPEAN COMMUNITIES
OFFICE STATISTIQUE DES COMMUNAUTÉS EUROPÉENNES
ISTITUTO STATISTICO DELLE COMUNITÀ EUROPEE
BUREAU VOOR DE STATISTIEK DER EUROPESE GEMEENSCHAPPEN
SERVIÇO DE ESTATÍSTICA DAS COMUNIDADES EUROPEIAS
L-2920 Luxembourg - Tél. 43 01-1 - Télex COMEUR LU 3423
B-1049 Bruxelles, rue de la Loi 200 - Tél. 299 11 11
Las publicaciones de Eurostat están clasificadas por temas y por series. La clasificación se encuentra al final de
la obra. Para mayor información sobre las publicaciones, rogamos se pongan en contacto con Eurostat.
Para los pedidos, diríjanse a las oficinas de venta cuyas direcciones figuran en la página interior de la
contracubierta.
Eurostats publikationer er klassificeret efter emne og serie. En oversigt herover findes bag i hæftet. Yderligere
oplysninger om publikationerne kan fås ved henvendelse til Eurostat.
Bestilling kan afgives til de salgssteder, der er anført på omslagets side 3.
Die Veröffentlichungen von Eurostat sind nach Themenkreisen und Reihen gegliedert. Die Gliederung ist hinten in
jedem Band aufgeführt. Genauere Auskünfte über die Veröffentlichungen erteilt Eurostat.
Ihre Bestellungen richten Sie bitte an die Verkaufsbüros, deren Anschriften jeweils auf der dritten Umschlagseite
der Veröffentlichungen zu finden sind.
Οι εκδόσεις της Eurostat ταξινομούνται κατά θέμα και κατά σειρά. Η ακριβής ταξινόμηση αναφέρεται στο
τέλος κάθε έκδοσης. Για λεπτομερέστερες πληροφορίες σχετικά με τις εκδόσεις, μπορείτε να
απευθύ-νεσθε στην Eurostat.
Για τις παραγγελίες μπορείτε να απευθύνεσθε στα γραφεία πώλησης, των οποίων οι διευθύνσεις
αναγράφονται στη σελίδα 3 του εξωφύλλου.
Eurostat's publications are classified according to themes and series. This classification is indicated at the end of
the publication. For more detailed information on publications, contact Eurostat.
Orders are obtainable from the sales offices mentioned on the inside back cover.
Les publications d'Eurostat sont
classées par thème et par série. Cette classification est précisée à la fin
de l'ouvrage. Pour des informations plus détaillées sur les publications, contactez Eurostat.
Pour les commandes, adressez-vous aux bureaux de vente dont les adresses sont indiquées à la page 3
de la couverture.
Le pubblicazioni dell'Eurostat sono classificate per tema e per serie. Tale classificazione è precisata alla fine
dell'opera. Per informazioni più dettagliate sulle pubblicazioni rivolgersi all'Eurostat.
Per eventuali ordinazioni rivolgersi a uno degli uffici di vendita i cui indirizzi figurano nella 3
apagina della
copertina.
De publikaties van Eurostat zijn ingedeeld naar onderwerp en serie. Deze indeling is achter in het boek
opgenomen. Voor nadere informatie over de publikaties kunt u sich wenden tot Eurostat.
Gelieve bestellingen op te geven bij de verkoopbureaus, waarvan de adressen op bladzijde 3 van de omslag zijn
vermeld.
As publicações do Eurostat estão classificadas por tema e por série. Esta classificação está indicada no firn da
obra. Para mais informações sobre as publicações é favor contactar Eurostat.
DEMOGRAPHIC STATISTICS 1994
Theme
Population and social conditions
Cataloguing data can be found at the end of this publication
Luxembourg: Office for Official Publications of the European Communities, 1994
ISBN 92-826-8116-5
© ECSC-EC-EAEC, Brussels · Luxembourg, 1994
Reproduction is authorized, except for commercial purposes, provided the
source is acknowledged
TABLE OF CONTENTS
INTRODUCTION
IX
POPULATION OF THE EUROPEAN COMMUNITY
X
EXPLANATORY NOTES
XII
A
-
POPULATION CHANGE
Tables:
A-1:
A-2
A-3
A-4
A-5
Graphs:
A-1:
A-2
A-3
A-4
Population change of EUR 12
3
Rate of natural increase (per 1000 average population)
5
Net migration (per 1000 average population)
5
Population increase (per 1000 average population)
5
Population change in 1992
6
Natural growth (per 1000 inhabitants)
2
Natural growth rate -1992
4
Net migration -1992
4
Population increase -1992
4
Β
-
POPULATION STRUCTURE
Tables:
B-1 :
Total population on 1 January (1000)
9
B-2:
Population by age on 1 January 1992 - Total (1000)
10
B-3:
Population by age on 1 January 1992 - Males (1000)
13
B-4:
Population by age on 1 January 1992 - Females (1000)
16
B-5:
Population by age on 1 January 1993-Total (1000)
19
B-6:
Population by age on 1 January 1993 - Males (1000)
22
B-7:
Population by age on 1 January 1993 - Females (1000)
25
B-8:
Sex ratio by age group -1.1.1992
28
B-9:
Population by age group on 1 January 1992 - Total (1000)
42
B-10:
Population by age group on 1 January 1992 - Males (1000)
42
B-11 :
Population by age group on 1 January 1992 - Females (1000)
42
B-12:
Population by age group on 1 January 1992 - Total (%)
43
B-13:
Population by age group on 1 January 1992 - Males (%)
43
B-14:
Population by age group on 1 January 1992 - Females (%)
43
B-15:
Population by age group on 1 January 1993 - Total (1000)
44
B-16:
Population by age group on 1 January 1993 - Males (1000)
44
B-17:
Population by age group on 1 January 1993 - Females (1000)
44
B-18:
Population by age group on 1 January 1993 - Total (%)
45
B-19:
Population by age group on 1 January 1993 - Males (%)
45
B-20:
Population by age group on 1 January 1993 - Females (%)
45
B-21 :
Total population - Annual average (1000)
47
B-22:
Male population - Annual average (1000)
48
B-23:
Female population - Annual average (1000)
49
B-24:
Male population by age group - Annual average 1991 (1000)
50
B-25:
Female population by age group - Annual average 1991 (1000)
50
B-26:
Male population by age group - Annual average 1992 (1000)
51
B-27:
Female population by age group - Annual average 1992 (1000)
51
Graphs:
B-1 :
Annual growth rate - EUR 12
8
B-2:
Age pyramid-EUR 12-1.1.1993
29
B-3:
Age pyramid - Belgique/België -1.1.1993
30
B-4:
Age pyramid - Danmark-1.1.1993
31
B-5:
Age pyramid - Bundesrepublik Deutschland -1.1.1993
32
B-6:
Age pyramid - Ellas -1.1.1993
33
B-7
B-8
B-9
B-10
B-11
B-12
B-13
B-14
B-15
Age pyramid - Espana-1.1.1993 34
Age pyramid - France -1.1.1993 35
Age pyramid- Ireland-1.1.1993 36
Age pyramid- Italia-1.1.1993 37
Age pyramid - Luxembourg -1.1.1993 38
Age pyramid - Nederland -1.1.1993 39
Age pyramid - Portugal -1.1.1993 40
Age pyramid - United Kingdom-1.1.1992 41
Evolution of sex ratio (Males per 100 females) - EUR 12 46
C
-
THE EUROPEAN COMMUNITY AND ITS REGIONS
The Community and its regions -1990
Table:
C-1:
Graphs:
C-1:
C-2
C-3
C-4
C-5
Density of population -1991
Natural increase per 1000 population -1991 . . .
Total increase rate -1991
% of population aged less than 15 years -1991 .
% of population aged more than 65 years -1991
60
55
56
57
58
59
D
-
THE EUROPEAN COMMUNITY IN THE WORLD
Tables:
D-1:
D-2
D-3
D-4
Graphs:
D-1:
D-2
D-3
Population of the Major regions of the world, 1950 - 2020 75
Main demographic indicators 1992 75
The Community in Europe (1992) 76
Demographic situation in the Mediterranean countries (1992) 82
World population 74
Total fertility rate (children per woman) -1992 80
Infant mortality rate -1992
81
E
-
FERTILITY
Tables:
E-1:
E-2
E-3
E-4
E-5
E-6
E-7
E-8
E-9
E-10
E-11
E-12
E-13
E-14
E-15
E-16
Graphs:
E-1:
Fertility - EUR 12 87
Live births 88
Live births outside marriage 88
Live births outside marriage per 1000 live births 88
Live births by parity 89
Births by age of the mother (last common year -1989) 92
Births by age of the mother -1992 93
Fertility rates by age (last common year -1989) 96
Fertility rates by age group -1992 97
Total fertility rate 99
Gross reproduction rate 99
Net reproduction rate 99
Mean age of women at childbearing 100
Completed fertility 100
Declared legal abortions 101
Declared legal abortions (as a % of live births) 101
Total fertility rate - EUR 12 86
Average female population in chilbearing periode - EUR12 86
Number of live births 86
E-4
E-5
E-6
Fertility rates by ages (age on 31 December) , . . . . 94
Fertility rates at certain ages -EUR 12 98
Abortions per 100 live births
102
F
-
MARRIAGE AND DIVORCE
Tables:
F-1:
F-2
F-3
F-4
F-5
F-6
F-7
F-8
F-9
F-10
F-11
F-12
F-13
F-14
F-15
F-16
F-17
F-18
F-19
F-20
F-21
F-22
F-23:
F-24
F-25
F-26
F-27
F-28
F-29
F-30
F-31
Graphs:
F-1:
F-2
F-3
Marriage and divorce -EUR12 105
Number of marriages 106
Gross marriage rate (1000) 106
Mean age at first marriage - Males 107
Mean age at first marriage - Females 107
First marriages - Males 108
First marriages - Females 108
First marriages - Males (% of total of marriages) 109
First marriages - Females (% of total of marriages) 109
Marriages of widowers 110
Marriages of widows 110
Marriages of widowers (% of total of marriages)
111
Marriages of widows (% of total of marriages)
111
Marriages of divorced males 112
Marriages of divorced females 112
Marriages of divorced males (% of total of marriages) 113
Marriages of divorced females (% of total of marriages) 113
First marriage by age - males -1991
114
First marriage by age - females -1991
115
First marriage by age - males -1992 116
First marriage by age - females -1992 117
Age-specific first marriage rates - males -1991(1000) 120
Age-specific first marriage rates - females -1991 121
Age-specific first marriage rates - males -1992 122
Age-specific first marriage rates - females -1992 123
Cumulated first marriages frequency - males 125
Cumulated first marriages frequency - females 125
Ultimate proportion of first married males 126
Ultimate proportion of first married females 126
Number of divorces 127
Number of divorces per 1000 population 127
First marriages by age - EUR 12 (1991 ) 104
Age-specific marriage rates by age and sex 118
Cumulated first marriages frequency 124
G
-
MORTALITY
Tables:
G
G
G
G-G
G
G
G-8
G-9
G-10:
Mortality - EUR 12 131
Number of deaths-Total 132
Number of deaths - Males 132
Number of deaths - Females 132
Deaths by age - Males - last common year 1991 133
Deaths by age - Females - last common year 1991 136
Deaths by age in 1992 - Males 139
Deaths by age in 1992 - Females 142
Probabilities of dying of males by age - last common year 1991
(per 10000 inhabitants of each age) 151
Probabilities of dying of females by age - last common year 1991
G-11 : Probabilities of dying of males by age -1992 (per 10000 inhabitants of each age) 155
G-12: Probabilities of dying of females by age -1992 (per inhabitants of each age) 157
G-13: Infant deaths under one year 159
G-14: Infant deaths under 28 days 159
G-15: Infant deaths under 7 days 159
G-16: Deaths under one year per 1000 live births 161
G-17: Deaths under 28 days per 1000 live births 161
G-18: Deaths under 7 days per 1000 live births 161
G-19: Still births 162
G-20: Still births per 1000 live births + still births 162
G-21 : Perinatal mortality rate 162
G-22: Expectation of life at certain ages - males 164
G-23: Expectation of life at certain ages - females 167
G-24: Causes of death - males 170
G-25: Causes of death - females 170
Graphs:
G-1 : Probability of dying - EUR 12-1991 130
G-2: Excess male mortality by age - EUR 12-1991 130
G-3: Probabilities of dying by sex and age (log-linear scale) 145
G-4: Infant mortality 160
G-5: Life expectancy at birth - EUR 12 163
G-6: Life expectancy at birth -1992 163
H
-
POPULATION BY CITIZENSHIP
Tables:
H-1 : Population by citizenship on 1 January 1992 - Total 176
H-2: Population by citizenship on 1 January 1992 - Males 178
H-3: Population by citizenship on 1 January 1992 - Females 180
H-4: EC citizens living in another EC country by age group on 1 January 1992 - Total 182
H-5: Non EC citizens living in a EC country by age group on 1 January 1992 - Total 182
H-6: EC citizens living in another EC country by age group on 1 January 1992 - Males 183
H-7: Non EC citizens living in a EC country by age group on 1 January 1992 - Males 183
H-8: EC citizens living in another EC country by age group on 1 January 1992 - Females 184
H-9: Non EC citizens living in a EC country by age group on 1 January 1992 - Females 184
Graphs:
H-1 : Population by Member State -1992 185
H-1 : Population by main group of citizenship - EUR12 -1992 185
I
-
POPULATION PROJECTION
Tables:
1-1:
I-2
I-3
I-4
I-5
I-6
Pro
Pro
Pro
Proj
Pro
ection of population - Total -1995 (1000) - 189
ection of population - Total - 2000 (1000) 189
ection of population - Total - 2005 (1000) 190
ection of population-Total-2010 (1000) 190
ection of population-Total-2015 (1000) 191
Projection of population - Total - 2020 (1000) 191
J
-
EUROPEAN ECONOMIC AREA
Tables:
J-1:
J-2
J-3
J-4
J-5
VI
Population on 1 January 195
Births 195
Deaths 195
Natural increase 196
J-6: Total increase 196
J-7 Natural increase rate 197
J-8: Net migration per 1000 mean population 197
J-9: Total increase per 1000 mean population 197
J-10: Population by age on 1 January 1991 - Total 198
J-11 : Population by age on 1 January 1991 - Males 208
J-12: Population by age on 1 January 1991 - Females 211
J-13 Total fertility rates 216
J-14 Live births outside marriage 216
J-15 Live births outside marriage per 1000 live births 216
J-16 Marriages 217
J-17 Gross marriage rate 217
J-18 Divorces 219
J-19 Gross divorce rate 219
J-20 Infant deaths under one year 223
J-21 Infant mortality rate 223
J-22 Still births 224
J-23 Late foetal mortality rate 224
Graphs:
J-1 : Age pyramid - EEA 1.1.1993 201
J-2: Age pyramid - Austria 1.1.1993 202
J-3: Age pyramid - Finland 1.1.1993 203
J-4: Age pyramid - Iceland 1.1.1993 204
J-5: Age pyramid - Norway 1.1.1993 205
J-6: Age pyramid - Sweden 1.1.1993 206
J-7: Age pyramid - Switzerland 1.1.1993 207
J-8: Fertility rates by age (age on 31 December) 214
J-9: Total fertility rate 215
J-10: Age-specific marriage rates by age and sex 218
J-11 Probabilities of dying by age (log-linear scale) 220
REPORTS ON THE DEMOGRAPHIC SITUATION OF THE COUNTRIES
225
Introduction
The "Demographic Statistics 1994
" yearbook
presents the most important population data on each
topic for the Community and the Member States,
allowing a direct country-to-country comparison to be
made for each phenomenon or indicator. There are
numerous graphs to illustrate the figures, the most recent
of which are for 1992. A short description of demographic
situation of each country in 1992 can be found at the end
of this volume.
All tables of the 1994 edition are based on the territorial
status of the Federal Republic of Germany as from 3
rdOctober 1990. The summations and estimations for the
Community have consequently been revised.
A special chapter has been included for the European
Economic Area. It presents data for the countries of the
European Free Trade Association.
The statistics on civil status (births, deaths, marriages,
etc.) contained in this volume pertain to events which
actually occurred during the year in question and not to
those which were recorded during the year. The
refer-ence is to the date on which event took place.
territory. Events which concern nationals but occur
outside a country's territory are not included in the
natio-nal statistics.
In order to ensure comparability between the Community
countries, Eurostat uses a software system called
SYSCODEM. This system, which the Institut National
d'Etudes démographiques in Paris kindly made
availa-ble to Eurostat, makes it possiavaila-ble to calculate different
demographic indicators using a common method.
The tables for the Community and the countries of the
European Free Trade Association. Countries have been
based on figures provided directly by the national
stati-stical services, whilst the data for non-Community
countries have been taken from national or international
publications. Figures have not generally been rounded
except where it has been national practice to do or where
estimates relate to the Community as a whole.
Eurostat would like to thank the national statistical
services for their active and effective cooperation which
has helped to make this project a success.
The population statistics and those on civil status cover
both nationals and foreigners normally resident in the
Luxembourg, April 1994
THE POPULATION OF THE EUROPEAN COMMUNITY
The population of the European Union as at 1
January 1993 was 347.3 million, 1.6 million more
than on the same date the year before. At 0.4%, the
annual growth rate has been more or less constant
since 1990.
Net migration main factor behind growth
The reasons for the growth in the EU population were
similar to those in previous years: net migration
accounted for 2/3 of the total increase, whereas
natural increase (0.5 million: 3.95 million births less 3.45
million deaths) was the lowest since 1960. The decline
in the natural increase was due entirely to a big fall in the
number of births, since there were also slightly fewer
deaths in 1992 than in the three previous years.
in 1990, reaching a post-war low of 1.48 children per
woman. The main cause was the continuing fall which
has been recorded in Germany since unification
(Germany accounts for 20% of all births in the EU) and
declines in southern Member States (Greece, Spain,
Italy).
Fertility rates among women in the 20-25 age group
continued to fall. Although there was some increase in
fertility among women over thirty, it was not sufficient to
offset declining fertility among younger women.
Although overall fertility is decreasing, more children are
being born outside of marriage. One-fifth of all children
born in the EU in 1992 were conceived out of wedlock,
compared with one-tenth in 1980.
Marriage rate still low
81 persons over the age of sixty to every 100
under the age of twenty
As at 1 January 1992, 24.7% of the EU population were
under twenty, and 20.1% were over sixty. 3.5% of the
population were over eighty, more than 2/3 of them
women.
The ratio of over-sixties to under-twenties (the "ageing
index") was 0.81 in 1992 compared with 0.63 in 1980.
Fewer than 4 million births in 1992
The number of births in the European Union fell below 4
million for the first time since 1960. There were 56 500
fewer births in 1992 than in 1991, although this figure
should be increased by 11 000 (the approximate average
nu mber of births in one day) to allow for the fact that 1992
was a leap year.
As the number of women of child-bearing age remained
stable, the trends in birth rate and fertility ran parallel.
The fertility indicator continued the decline which began
1 884 900 marriages took place in the EU in 1992, 73
700 fewer than in 1991. The gross marriage rate in 1992
was 5.40/00. The number of divorces fell by 1
%
between
1990 and 1991.
Life expectancy continues to increase
3 452 400 people died in the EU in 1992. Given that the
population is ageing, this 1.4% decline on the figure for
1991 means that life expectancy at birth is increasing.
In 1991, life expectancy at birth was 72.9 years for men
and 79.5 years for women. The 6.6-year difference
between the sexes was the same as the previous year.
The difference is greatest in the 20-25 age group, in
which men are 3 1/2 ti mes more likely to die than women.
The infant mortality rate continued to fall. In 1992, 7 out
of every 1 000 children died before reaching the age of
one. The decline in infant mortality over the last decade
is due mainly to successes in reducing the number of
deaths among children in their first week (the time at
which about half of all deaths among children under the
age of one year occur).
AGE PYRAMID - EUR 1 2 1.1.1993
m
eurostal
YEAR OF BIRTH
AGE
YEAR OF BIRTH
1.2
1.0
0,8
0,6
0,4
0,2
0,0 0,0 0,2 0,4 0,6 0,8 1,0 1,2
%
of total population
Main demographic indicators for the European Community -1992
BELGIUM DENMARK GERMANY GREECE SPAIN FRANCE IRELAND ITALY
LUXEMBOURG NETHERLANDS PORTUGAL UNITED KINGDOM
EUR12
P o p u l a t i o n at 1.1.1993
( 1 0 0 0 )
10 068.3 5 180.6 80 974.6 10 346.4 39 114.2 57 529.6 3 560.0 56 960.3 395.2 15 239.2 9 859.6 58 088.0
347 316.0
N a t u r a l i n c r e a s e
( 1 0 0 0 )
21.3 6.9 -76.4 5.9 48.9 222.0 20.6 19.3 1.1 66.8 13.9
(1) 146.8
497.3
Net m i g r a t i o n
( 1 0 0 0 )
25.9 11.5 788.0 60.1
9.4 * 90.0
-6.0 172.9 4.3 58.1 -10.0 -11.1
1 193.0
Total i n c r e a s e
( 1 0 0 0 )
46.3 18.5 700.1 66.6 58.3 312.0 16.5 203.1 5.4 110.0 4.3 188.4
1 729.3
G r o s s m a r r i a g e
rate (per 1 0 0 0 i n h a b i t a n t s )
5.8 6.2 5.6 4.7 5.5 <1>
4.7 4.5 "» 5.3 6.4 6.2 7.1 6.1 <2'
5.4 *
Total fertility
rate
1.56 <" 1.76 1.30 1.39 1.23 <" 1.73 "» 2.03 1.25 "1 1.64 1.59 1.55 1.79
1.48
Infant mortality
rate ( p e r 1 0 0 0 hvo births)
8.2 6.6 6.2 8.4 7.2 <2>
6.8 6.7 8.3 <" 8.5 6.3 9.3 6.6
7.0 *
Live e x p e c t a n c y at b i r t h
M a l e s
73.1 72.6 72.6 74.6 73.3 (2>
73.2 72.6 73.6 <21
71.9 74.3 70.7 73.6
72.9 <2>
F e m a l e s
79.8 77.9 79.1 79.8 80.5 « 81.5 78.2 80.3 (2)
78.5 80.3 78.1 79.0
79.5 «
(1) Provisional data
(2) 1991
EXPLANATORY NOTES
GENERAL
The data published are not fully standardized, owing to
the lack of uniform definitions for the events registered,
orto the way in which the events referred to are recorded
or the registration records are processed, as is the case
with birth orders, or to the classification by age, which
may differ from one country to another or from one
category of events to another.
The registration statistics published in this Yearbook are
supplied by the national civil registration systems, which
are the responsibility of the Ministry of the Interior and/or
the Ministry of Justice except in Ireland and the United
Kingdom where they come under the Office of the
Reg-istrar General (a self-contained department).
In some cases, statistics on marriage and divorce are
taken from sources other than registers of births,
mar-riages and deaths. In several Community countries,
data on marriages are taken from the records of Church
ceremonies, and those on divorce from records of Court
proceedings. In most countries, the Ministry of Justice
centralizes the information and sends it to the National
Statistical Institute. There is no divorce in Ireland.
Seven Community countries have municipal population
registers (table 1), the general principle of which is an
exhaustive and continually updated record of the
popu-lation. In most cases, the administration of each basic
territorial unit is responsible for running the population
register (births, deaths, changes of residence, etc.).
Definitions of demographic events differ somewhat from
country to country. Although the discrepancies are
generally negligible, in the case of foetal deaths they are
quite appreciable (table 4).
Classification of events by age of subject during
a
given
year may be based on one of two definitions of age:
-{he age reached during the calendar year under
con-sideration,
i.e. the difference between the year of
obser-vation and the year of birth;
-the age in completed years at the time the event occurs,
i.e. the age at last birthday.
A cursory comparison of the rates produced using one
or other of these definitions may distort both the picture
they give of reality and international comparisons.
Tak-ing one or other of these definitions produces significant
Table 1 : Comparison of types of population register by Member States
Computerized and
centralized
Belgium
(Registre National)
Denmark
(Central population register)
Luxembourg
(Répertoire général des
per-sonnes physiques)
Municipal
register^
Belgium
Denmark
Germany
(melderegister)
Spain
(Padrón)
Italy
(Anagrafe)
Luxembourg
Netherlands
(Persoonregister)
Register of
foreigners
Germany'
2'
(Ausländerzentral-register)
No register
Greece (3)
France
Ireland
Portugal
United Kingdom
(1) Partially computerized in Germany, Luxembourg, Spain and Italy; fully computerized in the Netherlands.
(2) Computerized and centralized register
(3) Registers are kept at municipal level for Greek nationals only
differences, particularly in analyses by year of age, since
the actual ages to which rates in completed years refer
are on average six months lower than those to which
rates by age reached during the calendar year refer.
In order to solve this problem Eurostat used SYSCOEM
to introduce a conversion method in 1991 which
pro-vides comparable data on fertility and first marriages for
all Community countries regardless of the definition
used.
CHAPTER A AND B: POPULATION CHANGE AND
POPULATION STRUCTURE
Annual population estimates are based either on the
most recent census, which in this case means those
conducted during the 1980's wave (results from the
1990-91 wave are not yet available), or on the population
register.
Four different types of evaluation method are used to
estimate the total population, and updating is based on
several reference dates (Table 2).
specific survey at points of entry into the country
(Inter-national Passenger Survey).
Ireland uses several indicators to provide a global
esti-mate of its population and calculates net migration by the
natural movement method.
Finally, Spain uses the results of each "Padrón"
(five-yearly census of the population and main demographic
characteristics) to extrapolate an annual figure. Mortality
assumptions are taken from a mortality table centred on
the year of the Padrón and hold constant overthe period.
Estimates are revised every five years when the next
Padrón takes place.
It is in the field of migration that the definitions used by
Member States differ most. For example, the minimum
period for an "absence" to be considered as "migration"
varies between three months (Belgium, Denmark,
Spain, Italy and Luxembourg) and a year (United
King-dom), sometimes with no additional specification
(Ger-many, Greece, France and Portugal). Furthermore,
some countries use a subjective criterion such as the
intention to remain for a certain period of time, regardless
of whether this is actually the case (the Netherlands,
United Kingdom).
Traditionally, Ireland estimates its population each year
in 15 April, the United Kingdom on 30 June and Greece
on 1 July. These estimates give the mean population.
The other Member States carry out their main estimates
on 1 January, calculating the average population as the
arithmetic mean of the population on1 January for two
consecutive years (Table 2).
Exceptions to this are:
- the Federal Republic of Germany, which works out the
arithmetic mean of monthly total population estimates;
- Denmark and the Netherlands, which refer to the
status of their register on 1 July;
The estimation method also varies according to the
observation method. Belgium, Denmark and the
Nether-lands take the status of their population registers on a
given date. Germany, Luxembourg and Italy use their
population registers to obtain the net external migration
figure which, when added to the natural balance, gives
the population increase.
Greece, Portugal, France and the United Kingdom
esti-mate the migration balance either by comparing various
sources (Greece, Portugal, France), or by conducting a
The quality of the statistics produced by individual
coun-tries also varies greatly. It depends partly on the
admin-istrative system operating in each country and its
methods (table 3).
CHAPTER C: THE EUROPEAN COMMUNITY AND
ITS REGIONS
Demographic statistics at NUTS II regional level referto
1991, the last available year.
The sum of the figures for total population, births and
deaths may differ slightly from national data owing to the
inclusion of data for which the regional breakdown is
unknown.
Because different calculation methods are used to
esti-mate national and regional migration balances, the sum
of regional balances may differ slightly from the
esti-mated national total.
The balances published at national level are those
sup-plied by Member States and are calculated using the
methods described under "Population change" above.
By contrast, the regional balances for a particular year
are estimated by Eurostat as being the difference
be-tween the total and natural growth in regional population
overthe same year.
Tableau 2: Annual population estimate in Member States
Country
Β
DK
D
GR
E
F
IRL
I
L
NL
P
UK
Date of main estimate
1 January
1 January
31 December
1 January
1 January
1 January
15 April
1 January
31 December
1 January
1 January
30 June
Base
1991
Census
N/A
1987
Census
1991
Census
1991
Census
1990
Census
1986
Census
1991
Census
1991
Census
N/A
1991
Census
1991
Census
Evaluation method
Population Register
Population Register
Component met hod
Component method
Projections based on results
Padrón
Component method
Global estimate based on trends
of 9 indicators
Component method
Component method
Population Register
Component method
Component method
Post-census re-evaluation
No
N/A
yes
yes
yes
yes
yes
yes
yes
N/A
yes
yes
Mid-year population
Arithmetic mean on 1 January
for two consecutive years
Population register on 1 July
Arithmetic mean of monthly total
population estimates
Arithmetic mean on 1 January
for two consecutive years
Arithmetic mean on 1 January
for two consecutive years
Arithmetic mean on 1 January
for two consecutive years
15 April estimate
Arithmetic mean on 1 January
for two consecutive years
Arithmetic mean on 1 January
for two consecutive years
Population register on 1 July
Arithmetic mean on 1 January
for two consecutive years
CHAPTER D: THE EUROPEAN COMMUNITY IN
THE WORLD
Figures for non-Community countries generally come
from international organizations, mainly the United
Na-tions. Readers are asked to bear in mind that different
countries use different statistical systems.
The comparability and reliability of data cannot always
be guaranteed even if they have been compiled under
the same conditions.
CHAPTER E: FERTILITY
Fertility rates by age and average age at birth of first child
have been recalculated according to a single definition,
namely the age reached in the year the event took place,
which allows rates to be recombined by generation.
The method for converting rates by age in completed
years into rates by age reached in the calendar year is
described in G. Calot's
"La mesure des taux en
démo-graphie - âge en années révolues ou âge atteint dans
l'année civile. Incidence du choix de la définition.
Appli-cation à la fécondité générale (France, 1946-1981)
[Measurement of rates in demographic studies - age in
completed years or age reached during the calendar
year. Impact of the choice of definition. Application to
general fertility (France, 1946-1981)]",
INED, Travaux et
Documents No 104, 1984.
The definition of births by parity differs substantially from
country to country. Data on births by parity have not
therefore been grouped together in a single table, nor
has it been possible to compile a EUR 12 total. For
Denmark, Greece, Spain, Ireland, Italy, the Netherlands
and Portugal, the published birth parity covers a
woman's reproductive years. For Belgium, the Federal
[image:17.595.32.561.568.692.2]Republic of Germany, France, Luxembourg and the
United Kingdom the published birth parity is for the
Table 3: Sources of data on international migrations
current marriage. However, some countries have both
types of information: France (not currently used), Italy,
the Netherlands and Portugal.
Data on abortions depend on the legislative background
against which they are carried out. Figures are not
therefore fully comparable.
CHAPTER F: MARRIAGE AND DIVORCE
First marriages by age are published in completed years
for two countries (Ireland and the United Kingdom), and
by the age reached in the calendar year for all others.
First marriage rates by age have been recalculated by
Eurostat according to a single definition, namely the age
reached in the year the event took place.
Because of legal differences regarding divorce, it is
difficult to compare the number of divorces and
corre-sponding rates between countries; however, these
figures are important as they indicate trends within the
countries concerned.
CHAPTER G: MORTALITY
Deaths by age are published by age in completed years.
Life expectancy at various ages is supplied by Member
States, for 1960-85. After 1985 it has been recalculated
by Eurostat.
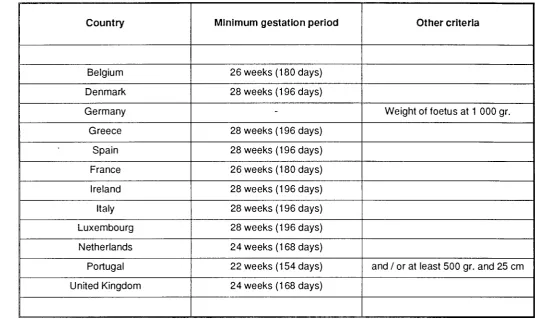
The distinction between a miscarriage, an early foetal
death and a late foetal death (stillbirth) is currently being
revised in several countries. Discrepancies between
definitions lead to variations in the measurement of
perinatal mortality.
Definitions of late foetal deaths (stillbirths) are given in
the table 4.
Computerized central
population register
Belgium
Denmark
Luxembourg
Entry/exit
form
Germany'
2'
Spain
Italy
Netherlands
Sample survey
Ireland
(3)United Kingdom '
4'
Indirect Sources for
non-nationals
(1)Greece
France
Portugal
(1) No source is available for nationals.
(2) There is a parallel source for the foreign population, namely the Ausländerzentralregister.
(3) A specific question is included in the Labour Force Survey.
(4) International Passenger Survey: voluntary survey organised by the OPCS at points of entry into the country; each
year some 1 000 of the 100 000 people leavings the country can be considered emigrants, and some 2 500 of 60
000 people coming into the country can be considered immigrants.
Table 4: Current definitions of foetal death
Country
Belgium
Denmark
Germany
Greece
Spain
France
Ireland
Italy
Luxembourg
Netherlands
Portugal
United Kingdom
Minimum gestation period
26 weeks (180 days)
28 weeks (196 days)
-28 weeks (196 days)
28 weeks (196 days)
26 weeks (180 days)
28 weeks (196 days)
28 weeks (196 days)
28 weeks (196 days)
24 weeks (168 days)
22 weeks (154 days)
24 weeks (168 days)
Other criteria
Weight of foetus at 1 000 gr.
and / or at least 500 gr. and 25 cm
Causes of death are defined on the basis of the World
Health Organization International's International
Classi-fication of Diseases.
390-459 Diseases of the circulatory system
140-208 Malignant neoplasms, of which:
151, 153, 154 malignant neoplasms of stomach, colon,
rectum, rectosigmoid junction and anus
162 malignant neoplasms of trachea, bronchus and lung
174-180 malignant neoplasms of female breast and
cervix uteri
250 Diabetes
480-486 Pneumonia
490-493 Bronchitis, emphysema and asthma
E800-E949 Accidents and disasters, of which:
E810-E819 motor vehicle traffic accidents
E950-E959 Suicide and self-inflicted injury
Statistics on AIDS deaths have also been included.
CHAPTER H: POPULATION BY NATIONALITY
Countries use different sources to record theirpopulation
by nationality.
Some Member States use their population registers
(Belgium, Denmark, Federal Republic of Germany, Italy,
Luxembourg, Netherlands), whilst others supply figures
from the last population census (France), estimates
derived from the Labour Force Survey (Ireland and
United Kingdom) or simply count the number of
residence permits (Portugal).
Spain and Greece base their annual estimates on the
latest census.
CHAPTER I: POPULATION PROJECTION
The most recent population projections, compiled
be-tween 1990 and 1992, are made by the national
statisti-cal institutes of the member states. The relevant
hypotheses are shown after the tables.
SIGNS USED
* Eurostat estimate
- Zero
: Not available
A-1 Natural growth (per 1000 inhabitants)
1970
EUR12
1975
Β DK
19Θ0
D
1970
EURI 2
1975
GR
D E
1S80
F
eurostat
1970
EUR12
197S 1980
IRL l L
A-1
Population change of EUR12
1960 1961 1962 1963 1964 1965 1966 1967 1968 1969 1970 1971 1972 1973 1974 1975 1976 1977 1978 1979 1980 1981 1982 1983 1984 1985 1986 1987 1988 1989 1990 1991 1992 1993 Population on 1 Janua-ry (1000) 296 081.8 298 257.9 300 845.7 304 199.7 306 775.1 3C9 367.3 311 892.2 314213.1 316 025.5 318 089.0 320 294.0 321 366.1 323 364.7 325 221.9 326 816.9 328 172.4 329 398.9 330 403.9 331 528.6 332 731.0 333 951.8 335 393.9 336 237.3 336 882.3 337 361.2 337 853.7 338 527.6 339 369.4 340197.0 341 442.6 342 446.0 344 044.0 345 586.7
347 316.01
Births (1000) 5 473.4 5 584.4 5 641.0 5 778.0 5 910.7 5 766.1 5 729.6 5 608.7 5 479.5 5 387.4 5 208.3 5214.7 4 990.2 4 789.7 4 687.3 4 484.8 4 446.6 4 376.2 4 339.0 4 337.4 4 379.0 4 279.6 4 220.9 4 071.6 4 041.7 4 026.0 4 038.3 4 042.2 4 094.5 4 040.5 4 098.9 4 006.2 3 949.7 Deaths (1000) 3 181.6 3 147.8 3 290.0 3 359.5 3211.7 3 325.3 3 323.2 3 324.5 3 475.1 3 544.1 3 456.1 3 477.8 3 480.6 3 526.4 3 513.4 3 564.7 3 563.9 3 454.3 3 495.6 3 483.4 3 508.6 3 508.5 3 471.3 3 540.0 3 468.2 3 533.0 3 507.8 3 428.1 3 447.0 3 467.8 3 493.0 3 502.5 3 452.4 Natural increase (1000) 2 291.8 2 436.6 2 351.1 2 418.5 2 699.0 2 440.8 2 406.4 2 284.2 2 004.4 1 843.3 1 752.2 1 737.0 1 509.6 1 263.3 1 173.9 920.2 882.7 921.9 843.4 854.0 870.4 771.1 749.5 531.7 573.5 493.1 530.5 614.1 647.5 572.7 605.9 503.6 497.3 Net mi-gration (1000) -114.4 256.1 929.0 136.2 77.5 18.2 -118.8 -479.0 54.3 396.3 446.7 332.8 331.0 156.7 294.8 131.4 241.6 317.1 377.9 557.4 111.8 -13.9 65.4 -20.7 277.7 377.4 379.8 609.9 847.7 953.8 1 041.9 1 193.0' Total in-crease (1000) 2 176.0 2 587.9 3 354.0 2 575.3 2 592.2 2 525.0 2 320.8 1 812.4 2 063.5 2 205.0 1 072.1 1 998.7 1 857.2 1 595.0 1 355.5 1 226.6 1 005.0 1 124.7 1 202.4 1 220.8 1 442.0 843.4 645.0 478.9 492.5 673.9 841.8 827.5 1 245.7 1 003.4 1 598.0 1 542.7 1 729.3 Births per 1000 po-pulation 18.4 18.6 18.6 18.9 19.2 18.6 18.3 17.8 17.3 16.9 16.3 16.2 15.4 14.7 14.3 13.6 13.5 13.2 13.1 13.0 13.1 12.7 12.5 12.1 12.0 11.9 11.9 11.9 12.0 11.8 11.9 11.6 11.4 Deaths per 1000 popula-tion 10.7 10.5 10.9 11.0 10.4 10.7 10.6 10.6 11.0 11.1 10.8 10.8 10.7 10.8 10.7 10.8 10.8 10.4 10.5 10.5 10.5 10.4 10.3 10.5 10.3 10.5 10.4 10.1 10.1 10.1 10.2 10.2 10.0 Natural increase per 1000 popula-tion 7.7 8.1 7.8 7.9 8.8 7.9 7.7 7.3 6.3 5.8 5.5 5.4 4.7 3.9 3.6 2.8 2.7 2.8 2.5 2.6 2.6 2.3 2.2 1.6 1.7 1.5 1.6 1.8 1.9 1.7 1.8 1.5 1.4 Net mi-gration per 1000 popula-tion -0.4 0.9 3.1 0.4 0.3 0.1 -0.4 -1.5 0.2 1.2 1.4 1.0 1.0 0.5 0.9 0.4 0.7 1.0 1.1 1.7 0.3 0.0 0.2 -0.1 0.8 1.1 1.1 1.8 2.5 2.8 3.0 3.4· Total in-crease per 1000 popula-tion 7.3 8.6 11.1 8.4 8.4 8.1 7.4 5.8 6.5 6.9 3.3 6.2 5.7 4.9 4.1 3.7 3.0 3.4 3.6 3.7 4.3 2.5 1.9 1.4 1.5 2.0 2.5 2.4 3.7 2.9 4.7 4.5 5.0
A-2 Natural growth rate -1992
Country
A-3 Net migration-1992
D
I
-
GRE
-
DK-
PB
-
UK-
L-
F-
NLIRI
-Ζ
]
3
zj
:
=1
z:
1
:
1
1
1 '
ι :
■ ι
1
I4H
eurostat0
5
10
Per 1000 average population
15
Country
IRI
P
-
UKE
-
F-
DKB
I
-
NL-
GR-
DI
-I
d
D
]
I
I
I
I
I
Ώ
; ι
I~mL
eurostatπ
1 1
0 5 10
Per 1000 average population
15
A-4 Population increase -1992
Country
I
-
E-
UKI
-
DK-
IRLB
-
F-
GR-
NL-
DI
-]
I
I
I
I
I
J
zz
I
I
14M
eurostat
I
1 1
0 5 10
A-2
Rate of natural increase
1960 1965 1970 1975 1980 1985 1987 1988 1989 1990 1991 1992 EUR12 7.7 7.9 5.5 2.8 2.6 1.5 1.8 1.9 1.7 1.8 1.5 1.4
Β
4.5 4.3 2.4 0.0 1.1 0.3 1.2 1.5 1.4 1.9 2.2 2.11DK
7.1 8.0 4.6 4.2 0.3 -0.9 -0.4 0.0 0.4 0.5 0.9 1.3D
5.3 5.5 0.9 -2.6 -1.1 -1.5 -0.4 -0.1 -0.3 -0.2 -1.0 -0.9 (perGR
11.6 9.8 8.1 6.9 6.3 2.4 1.1 1.5 0.9 0.8 0.7 0.61000 average population)
E
13.0 12.7 11.3 10.5 7.5 3.7 3.0 2.6 2.2 1.8 1.5 1.3F
6.5 6.5 6.0 3.5 4.7 3.9 4.3 4.4 4.2 4.2 4.1 3.9 IRL 9.9 10.6 10.4 10.7 11.9 8.2 7.6 6.5 5.7 6.2 6.0 5.8I
2 8.8 9.6 7.2 5.2 1.7' 0.7' 0.4' 0.7' 0.6' 0.6' 0.2' 0.2'L
4.1 3.7 0.8 -1.1 0.2 0.2 0.6 2.0 1.8 3.0 3.2 2.9NL
13.2 12.0 9.9 4.7 4.7 3.8 4.4 4.2 4.0 4.6 4.6 4.4Ρ
13.4 12.8 10.1 9.0 6.5 3.3 2.8 2.4 2.3 1.3 1.2 1.4UK
6.0 6.8 4.5 0.6 1.6 1.4 2.3 2.4 2.1 2.7 2.5 2.5A-3
Net migration
1960 1965 1970 1975 1980 1985 1987 1988 1989 1990 1991 1992 EUR12 -0.4 0.1 0.9 1.7 0.8 1.1 1.8 2.5 2.8 3.0 3.4Β
0.5 2.8 0.4 2.4 -0.3 0.0 -0.1 0.0 1.1 2.0 1.4 2.6DK
0.7 0.1 2.4 -1.7 0.1 1.9 1.2 0.1 0.7 1.6 2.1 2.2D
2.4 4.2 7.2 -2.7 3.9 0.7 2.8 6.1 7.7 7.9 7.5 9.8 (perGR
-3.7 -4.7 -5.3 6.5 5.2 0.6 -0.1 1.6 2.9 5.5 15.0 5.81000 average
E
-4.6 -2.2 -0.8 0.4 3.0 -0.2 -0.5 -0.3 0.9 0.0 0.6 0.2 population)F
3.1 2.3 3.5 0.3 0.8 0.7 0.8 1.0 1.3 1.4 1.6 1.6 IRL -14.8 -7.5 -1.2 5.4 -0.2 -7.3 -8.5 -11.6 -10.2 -2.3 0.5 -1.7I
2 -1.9 -1.7 -2.2 0.2 -0.1 -0.5' -0.3' -0.4' - 0 . 4 ' 0.3' -0.3' 3.0'L
1.7 5.3 3.1 9.7 3.7 2.2 5.3 6.5 7.5 10.3 10.8 10.8NL
-1.1 1.5 2.6 5.3 3.7 1.7 3.0 2.4 2.6 4.0 4.2 3.8Ρ
-25.5 -14.3 -16.4 38.2 4.3 -3.2 -3.2 -3.3 -3.3 -3.3 -2.5 -1.0UK
2.1 -0.8 -0.3 -0.8 -0.7 1.3 0.3 0.0 0.9 0.1 0.2 -0.2Α^*
Population increase
1960 1965 1970 1975 1980 1985 1987 1988 1989 1990 1991 1992 EUR12 7.3 8.1 3.3 3.7 4.3 2.0 2.4 3.7 2.9 4.7 4.5 5.0
Β
5.4 7.5 -1.0 2.5 0.8 0.1 1.1 5.2 2.0 3.9 3.5 4.6DK
7.7 8.1 6.9 2.5 0.3 1.0 0.8 0.1 1.1 2.1 3.0 3.6D
7.5 9.8 -2.6 -5.3 2.8 -0.6 1.5 6.3 9.2 ■ 8.1 6.5 8.7(per 1000 average
GR
7.9 5.2 2.8 13.3 11.5 3.0 1.1 3.2 3.8 6.3 15.7 6.5E
8.4 10.5 13.0 10.9 10.5 3.5 2.6 2.2 1.9 1.8 1.6 1.5 oopulatiF
9.6 8.0 9.6 3.8 5.5 4.6 5.1 5.4 5.4 5.6 5.7 5.4 on) IRL -4.9 3.2 9.3 16.1 11.8 0.9 -0.9 -5.2 -1.3 3.8 7.0 4.6I
2 6.9 7.9 5.1 5.3 1.6 0.2' 0.1' 0.3' 0.3' 0.9' - 0 . 1 ' 3.6'L
6.0 9.0 3.9 8.6 3.8 2.8 6.7 7.8 11.7 13.4 13.9 13.8 NL3 12.1 13.4 12.4 9.8 8.3 5.2 6.8 6.1 5.9 7.9 7.9 7.2Ρ
-12.1 -1.5 -6.7 -44.0 10.8 0.1 -0.4 -0.8 -1.8 -1.9 -1.3 0.4UK
8.1 6.0 4.2 -0.2 1.0 2.7 2.7 2.7 3.0 4.9 5.1 3.21 Provisional data
A-5
Population change in 1992
Β DK
D
GR E F
IRL I
L NL
Ρ
UK
EUR12
Population
on 1 Janua
ry 1.1.93
(1000)
10 068.3 5180.6
80 974.6 10 346.4
39 114.2 57 529.6
3 560.0 56 960.3 395.2
15 239.2 9 859.6
58 088.0'
347 316.0
Births
(1000)
125.1' 67.7
809.11
104.1
390.0' 2
743.4
51.6 560.8' 3
5.1
196.7 115.0 781.0
3 949.7
Deaths
(1000)
103.7' 60.8
885.4 98.2 341.1
521.42
30.9' 541.43
4.0
129.9 101.2 634.2
3 452.4
Natural
increase
(1000)
21.3 6.9
-76.4 5.9
48.9 222.0
20.6 19.3
1.1 66.8 13.9 146.8
497.3
Net mi
gration
(1000)
25.9 11.5
788.0 60.1 9.4·
90.0
-6.0 172.9 4.3
58.1 -10.0 -11.1
1 193.0
Total in
crease
(1000)
46.3 18.5
700.1 66.6
58.3 312.0
16.5 203.1 5.4
110.0 4.3 188.4
1 729.3
Births per
1000 po
pulation
12.5 13.1
10.0 10.1
10.0 13.0
14.5 9.9 13.1
13.0 11.7 13.5
11.4
Deaths
per 1000
popula
tion
10.3
11.8 11.0 9.5 8.7
9.1 8.7
9.5 10.2
8.6 10.3 10.9
10.0
Natural
increase
per 1000
popula
tion
2.1 1.3
-0.9 0.6
1.3 3.9
5.8 0.3 2.9
4.4 1.4 2.5
1.4
Net mi
gration
per 1000
popula
tion
2.6 2.2
9.8 5.8
0.2 1.6 -1.7
3.0 10.8
3.8 -1.0 -0.2
3.4
Total in
crease
per 1000
popula
tion
4.6 3.6
8.7
6.5 1.5 5.4
4.6 3.6 13.8
7.2 0.4 3.2
5.0
1 Provisional data 2 False stillbirth included
I
B-1 Annual growth rate - EUR 12
5
-3
2
1
-0
-1
eurostat
B-1
Total population on 1 January
B-2
Population by age on 1 January 1992 - Total
(1000)
0 1 2 3 4 0-4 5 6 7 8 9 5-9 10 11 12 13 14 10-14 15 16 17 18 19 15-19 20 21 22 23 24 20-24 25 26 27 28 29 25-29 30 31 32 33 34 30-34 EUR 12 3 995.6 4 076.3 4030.64 0 7 9 3
4 040.6 20 223.0 4 051Λ 4 045.2 4 050.3 4 071.6 4 221.4 20 440.2 4 246.9 4360.2 4310.8 4 308.6 4 328.0 21554.4 4 3893 4481.4 4 640.4 4 7593 4 9803 23 251.4 51943 5 2663 5 4063 5 474.7 5 5673 26 9093 5 6983 5 7523 5 8273 5 724.6 5 5803 28 584.1 5 5263 5 424.7 5 313.6 5140.1 5 066.4 26471.1