SHORT REPORT
Quantification of two isomeric flavones
in rat colon tissue using reverse phase high
performance liquid chromatography
Crystal L. Whitted
1, Victoria E. Palau
1, Ruben D. Torrenegra
2, Oscar E. Rodriguez
3and Sam Harirforoosh
1*Abstract
Background: Antineoplastic activity has been previously shown for two isomeric flavones, 5,7-dihydroxy-3,6,8-trimethoxy flavone (flavone A) and 3,5-dihydroxy-6,7,8-5,7-dihydroxy-3,6,8-trimethoxy flavone (flavone B), against colon cancer cell lines (Thomas et al. in PLoS ONE 7:e39806, 5). Here, we present modified methods for the extraction and quantification of flavones A and B in rat colon tissue after intravenous dosing via high performance liquid chromatography, from the originally described procedure for extraction and quantification in rat plasma (Whitted et al. in J Chromatogr B Analyt Technol Biomed Life Sci 1001:150–155, 7).
Results: Modifications included tissue homogenization (1 g tissue: 2 mL water), filtration of the supernatant with a PVDF membrane, and the use of only one calibration curve to determine the concentration of each flavone in colon tissue. Good separation was achieved and representative equations were linear with r2≥ 0.99 for both flavones.
Preci-sion and accuracy for flavone A ranged from 0.88–24.03 and 109–116%. PreciPreci-sion and accuracy for flavone B ranged from 1.62–33.56 and 98–113%. Concentrations of 1639 ± 601 ng/g flavone A and 5975 ± 2480 ng/g of flavone B were detected in rat colon tissue 6 h post dosing.
Conclusions: Modifications to the extraction methods for flavone A and flavone B from rat colon tissue had good separation, precision, and accuracy.
Keywords: 5,7-Dihydroxy-3,6,8-trimethoxy flavone, 3,5-Dihydroxy-6,7,8-trimethoxy flavone, HPLC, Colon, Flavonoids, Cancer
© The Author(s) 2017. This article is distributed under the terms of the Creative Commons Attribution 4.0 International License (http://creativecommons.org/licenses/by/4.0/), which permits unrestricted use, distribution, and reproduction in any medium, provided you give appropriate credit to the original author(s) and the source, provide a link to the Creative Commons license, and indicate if changes were made. The Creative Commons Public Domain Dedication waiver (http://creativecommons.org/ publicdomain/zero/1.0/) applies to the data made available in this article, unless otherwise stated.
Background
Many flavonoids have been recognized for their anti-tumor properties [1–4]. It is known that these activities are greatly determined by their chemical structure which subsequently dictates their ability to interact with cellular molecules [1]. This differential effect has been observed with flavone isomers 5,7-dihydroxy-3,6,8-trimethoxy flavone (flavone A) and 3,5-dihydroxy-6,7,8-trimethoxy flavone (flavone B) [5]. Specifically, each isomer has been shown to target colon cancer cells with distinct pheno-typical characteristics via different mechanisms of action
[6]. However, it is unknown whether either of these fla-vones distribute to the colon after intravenous adminis-tration of these compounds. Modifications were made to methods developed for extracting and quantifying these flavones in rat plasma [7] using reverse phase high performance liquid chromatography (HPLC). The mod-ifications included preparation of the sample by homog-enization in water, filtration using a polyvinylidene fluoride (PVDF) membrane, and the creation of a sin-gle calibration curve to determine the concentration of either flavone in colon tissue.
These methods allowed for the detection of flavone A and flavone B in rat colon. Our data indicate that flavone B was found in higher concentrations in the colon than flavone A, which may be the result of higher volume of
Open Access
*Correspondence: [email protected]
1 Department of Pharmaceutical Sciences, Gatton College of Pharmacy,
East Tennessee State University, Box 70594, Johnson City, TN 37614-1708, USA
gel chromatography column. Flavone B was purified from leaves of Achyrocline bogotensis, using chloroform, followed by crystallizations in hexane. The physical and spectroscopic properties of these compounds allowed their proper identification.
Stock solution and standards
Stock solutions of flavone A at a concentration of 100 µg/ mL, prepared as described previously [7], and 25 µg/mL celecoxib (Toronto Research Chemicals; Toronto, ON, CA) were prepared with acetonitrile/water/acetic acid/ triethylamine (60:40:0.2:0.05). Stock solutions of 100 µg/ mL of flavone B, prepared as described previously [7], and 25 µg/mL diclofenac (MP Biomedicals, LLC; Solon, OH) were prepared with acetonitrile/water/acetic acid/ trimethylamine (70:30:0.2:0.05). All stock solutions were stored protected from light at 4 °C. HPLC grade acetoni-trile, acetic acid, trimethylamine, and water were pur-chased from Fisher Scientific (Pittsburgh, PA). Flavone A or flavone B were mixed with polyethylene glycol 400 (Electron Microscopy Sciences; Hatfield, PA) for intrave-nous injection.
Sample preparation
Colon tissue was homogenized using a PowerGen 700 from Fisher Scientific (Pittsburgh, PA) in a 1:2 ratio with water (1 mg/2 mL). Serial concentrations for calibra-tion curves (flavone A: 250–100,000 ng/g and flavone B: 1000–25,000 ng/g) were prepared. Briefly, 100 μL of blank homogenate was spiked with 100 μL flavone, 100 µL internal standard (25 µg/mL celecoxib or diclofenac), and 200 μL of organic solvent (acetonitrile). The samples were vortex mixed before being centrifuged for 15 min at 3000×g. The supernatant was removed and filtered with a PDVF filter (0.45 µm) into a clean tube and evaporated using a Labconco vacuum concentrator (Kansas City, MO). Mobile phase (200 μL) was used to reconstitute the residue and 100 μL of sample was injected into the HPLC column. Analysis was conducted in triplicate.
at 245 nm with a temperature of 30 °C. Flow rate was 0.4 mL/min with run times of 11 and 10 min, respec-tively. LC solutions program was used to collect and ana-lyze the data.
Animals and drug administration
The methods described here were used to determine the concentrations of flavone A or flavone B in colon tissue collected from male Sprague–Dawley rats (Charles River Laboratories, Raleigh, NC, USA) used in a previous study [7]. Briefly, flavones were mixed in polyethylene glycol 400 and were administered by intravenous injection to deliver a 20 mg/kg dose of flavone A (n = 6) or flavone B (n = 6). Animals were euthanized under anesthesia 6 h post dosing. Colon tissue was collected and flash frozen using dry ice and stored at −80 °C until analyzed for the measurement of concentrations of flavones.
Results
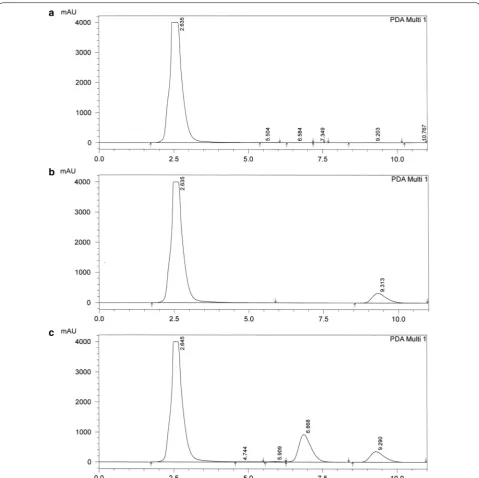
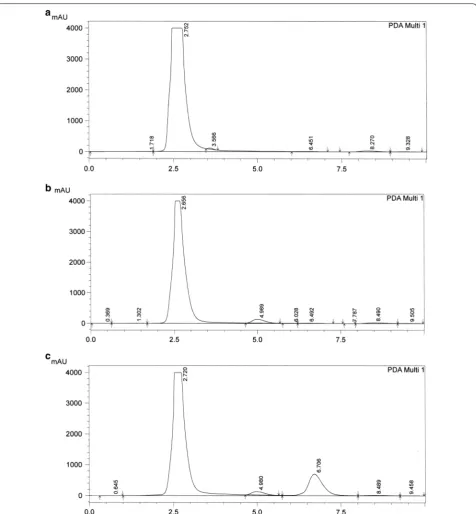
Good separation was achieved (Figs. 1, 2) and the peak area ratios of flavone against internal standard were plotted in Excel to make the calibration curves (Fig. 3). Representative equation for flavone A concentra-tions 250–100,000 ng/g was y = 2E − 05x + 0.0029
and flavone B concentrations 1000–25,000 ng/g was y = 7E − 05x + 0.0531 with r2 ≥ 0.99. Three calibration
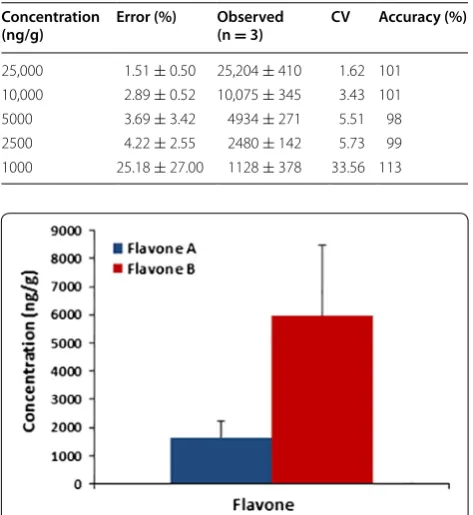
curves were used to determine the precision (coefficient of variation—CV) and accuracy of the methods. Data is presented as mean ± standard deviation (Tables 1, 2). Analysis yielded 1639 ± 601 ng/g of flavone A and 5975 ± 2480 ng/g of flavone B in colon tissue (Fig. 4).
Conclusion
Abbreviations
Flavone A: 5,7-dihydroxy-3,6,8-trimethoxy flavone; Flavone B: 3,5-dihy-droxy-6,7,8-trimethoxy flavone; HPLC: high performance liquid chromatogra-phy; PVDF: polyvinylidene fluoride.
Authors’ contributions
SH designed the experiments, analyzed the data, and wrote the manuscript. CLW perfumed the experiments, analyzed the data, and wrote the manuscript. VEP analyzed the data and wrote the manuscript. RDT and OER extracted and purified flavones A and B and wrote the manuscript. All authors read and approved the final manuscript.
Author details
1 Department of Pharmaceutical Sciences, Gatton College of Pharmacy,
East Tennessee State University, Box 70594, Johnson City, TN 37614-1708, USA. 2 Universidad de Ciencias Aplicadas y Ambientales, Bogotá, Colombia. 3 Department of Environmental Engineering, Faculty of Engineering,
Universi-dad El Bosque, Bogotá, Colombia.
Acknowledgements
Not applicable.
Competing interests
The authors declare that they have no competing interests.
Availability of data and materials
The dataset supporting the conclusions of this article are available upon request from the first author manuscript.
Ethics approval and consent to participate
The study protocol (P-131001) was approved by the East Tennessee State University Committee on Animal Care, and conducted in facilities accredited by AAALAC according to guidelines in the Public Health Service Guide for the Care and Use of Laboratory Animals.
Funding
This study was funded by a grant from the East Tennessee State Univer-sity Research Development Committee Major Grants Program. The funding body had no role in the design of the study and collection, analysis, and interpretation of data and in writing the manuscript.
Received: 22 June 2016 Accepted: 20 December 2016
References
1. Lopez-Lazaro M. Flavonoids as anticancer agents: structure– activity relationship study. Curr Med Chem Anticancer Agents. 2002;2:691–714.
Fig. 3 Calibration curves were made by graphing the ratio of flavone/internal standard area under the curve extracted from colon tissue versus the known concentration of flavone. Representative calibration curves for a flavone A and b flavone B are presented
Table 1 Precision and accuracy for 250–100,000 ng/g fla-vone A extracted from rat colon tissue
Concentration
(ng/g) Error (%) Observed (n = 3) CV Accuracy (%)
100,000 13.88 ± 2.14 113,888 ± 2138 1.87 114 25,000 16.32 ± 1.06 29,081 ± 265 0.91 116 10,000 11.83 ± 4.15 11,182 ± 415 3.71 111 5000 9.93 ± 0.97 5496 ± 48 0.88 109 2500 13.92 ± 4.87 2848 ± 121 4.27 113 1000 11.45 ± 8.90 1114 ± 89 7.98 111 500 16.65 ± 21.51 558 ± 129 23.21 111 250 21.02 ± 19.30 285 ± 68 24.03 113
Table 2 Precision and accuracy for 1000–25,000 ng/g fla-vone B extracted from rat colon tissue
Concentration
(ng/g) Error (%) Observed (n = 3) CV Accuracy (%)
25,000 1.51 ± 0.50 25,204 ± 410 1.62 101 10,000 2.89 ± 0.52 10,075 ± 345 3.43 101 5000 3.69 ± 3.42 4934 ± 271 5.51 98 2500 4.22 ± 2.55 2480 ± 142 5.73 99 1000 25.18 ± 27.00 1128 ± 378 33.56 113
[image:5.595.69.539.87.197.2] [image:5.595.56.291.261.387.2] [image:5.595.56.293.423.681.2] [image:5.595.56.292.425.680.2]• We accept pre-submission inquiries
• Our selector tool helps you to find the most relevant journal
• We provide round the clock customer support
• Convenient online submission
• Thorough peer review
• Inclusion in PubMed and all major indexing services
• Maximum visibility for your research
Submit your manuscript at www.biomedcentral.com/submit