This is a repository copy of The genomic complexity of a large inversion in great tits. White Rose Research Online URL for this paper:
http://eprints.whiterose.ac.uk/146674/ Version: Accepted Version
Article:
da Silva, V.H., Laine, V.N., Bosse, M. et al. (8 more authors) (2019) The genomic complexity of a large inversion in great tits. Genome Biology and Evolution. ISSN 1759-6653
https://doi.org/10.1093/gbe/evz106
Reuse
This article is distributed under the terms of the Creative Commons Attribution (CC BY) licence. This licence allows you to distribute, remix, tweak, and build upon the work, even commercially, as long as you credit the authors for the original work. More information and the full terms of the licence here:
https://creativecommons.org/licenses/ Takedown
If you consider content in White Rose Research Online to be in breach of UK law, please notify us by
The genomic complexity of a large inversion in great tits
Vinicius H. da Silva1,2,3
, Veronika N. Laine4
, Mirte Bosse1
, Lewis G. Spurgin5
, Martijn F. L.
Derks1
Kees van Oers2
, Bert Dibbits1
, Jon Slate6
, Richard P.M.A Crooijmans1
, Marcel E. Visser1,2
,
Martien A. M. Groenen1
∗
1
Animal Breeding and Genomics, Wageningen University & Research
2
Department of Animal Ecology, Netherlands Institute of Ecology (NIOO-KNAW)
3
Swedish University of Agricultural Sciences (SLU)
4
Department of Molecular and Cellular Biology, Harvard University
5
School of Biological Sciences, University of East Anglia, Norwich Research Park University of
East Anglia
6
Department of Animal and Plant Sciences, The University of Sheffield
*Author for Correspondence: Martien A. M. Groenen, Wageningen University & Research,
Animal Breeding and Genomics.
Droevendaalsesteeg 1
6708 PB Wageningen - The Netherlands
+31 0317486001
© The Author(s) 2019. Published by Oxford University Press on behalf of the Society for Molecular Biology and Evolution.
This is an Open Access article distributed under the terms of the Creative Commons Attribution License
D
o
w
n
lo
a
d
e
d
fro
m
h
ttp
s:
//a
ca
d
e
mi
c.
o
u
p
.co
m/
g
b
e
/a
d
va
n
ce
-a
rt
icl
e
-a
b
st
ra
ct
/d
o
i/1
0
.1
0
9
3
/g
b
e
/e
vz1
0
6
/5
4
9
4
7
0
2
b
y
U
n
ive
rsi
ty
o
f S
h
e
ffi
e
ld
u
se
r
o
n
3
1
Ma
y
2
0
1
Abstract
Chromosome inversions have clear effects on genome evolution and have been associated with
speciation, adaptation and the evolution of the sex chromosomes. In birds, these inversions may
play an important role in hybridization of species and disassortative mating. We identified a large
(≈64 Mb) inversion polymorphism in the great tit (Parus major) that encompasses almost 1,000
genes and more than 90% of Chromosome 1A. The inversion occurs at a low frequency in a set of
over 2,300 genotyped great tits in the Netherlands with only 5% of the birds being heterozygous
for the inversion. In an additional analysis of 29 resequenced birds from across Europe we found
two heterozygotes. The likely inversion breakpoints show considerable genomic complexity,
including multiple copy number variable segments. We identified different haplotypes for the
inversion, which differ in the degree of recombination in the center of the chromosome. Overall,
this remarkable genetic variant is widespread among distinct great tit populations and future
studies of the inversion haplotype, including how it affects the fitness of carriers, may help to
understand the mechanisms that maintain it.
Key Words: songbird, structural variation, CNVs,Parus major
D
o
w
n
lo
a
d
e
d
fro
m
h
ttp
s:
//a
ca
d
e
mi
c.
o
u
p
.co
m/
g
b
e
/a
d
va
n
ce
-a
rt
icl
e
-a
b
st
ra
ct
/d
o
i/1
0
.1
0
9
3
/g
b
e
/e
vz1
0
6
/5
4
9
4
7
0
2
b
y
U
n
ive
rsi
ty
o
f S
h
e
ffi
e
ld
u
se
r
o
n
3
1
Ma
y
2
0
1
Introduction
Inversions are structural intra-chromosomal mutations resulting in the reversal of gene/sequence
order. Chromosomal inversions represent an important class of polymorphism that are of particular
interest in evolutionary studies (Hoffmann and Rieseberg, 2008; Kirkpatrick, 2010). Numerous
studies have shown inversions to be important factors in speciation and adaptation (reviewed in
Hoffmann and Rieseberg 2008). Studies of hominin evolution indicate a role of inversions in
the process, with more than one thousand inversions arising in both the human and chimpanzee
lineages since they shared a common ancestor (Hellen, 2015). Red fire ants (Solenopsis invicta)
provide an interesting example of how inversions can promote adaptation; whether or not ant
colonies contain a single queen or multiple queens depends on which inversion genotype is present
the colony. The two social forms are genetically isolated (Keller and Ross, 1998; Wang et al.,
2013). In passerines, inversions are significantly more common in clades with more sympatric
species, which suggests that inversions may often evolve or be maintained because they suppress
recombination between the genomes of hybridizing species (Hooper and Price, 2017). In both
the white-throated sparrow (Zonotrichia albicollis) and the ruff (Calidris pugnax), morphs with
different sexual behaviours are determined by inversions (K¨upper et al., 2015; Lamichhaney et al.,
2016; Tuttle et al., 2016). The inversion in the white-throated sparrow is very large, harboring
≈1,000 genes, and lethal in homozygous state (Tuttle et al., 2016).
To explain how inversions are maintained in a population it is important to understand the
different mechanisms underlying selection on inversions. There can be meiotic drive if the
D
o
w
n
lo
a
d
e
d
fro
m
h
ttp
s:
//a
ca
d
e
mi
c.
o
u
p
.co
m/
g
b
e
/a
d
va
n
ce
-a
rt
icl
e
-a
b
st
ra
ct
/d
o
i/1
0
.1
0
9
3
/g
b
e
/e
vz1
0
6
/5
4
9
4
7
0
2
b
y
U
n
ive
rsi
ty
o
f S
h
e
ffi
e
ld
u
se
r
o
n
3
1
Ma
y
2
0
1
inversion harbors alleles that alter segregation distortion (Kirkpatrick, 2006). Selective
advantages can also occur when an inversion affects the expression of advantageous genes located
within or closely linked to the inversion (Puig et al., 2004). The effect of the inversion on gene
expression is well documented in red fire ants (Huang et al., 2018; Lucas et al., 2015;
Nipitwattanaphon et al., 2013; Wang et al., 2008, 2013). In this species, gene expression
differences between the monogyne and polygyne social forms are greatest in the inversion,
suggesting that the inversion plays a key role in morphological and behavioural differences
between the two forms. In addition, selective advantages of an inversion can be the result of
recombination disruption in heterozygotes, which can preserve advantageous alleles. Moreover,
reduced crossing-over within the inversion is associated with higher recombination rate elsewhere
in the genome (Stevison et al., 2011), which in turn can modulate selection (McGaugh et al.,
2012).
In many cases, recombination is suppressed between an inverted haplotype and the wild
haplotype (Butlin, 2005; Hoffmann and Rieseberg, 2008; Kirkpatrick, 2006, 2010). As a result of
this lack of recombination in heterozygous inversion carriers, strong linkage disequilibrium
between loci within the inverted region can rapidly build up. Although the lack of recombination
can maintain advantageous variants without disruption throughout generations (i.e. supergenes,
reviewed in Thompson and Jiggins 2014), there are also possible costs associated with the
suppression of recombination. Each of the inversion haplotypes will behave as a single heritable
entity that can help to retain certain alleles in the population even when they are subject to
purifying selection (i.e. deleterious recessive alleles can be maintained if they are found within
D
o
w
n
lo
a
d
e
d
fro
m
h
ttp
s:
//a
ca
d
e
mi
c.
o
u
p
.co
m/
g
b
e
/a
d
va
n
ce
-a
rt
icl
e
-a
b
st
ra
ct
/d
o
i/1
0
.1
0
9
3
/g
b
e
/e
vz1
0
6
/5
4
9
4
7
0
2
b
y
U
n
ive
rsi
ty
o
f S
h
e
ffi
e
ld
u
se
r
o
n
3
1
Ma
y
2
0
1
inversion polymorphisms by a “hitchhiking” effect, Kirkpatrick 2006). As a consequence,
deleterious recessive alleles can accumulate in regions of low recombination, such as an
inversion, as they are no longer effectively removed by purifying selection. Moreover, throughout
evolution an inversion becomes structurally more complex than the non-inverted counterpart and
often experiences a degenerative process (Tuttle et al., 2016). This degenerative process has been
reported to be associated with a size increase in young supergenes (Stolle et al., 2018). In general,
an increase in the number of gene copies can alter trans- and cis- gene expression, which might
generate novel phenotypic variation (Geistlinger et al., 2018).
Inversions may harbor complex genomic rearrangements at their breakpoints (Calvete et al.,
2012), given that inversion breakpoints are more likely to happen at complex parts of a
chromosome (Carvalho and Lupski, 2016). Apart from changing the gene order, inversions also
often involve gene duplications that can lead to genetic novelty and subsequent adaptation (Furuta
et al., 2011). In mosquitoes from the species complexAnopheles gambiae, haplotypes involving
structural rearrangements at the breakpoint of a paracentric inversion have shed light on the origin
and evolution of their malaria vectorial capacity (Sharakhov et al., 2006). The presence of
repetitive regions at inversion breakpoints is recurrent and in fact both inversions and repetitive
regions can share the same mechanism of formation, such as non-allelic homologous
recombination (NAHR) (Carvalho and Lupski, 2016; Kehrer-Sawatzki and Cooper, 2008).
Understanding structural variations linked to inversion breakpoints may help to clarify the
possible functionality and evolutionary history of inversions.
D
o
w
n
lo
a
d
e
d
fro
m
h
ttp
s:
//a
ca
d
e
mi
c.
o
u
p
.co
m/
g
b
e
/a
d
va
n
ce
-a
rt
icl
e
-a
b
st
ra
ct
/d
o
i/1
0
.1
0
9
3
/g
b
e
/e
vz1
0
6
/5
4
9
4
7
0
2
b
y
U
n
ive
rsi
ty
o
f S
h
e
ffi
e
ld
u
se
r
o
n
3
1
Ma
y
2
0
1
Genetic markers like SNPs and sequence data can be used to identify inversions
polymorphism given the distinct population genetic structure caused by LD patterns within
inversions. Thus, methods that are based on principal components analysis (PCA) can detect the
unusual genetic structure of inversions (Ma and Amos, 2012). In this study, we describe a 64.2
Mb putative inversion on Chromosome 1A in great tits (Parus major), a widely studied songbird
in ecology and evolution (Husby et al., 2011; Kvist et al., 2003; Visser et al., 1998) with a broad
range of genomic resources such as a high density SNP array (Kim et al., 2018), reference
genome and methylome analysis (Laine et al., 2016) as well as copy number variation (CNV)
maps (da Silva et al., 2018; Kim et al., 2018).
Materials and Methods
Population description, genotyping and sequencing. A total of 2,322 great tits were genotyped
using a custom made Affymetrix great tit 650K SNP chip (Kim et al., 2018) at Edinburgh Genomics
(Edinburgh, United Kingdom). SNP calling was done following the Affymetrix best practices
workflow by using the Axiom Analysis Suite 1.1. After sample filtering, 26 birds with dish quality
control (DQC, Nicolazzi et al. (2014))<0.82 and SNP call rate<95% were discarded. SNPs with
minor allele frequency (MAF)<1% and call rate<95% were removed. Only autosomes were used
in this study. After filtering, 2,296 birds and 514,799 SNPs were kept for subsequent analysis. The
genotyped birds were from our long-term study populations on the Veluwe area near Arnhem,
the Netherlands (52◦02 N, 5◦50 E). More information regarding the origin of the birds and thein
vitro DNA procedures are described by da Silva et al. (da Silva et al., 2018). The raw genotype
D
o
w
n
lo
a
d
e
d
fro
m
h
ttp
s:
//a
ca
d
e
mi
c.
o
u
p
.co
m/
g
b
e
/a
d
va
n
ce
-a
rt
icl
e
-a
b
st
ra
ct
/d
o
i/1
0
.1
0
9
3
/g
b
e
/e
vz1
0
6
/5
4
9
4
7
0
2
b
y
U
n
ive
rsi
ty
o
f S
h
e
ffi
e
ld
u
se
r
o
n
3
1
Ma
y
2
0
1
data used in this study was submitted to GEO (GSE105131). Filtered genotypes and the source
code to perform all analyses described below are available at Open Science Framework (OSF,
https://osf.io/t6gnd/?view_only=821507ec135b44778d8b80254c24633b).
In addition to the birds genotyped on the SNP chip, we also used sequence data from 29
birds (10 from the Wytham Woods population in Oxford (UK), 19 birds sampled from 15 other
European populations). Each bird was sequenced at an average depth of around 10x using
paired-end sequencing libraries. Details of sequencing analysis, as well as information regarding the
origin and sample quality of each bird are provided elsewhere (Laine et al., 2016).
Identification and characterization of a large inversion on Chromosome 1A. Population
structure between SNP-typed individuals was explored using a principal components analysis
(PCA) approach, previously applied for the study of inversions (Ma and Amos, 2012), using the
snpgdsPCAfunction in SNPRelate R/Bioconductor package (v. 1.10.2) (Patterson et al., 2006;
Zheng et al., 2012). Each autosome was analysed separately.
Following PCA, we estimated the fixation index (FST) in a SNP-wise fashion, using the
Fst function available in snpStats R/Bioconductor package (v. 1.26.0) (Clayton, 2015) to
compare birds in different clusters identified by visual inspection (i.e. subpopulations) of PCA
plots. As SNP heterozygosity is expected to be higher within the inversion in carriers (i.e. birds
with two different inversion haplotypes), the ratio of heterozygous birds (i.e “AB”) for each SNP
was assigned within each subpopulation. The SNP-wiseFST and heterozygosity values were used
to define the likely breakpoints of the inversion.
D
o
w
n
lo
a
d
e
d
fro
m
h
ttp
s:
//a
ca
d
e
mi
c.
o
u
p
.co
m/
g
b
e
/a
d
va
n
ce
-a
rt
icl
e
-a
b
st
ra
ct
/d
o
i/1
0
.1
0
9
3
/g
b
e
/e
vz1
0
6
/5
4
9
4
7
0
2
b
y
U
n
ive
rsi
ty
o
f S
h
e
ffi
e
ld
u
se
r
o
n
3
1
Ma
y
2
0
1
Pairwise D′ values, (Lewontin and Kojima, 1960) using all birds, were calculated to assess
linkage disequilibrium patterns on Chromosome 1A. To aid visualization of the patterns revealed
by the SNP data, SNPs were pruned to retain loci with MAF>0.4 and an LD threshold of 0.05
(using genomic windows with a maximum size of 500 kb). Pruning was performed with the
snpgdsLDpruning and snpgdsLDMat functions within the SNPRelate R/Bioconductor
package (v. 1.10.2) (Zheng et al., 2012). A total of 214 SNPs was retained and used in the LD
analysis plot. We produced a graphical representation of the LD map using the LDheatmap
function from the LDheatmap R package (v. 0.99-2) (Shin et al., 2006). The function used to
infer LD in this study makes use of the expectation-maximization (EM) algorithm (Excoffier and
Slatkin, 1995), which is able to infer LD from unphased data. In addition, the R2
(Zaykin et al.,
2008) estimator was used for comparison with results from D′ because each estimator may
respond differently to low frequency alleles (Wray, 2005).
Inference of structural complexity at Chromosome 1A. We used copy number variation (CNV)
data obtained from SNP intensity information from the same great tit population in the Netherlands,
as described previously (da Silva et al., 2018), to evaluate if certain CNVs are associated with
normal/inverted phases. Moreover, we identified CNVs in the 29 resequenced birds from different
European populations (Laine et al., 2016)). First, we used the.bamfile of each sample, containing
reads mapped onto the reference genome build 1.1 using BWA (Li and Durbin, 2009), to extract
map locations with samtools (Li et al., 2009) as described in CNV-seq manual (Xie and Tammi,
2009). CNVs were called with the default parameters of seq (Xie and Tammi, 2009).
CNV-seq uses coverage information to calculate a log2 transformed ratio between the subject samples
D
o
w
n
lo
a
d
e
d
fro
m
h
ttp
s:
//a
ca
d
e
mi
c.
o
u
p
.co
m/
g
b
e
/a
d
va
n
ce
-a
rt
icl
e
-a
b
st
ra
ct
/d
o
i/1
0
.1
0
9
3
/g
b
e
/e
vz1
0
6
/5
4
9
4
7
0
2
b
y
U
n
ive
rsi
ty
o
f S
h
e
ffi
e
ld
u
se
r
o
n
3
1
Ma
y
2
0
1
(inv-norm only, because inv-inv birds were absent from the dataset) and wild-type samples
(norm-norm). A positive ratio is associated with copy-number gain (duplication), while a negative ratio
is associated with copy-number loss (deletion).
In addition, we used Lumpy (Layer et al., 2014) with default parameters, incorporated in the
speedseq pipeline (Chiang et al., 2015) to predict the exact breakpoints of the CNV events and to
predict inversion events from sequence data. Information from split and discordant mapped reads
was used to describe the structure of a CNV complex in one of the inversion breakpoints (details
in the supplementary section 3.4- Patterns in split reads supporting the CNV complex).
Inversion detection by PCR-RFLP. As genotyping with SNP arrays can be time consuming and
expensive, we designed an alternative method to type the Chromosome 1A inversion, based on a
PCR followed by a restriction enzyme digestion (PCR-RFLP). For this, we used the SNP with the
second highestFST value (i.e. AX-100689781) because it almost perfectly captures the inversion
(99.32% of the inv-norm birds have AB genotype and 98.95% of the norm-norm birds have the
AA genotype). The SNP with the highestFST value did not allow distinguishable fingerprintsin
silico because there are no restriction enzymes which differentially cut the two alleles. Instead,
we choose SNP AX-100689781 which is located close to the downstream breakpoint of the
inversion, at position 65,878,384 in the great tit genome build 1.1 (Laine et al., 2016) (details in
the supplementary section primer design and enzyme search). This SNP is located within the first
intron of the gene PIK3C2G. We genotyped 42 birds by PCR-RFLP which had also been
genotyped with the SNP-chip.
D
o
w
n
lo
a
d
e
d
fro
m
h
ttp
s:
//a
ca
d
e
mi
c.
o
u
p
.co
m/
g
b
e
/a
d
va
n
ce
-a
rt
icl
e
-a
b
st
ra
ct
/d
o
i/1
0
.1
0
9
3
/g
b
e
/e
vz1
0
6
/5
4
9
4
7
0
2
b
y
U
n
ive
rsi
ty
o
f S
h
e
ffi
e
ld
u
se
r
o
n
3
1
Ma
y
2
0
1
For each PCR-RFLP reaction we used 6µl of DNA (10ng/µl). The PCR was performed with
OneTaq 2X mastermix (New England Biolabs) and 1µl of primermix (primer sequences are given
in the supplementary section primer design and enzyme search). The PCR program had steps of:
95◦C for 5 min, 34 cycles of 95◦C for 30 seconds, 55◦C for 45 seconds, 72◦C for 90 seconds and
a final elongation step of 72◦C for 10 min. The digestion reaction was done for 5 hrs at 37◦C
using 3µl of the PCR product, 0.4µl of the enzyme SspI (10U/µl, New England Biolabs), 1µl
of theSspI buffer 10X and 5.6µl of sterile deionized water (MQ). The PCR-RFLP was analyzed
on a 3% agarose gel. The restriction fragments were checked on the Geldoc XR+(Biorad) gel
documentation system with the software Image Lab (v. 5.2.1).
Results
Population structure for Chromosome 1A reveals a large inversion. We found a large putative
inversion on Chromosome 1A. Based on visual inspection of the principal component analysis
(PCA) (Patterson et al., 2006), we classified the clustering patterns separately for each autosome
in the great tit genome (Sup Fig 1). Plots for whole chromosomes may reveal obvious
substructure if the inversion is relatively large. Although additional chromosomes display some
population structure (e.g. chromosomes 5 and 7, Figure S1 and S2), the variation within PCA
clusters is greater, and the FST values across these chromosomes less conclusive, relative to the
patterns seen on Chromosome 1A. Moreover, this unusual PCA pattern, which was most likely
reflecting an inversion, was briefly reported elsewhere (Bosse et al., 2017). Therefore, the
remainder of this paper considers the likely inversion polymorphism on Chromosome 1A.
D
o
w
n
lo
a
d
e
d
fro
m
h
ttp
s:
//a
ca
d
e
mi
c.
o
u
p
.co
m/
g
b
e
/a
d
va
n
ce
-a
rt
icl
e
-a
b
st
ra
ct
/d
o
i/1
0
.1
0
9
3
/g
b
e
/e
vz1
0
6
/5
4
9
4
7
0
2
b
y
U
n
ive
rsi
ty
o
f S
h
e
ffi
e
ld
u
se
r
o
n
3
1
Ma
y
2
0
1
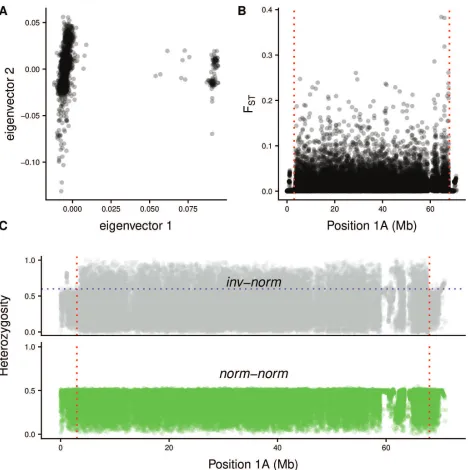
Chromosome 1A displayed clear population structure for the first eigenvector (Figure 1a, First
and Second eigenvectors explain 2.28 and 0.50% of the variance, respectively), with two
subpopulations that are genetically distinct. The larger subpopulation comprises 2,179 birds and
the smaller one contains only 117. Among these 117 birds, ten display intermediate values in
Eigenvector One. Analysis of the genotypes of these ten birds indicates that they are carrying a
distinct copy of the inversion that is derived, possibly by gene conversion, from the most common
inversion haplotype (i.e the ten being heterozygotes and the remainder being homozygous for the
inversion haplotype). The genotypes and LD patterns in the center of the inversion are discussed
in detail in a subsequent section (i.e. Linkage-disequilibrium and haplotypes across the inversion).
We obtained high FST values between the two PCA plot subpopulations across almost the
whole of Chromosome 1A except for the most distal SNPs on the chromosome (Figure 1b). The
heterozygosity level in each of these subpopulations across Chromosome 1A is also strikingly
different (Figure 1c). The heterozygosity level for the smaller subpopulation is greater than for
the larger subpopulation, except for markers close to the telomeres. This suggests that the smaller
subpopulation contains birds heterozygous for the inversion polymorphism. The heterozygosity
patterns are consistent with the pattern shown by theFST analysis, in terms of where the inversion
is located on the chromosome. In addition, the FST values of the SNPs located on Chromosome
1A have a significantly different distribution than SNPs in the rest of the genome (Wilcoxon rank
sum test with continuity correctionp-value≈0.0002).
The PCA, FST and heterozygosity results support the existence of a pericentric inversion
D
o
w
n
lo
a
d
e
d
fro
m
h
ttp
s:
//a
ca
d
e
mi
c.
o
u
p
.co
m/
g
b
e
/a
d
va
n
ce
-a
rt
icl
e
-a
b
st
ra
ct
/d
o
i/1
0
.1
0
9
3
/g
b
e
/e
vz1
0
6
/5
4
9
4
7
0
2
b
y
U
n
ive
rsi
ty
o
f S
h
e
ffi
e
ld
u
se
r
o
n
3
1
Ma
y
2
0
1
in the smaller PCA subpopulation (117 birds). This putative inversion comprises ≈90% of the
length of the chromosome (≈64.2 Mb) and is present only in heterozygous state in this great tit
population (given the PCA clustering in addition to the high levels of heterozygosity of the SNPs
at Chromosome 1A in inv-norm birds, Figure 1a-c).
Linkage-disequilibrium and haplotypes across the inversion. We used the unphased SNP
genotypes from all birds to characterize linkage-disequilibrium (LD) across Chromosome 1A by
calculating D′ (Lewontin, 1964). As expected for regions with low recombination, a large LD
block which overlaps the whole inversion was identified (Figure 2a). This LD block is not present
in norm-norm birds (Figure 2b), suggesting that recombination is only restricted in birds
heterozygous for the inversion. On the other hand, whenR2
is used as a measure of LD inference,
an LD block is only observed in the middle of the chromosome (from position≈24.6 to 48.8 Mb,
Figure 2c). This R2
LD block overlaps the region that causes the two distinct genotype
distributions among the 117 inv-norm birds (Figure 2d).
Initial results show that phasing procedures, such as BEAGLE, fail in inv-norm birds (data
not shown). Consequently, these wrongly phased alleles could lead to wrong conclusions about
inversion sequences. Therefore, a detailed analysis of genetic diversity within the different
inversion haplotypes was not possible. Instead, we used genotype information to explore putative
inversion haplotypes. In the center of the inversion (a 20-55 Mb window was used, which is a 5
Mb up- and downstream extension of the LD block in the center due to uncertainty over the
precise breakpoint locations), the genotype frequencies (i.e. the ratio of genotypes “AA”, “AB”
D
o
w
n
lo
a
d
e
d
fro
m
h
ttp
s:
//a
ca
d
e
mi
c.
o
u
p
.co
m/
g
b
e
/a
d
va
n
ce
-a
rt
icl
e
-a
b
st
ra
ct
/d
o
i/1
0
.1
0
9
3
/g
b
e
/e
vz1
0
6
/5
4
9
4
7
0
2
b
y
U
n
ive
rsi
ty
o
f S
h
e
ffi
e
ld
u
se
r
o
n
3
1
Ma
y
2
0
1
and “BB”, where “A” is the major and “B” the minor allele in the general population) is
substantially different between the ≈10% of the inv-norm birds (ten birds, Figure S5) and the
remainder of the inv-norm birds. The number of “AA” SNP genotypes (i.e. homozygous for the
major allele, which is rare in the inversion) in these ten inv-norm birds that differ from the others
is greater than in the other inv-norm birds. A total of 107 birds (91.4%) have between 4 and 30
(mean = 11.61, standard deviation = 4.95) SNPs with genotype “AA” while the remaining 10
birds have substantially more “AA” genotypes (range = 146-1,382; mean = 892.4; standard
deviation = 394.2; Figure 3). To a certain extent the ten birds with distinct haplotypes can also be
distinguished from the other inv-norm birds, by the PCA analysis due to their intermediate values
in eigenvector one (0.053 to 0.076). These ten birds are from four different areas in Netherlands
(2 birds from Buunderkamp; 3 birds from Westerheide; 2 birds from Roekelse Bos; 2 birds from
Hoge Veluwe and one birds from an unknown location).
Complex genomic structure at the inversion breakpoint. Inversion breakpoints can provide
insight in the evolutionary history of the inversion (Sharakhov et al., 2006). The downstream
breakpoint of the Chromosome 1A inversion harbors a previously identified CNV region, 2802,
located at position 64.83-67.67 Mb (Figure 4a, da Silva et al. 2018). Of all 2,296 birds analyzed
for the inversion, 2,021 were also previously analyzed for copy number variations. This includes
1,921 birds classified as norm-norm and 100 as inv-norm. Among the norm-norm birds, 217
harbor CNVs at the downstream inversion breakpoint (11.29%) whereas 1,704 have two copies as
expected in the diploid state. By contrast, 96% of the inv-norm birds have an individual CNV call
mapped at the CNVR 2802. At this CNVR, 94.8% of all individual CNV calls are gains.
D
o
w
n
lo
a
d
e
d
fro
m
h
ttp
s:
//a
ca
d
e
mi
c.
o
u
p
.co
m/
g
b
e
/a
d
va
n
ce
-a
rt
icl
e
-a
b
st
ra
ct
/d
o
i/1
0
.1
0
9
3
/g
b
e
/e
vz1
0
6
/5
4
9
4
7
0
2
b
y
U
n
ive
rsi
ty
o
f S
h
e
ffi
e
ld
u
se
r
o
n
3
1
Ma
y
2
0
1
Inversion detection with PCR-RFLP. We looked for SNPs with the highest FST possible,
which concomitantly allowed different DNA fingerprints of their SNP genotypes to be obtained
by restriction digest. For the SNP with the second highestFST value (Figure 4b), “AA” and “AB”
genotypes (i.e. associated with norm-norm and inv-norm karyotypes, respectively), our genotype
assay produced two distinct in silico profiles when the PCR fragments were digested by the
enzymeSspI (Figure 4d, represented by the black bars). The SNP is located in the first intron of
thePIK3C2Ggene. In a diploid region, we would expect a profile with four bands (i.e. “AB”) in
an inv-norm bird whereas a profile with two bands (i.e. “AA”) would be norm-norm. However, as
the SNP is placed in a repetitive region (i.e. containing a CNVR and segmental duplications), the
obtained profiles are more complex. We obtained instead four different profiles, which differ in
the intensity in each of the four possible fragments (Figure 4d). Profile B3 was only identified in
inv-norm samples whereas the profiles B1, B2 and B4 were mostly, but not exclusively observed
in norm-norm samples. However, birds with the profile B2, in 90% of the cases, are norm-norm
and in 10% inv-norm. Unexpectedly, the profile B4, which shows high heterozygosity as in the
inversion, was only identified in two norm-norm birds (0% of confidence, i.e. expected to be
found in inv-norm but only found in norm-norm birds).
Assessing breakpoint complexity from sequencing data. We classified 29 birds for the inversion
from distinct European populations by whole genome resequencing (Laine et al., 2016) based on
the presence of the CNV complex at the breakpoint. A total of 27 birds were classified as
norm-norm and two as inv-norm-norm. We used sequencing data from the two inv-norm-norm birds, one from
France and another from Belgium, to characterize CNVs across the inversion. At the downstream
D
o
w
n
lo
a
d
e
d
fro
m
h
ttp
s:
//a
ca
d
e
mi
c.
o
u
p
.co
m/
g
b
e
/a
d
va
n
ce
-a
rt
icl
e
-a
b
st
ra
ct
/d
o
i/1
0
.1
0
9
3
/g
b
e
/e
vz1
0
6
/5
4
9
4
7
0
2
b
y
U
n
ive
rsi
ty
o
f S
h
e
ffi
e
ld
u
se
r
o
n
3
1
Ma
y
2
0
1
breakpoint, we detected a CNV (gain state) in both birds in agreement with the results from the
Dutch great tit population, which suggests a high correlation of the inversion with a gain state at the
downstream breakpoint (Figure 4c). None of the other 27 resequenced birds without the inversion
showed CNVs at this region. The CNVs that we identified in the two inv-norm resequenced birds
point to a substantial increase in the number of copies instead of only a single copy gain. Thelog2
values from CNV-seq at that region suggest around ten copies in the inverted phase involving three
CNVs that are part of the same structural complex (the regions between 65.87-65.90, 67.56-67.58
and 67.64-67.65 Mb, which together comprise≈50.43 kb). In addition, we identified an increase
of around 100 copies in a region upstream to the CNV complex (63.44-63.46 Mb,≈20 kb), which
in turn is followed by an increase of around ten copies (63.46-63.56 Mb, ≈100 kb). It is unclear
if these events are part of the same complex (Sup Fig 4 shows the estimated number of copies in
each of the above mentioned CNV regions). Considering only the three CNVs which are part of
the complex, the inverted Chromosome 1A is at least 500 kb larger than the reference (i.e. the
normal non-inverted) haplotype. However, summing the CNV complex with other upstream CNV
regions that are also only present in sequenced inv-norm birds (i.e. a region with ≈100 copies
followed by other regions with≈10 copies), suggests that the inverted chromosome may be up to
3.5 Mb larger than the normal chromosome.
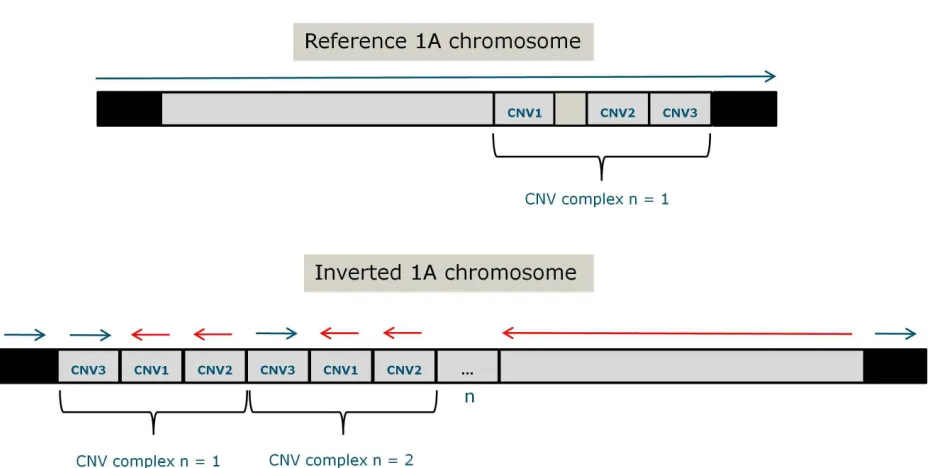
As split reads from sequencing data are useful to reveal complex rearrangements in the
genome, we evaluated their pattern in the CNVR. We identified split reads in this region that
support a complex genomic rearrangement involving different CNVs. Split reads and discordantly
mapped paired reads show that this region contains a complex rearrangement of three intervals
D
o
w
n
lo
a
d
e
d
fro
m
h
ttp
s:
//a
ca
d
e
mi
c.
o
u
p
.co
m/
g
b
e
/a
d
va
n
ce
-a
rt
icl
e
-a
b
st
ra
ct
/d
o
i/1
0
.1
0
9
3
/g
b
e
/e
vz1
0
6
/5
4
9
4
7
0
2
b
y
U
n
ive
rsi
ty
o
f S
h
e
ffi
e
ld
u
se
r
o
n
3
1
Ma
y
2
0
1
which are arranged in a different order and orientation when compared to the reference genome
(supplementary section patterns in split reads supporting the CNV complex, Figure 5).
In addition, Lumpy (Layer et al., 2014) was used to predict the exact breakpoints of the
inversion. We were unable to infer the whole inversion event from sequencing data, but
interestingly one large inversion was unique to the two inv-norm samples that were sequenced.
The inversion boundaries are from 62.15 to 63.55 Mb, with a length of 1.4 Mb on the reference
genome. For the two inv-norm samples, 9 (sample name = 233) and 8 (sample name = 973) reads
supported this 1.4 Mb inversion event. The coordinates of the inversion start lies within a single
copy region, while the coordinates of the inversion end are located in the CNV complex
(65.87-67.65 Mb). Therefore, we hypothesize that at least one of the inversion breakpoints is
within the large complex; however, the precise coordinates are difficult to predict.
Gene content and functionality at the inversion breakpoint. Genomic regions around the
inversion breakpoints can have a different structure and nucleotide diversity compared to the rest
of the inversion (Andolfatto et al., 2001; Branca et al., 2011; Hoffmann and Rieseberg, 2008).
The CNV complex overlaps 32 genes associated with a broad range of phenotypes in other
species (for details on the phenotypes associated with each gene see supplementary section 3.3
Genes overlapping the CNVR at the CNV complex). It is perhaps noteworthy that three genes
(BPGM,CALD1andPIK3C2G) could potentially be broken in the inverted haplotype, given that
sequencing data shows CNVs only partially overlapping them.
D
o
w
n
lo
a
d
e
d
fro
m
h
ttp
s:
//a
ca
d
e
mi
c.
o
u
p
.co
m/
g
b
e
/a
d
va
n
ce
-a
rt
icl
e
-a
b
st
ra
ct
/d
o
i/1
0
.1
0
9
3
/g
b
e
/e
vz1
0
6
/5
4
9
4
7
0
2
b
y
U
n
ive
rsi
ty
o
f S
h
e
ffi
e
ld
u
se
r
o
n
3
1
Ma
y
2
0
1
Discussion
Here we have described a large putative inversion on Chromosome 1A of the great tit (Bosse
et al., 2017) that covers more than 90% of the chromosome and contains almost 1,000 genes. The
inversion is present in 5% of the analyzed Dutch population as well as in two out of 29 resequenced
individuals from other European populations; one carrier was from Belgium and the other from
France, indicating that the inversion is present in other great tit populations as well. In this study,
the inversion was analyzed with a SNP array and by shotgun sequencing. Although the most likely
explanation for suppressed recombination is an inversion (Kirkpatrick, 2010), we acknowledge
that methods such as FISH (Bishop, 2010) and long read sequencing (Shao et al., 2018) need to
be used to confirm the inversion hypothesis. It is feasible, though unlikely given the size of the
region, that suppressed recombination leading to chromosomal divergence could arise without a
chromosomal inversion (Bergero et al., 2008, 2007, 2013; Natri et al., 2013). For clarity in this
discussion we refer to the putative inversion found here simply as inversion.
In the population from the Netherlands, among the 2,296 birds analyzed after filtering, no
homozygous bird for the inversion on Chromosome 1A was found. Given that very large
inversions can cause homozygous lethality in songbirds (Tuttle et al., 2016), we investigated if
this great tit population has significantly fewer homozygous inverted birds than expected.
However, given the low frequency of the inversion, and assuming Hardy-Weinberg Equilibrium,
we would expect less than two homozygous inverted birds and it is thus unclear whether the
complete absence of homozygotes is due to a deleterious recessive effect of the inversion or
D
o
w
n
lo
a
d
e
d
fro
m
h
ttp
s:
//a
ca
d
e
mi
c.
o
u
p
.co
m/
g
b
e
/a
d
va
n
ce
-a
rt
icl
e
-a
b
st
ra
ct
/d
o
i/1
0
.1
0
9
3
/g
b
e
/e
vz1
0
6
/5
4
9
4
7
0
2
b
y
U
n
ive
rsi
ty
o
f S
h
e
ffi
e
ld
u
se
r
o
n
3
1
Ma
y
2
0
1
whether homozygotes are present in the population but not sampled in this study. A possible
lethal effect of this inversion could be tested by exploring the frequency of genotypes among
offspring of mated carriers. Given the structural complexity and large size of this inversion, a
relevant biological effect could be expected. A CNV complex located at the downstream
breakpoint encloses 32 genes involved in a wide range of biological processes, which could
significantly change the amounts of the transcripts/proteins due to copy number changes in the
genes located at the CNV complex. Future studies of this inversion polymorphism will be
directed to test the lethality hypothesis and to measure the relative fitness of wildtype
homozygotes, inversion carriers and inversion homozygotes. Indeed, this future goal was one
motivation for developing a cheap and quick method (based on PCR-RFLP) to more easily type
inversion karyotypes.
To identify the inversion without SNP array data, we selected the SNP with highest FST
value that concomitantly would produce a PCR-RFLP profile capable of distinguishing between
inversion carriers and non-carries. The selected SNP is located at the first intron of thePIK3C2G
gene, which is within the CNV complex at one of the putative inversion breakpoints. Along with
PIK3C2G, several other genes are also located in the CNV complex and these genes have crucial
roles in a broad range of processes from cell cycle to gene silencing (supplementary section 3.3
Genes overlapping the CNVR at the CNV complex). Resequenced birds showed a high number
of copies within that genomic region (≈10 copies in two inv-norm birds). Moreover, the
PCR-RFLP gel intensities support at least four genotypes (three for norm-norm and one for
inv-norm birds). Thus, this substantial copy number change in inv-norm birds could underlie
D
o
w
n
lo
a
d
e
d
fro
m
h
ttp
s:
//a
ca
d
e
mi
c.
o
u
p
.co
m/
g
b
e
/a
d
va
n
ce
-a
rt
icl
e
-a
b
st
ra
ct
/d
o
i/1
0
.1
0
9
3
/g
b
e
/e
vz1
0
6
/5
4
9
4
7
0
2
b
y
U
n
ive
rsi
ty
o
f S
h
e
ffi
e
ld
u
se
r
o
n
3
1
Ma
y
2
0
1
distinct patterns in gene expression and consequently phenotypic variation. Interestingly, such
complex rearrangements at inversion breakpoints have a key evolutionary roles in other species
e.g. an effect on malaria vectorial capacity in mosquitoes (Sharakhov et al., 2006).
A CNV complex located at the breakpoint seems to be older than the inversion. Assuming a
single origin for this complex, the CNV sequences may be older than the inversion given that it is
present in virtually all inv-norm birds whereas it occurs at low frequency in norm-norm birds.
More than 10% of the norm-norm birds have at least one CNV overlapping the CNV complex. In
addition, a repetitive structure is usually found at inversion breakpoints underlying their
mechanisms of formation (such as non-allelic homologous recombination - NAHR, Carvalho and
Lupski (2016); Hoffmann and Rieseberg (2008)). Thus, it is possible that the inversion is a result
of the CNV sequences, which underpinned the mechanism of the inversion formation. However it
remains possible that CNVs are present in the inversion only due to a hitchhiking effect and thus
did not necessarily contribute to the inversions formation. The hypothesis that CNVs might have
underpinned the formation of the inversion remains speculative and needs further investigation.
Considering the size of all CNVs associated with the inversion (i.e. complex with≈10 copies and
another complex of ≈10 copies with an additional region with ≈100 copies, identified by
sequencing) the inverted chromosome is estimated to be approximately 3.5 Mb larger than the
reference sequence reported in genome build 1.1. The greater length of chromosomes harboring
the inversion is in line with the hypothesis of degenerative expansion in young supergenes (Stolle
et al., 2018). However, genetic variation is not only present in the CNV complex but also at the
center of the inversion.
D
o
w
n
lo
a
d
e
d
fro
m
h
ttp
s:
//a
ca
d
e
mi
c.
o
u
p
.co
m/
g
b
e
/a
d
va
n
ce
-a
rt
icl
e
-a
b
st
ra
ct
/d
o
i/1
0
.1
0
9
3
/g
b
e
/e
vz1
0
6
/5
4
9
4
7
0
2
b
y
U
n
ive
rsi
ty
o
f S
h
e
ffi
e
ld
u
se
r
o
n
3
1
Ma
y
2
0
1
Allele phasing in inv-norm birds is challenging because phasing strategies like BEAGLE
assume Hardy-Weinberg equilibrium Browning and Browning (2007); this assumption is often
violated at inversion genotype-informative SNPs (i.e the vast majority of the
genotype-informative SNPs significantly deviate from HWE). Thus, we used the genotype
distribution (i.e. the proportions of “AA”, “AB” and “BB” genotypes) to partially explore the
haplotypes in the inversion. There are at least two (and perhaps three or more) putative inversion
haplotypes, which are reflected by the number of AA genotypes at the center of the inversion
(located at ≈20-55 Mb of the Chromosome 1A, Figure 3, note the log scale and three distinct
groups). In the LD analysis, only theR2
metric reflected the variation within inv-norm birds. This
variation derives from the SNPs that are located in the center of the inversion (i.e. LD block in the
center, Figure 2c and d). The R2
method has a constraint to deal with low frequency alleles
(Wray, 2005) whereas D′ is not highly dependent upon allelic frequencies (Hedrick, 1987).
Interestingly, in the inv-norm population, the frequency of the less common genotype in the
informative SNPs at the R2
LD block (Figure 2a) is not as low as in the rest of the inversion
(Figure 2b). Thus, the distribution of allele frequencies in the inv-norm birds may explain why the
R2
metric does not describe elevated LD, outside the center of the inversion, and is consistent
with the hypothesis of a higher recombination rate in the center. In other words, because the two
different LD measures are not equally sensitive to rare alleles, and because the allele frequencies
seem to be different in the center of the inversion than elsewhere, one metric finds a pattern that
the other misses. Presumably this is because occasional recombination has caused allele
frequencies and LD patterns to be slightly different in the center than in the rest of the inversion.
D
o
w
n
lo
a
d
e
d
fro
m
h
ttp
s:
//a
ca
d
e
mi
c.
o
u
p
.co
m/
g
b
e
/a
d
va
n
ce
-a
rt
icl
e
-a
b
st
ra
ct
/d
o
i/1
0
.1
0
9
3
/g
b
e
/e
vz1
0
6
/5
4
9
4
7
0
2
b
y
U
n
ive
rsi
ty
o
f S
h
e
ffi
e
ld
u
se
r
o
n
3
1
Ma
y
2
0
1
Due to the expected very low rates of recombination within the inversion in heterozygotes
(Kirkpatrick, 2010), we did not expect multiple haplotypes for the inversion. However, on
timescales of 105
generations or longer, even this limited recombination works as an important
source of variation within inversions (Kirkpatrick, 2010). Indeed, gene conversion and multiple
crossing overs, at least far from the breakpoints, are possible within inversions (Andolfatto et al.,
2001; Hoffmann and Rieseberg, 2008; Korunes and Noor, 2018). Thus, rare recombination events
may explain distinct haplotypes found in the center of the inversion. Moreover, as CNVs can
underlie mechanisms of formation and be prone to errors, independent inversion events and errors
during meiosis cannot be discarded.
It is unclear whether the inversion has any phenotypic effects. Nevertheless, the CNVs
identified by sequencing at the CNV complex directly overlap at least three genes, including
CALD1involved in smooth muscle contraction (Walsh, 1994),BPGMunderlying oxygen sensing
in blood cells (Petousi et al., 2014) and the above mentioned PIK3C2Ggene (the other 29 genes
overlap a CNVR in the same region but do not overlap partially CNVs identified by sequencing).
On other songbird species, such as the zebra finch (Taeniopygia guttata), sperm morphology and
motility is associated with an inversion in the Z Chromosome (Kim et al., 2017). Moreover,
inversions in zebra finches can have strong additive effects on several morphological traits and
increase mortality rates (Knief et al., 2016). In white-throated sparrows, which display different
plumage morphs and sexual behavior, a large inversion involving up to 1,000 genes and lethal in
its homozygous state, has a profound role in disassortative mating (Tuttle et al., 2016). However,
there is no evidence of distinct morphs in great tit. Thus, if the inversion is underlying any kind of
D
o
w
n
lo
a
d
e
d
fro
m
h
ttp
s:
//a
ca
d
e
mi
c.
o
u
p
.co
m/
g
b
e
/a
d
va
n
ce
-a
rt
icl
e
-a
b
st
ra
ct
/d
o
i/1
0
.1
0
9
3
/g
b
e
/e
vz1
0
6
/5
4
9
4
7
0
2
b
y
U
n
ive
rsi
ty
o
f S
h
e
ffi
e
ld
u
se
r
o
n
3
1
Ma
y
2
0
1
mate choice it may be reflected by a more subtle trait or behaviour. Apart from songbirds, large
inversions can underlie a number of phenotypes in nature, ranging from mimicry and crypsis in
butterflies and moths (Nadeau et al., 2016) to meiotic drive in mice (Lyon, 2003). Our detailed
characterization of the variability and complexity of this large inversion provides the foundation
for further studies aiming to discover the phenotypic effects and the evolutionary role of this
inversion.
Competing Financial Interests None.
Data deposition The raw genotype datasets used during the current study are available at NCBI
(https://www.ncbi.nlm.nih.gov/geo/query/acc.cgi?acc=GSE105131).
Acknowledgements VHS benefited of a joint grant from the European Commission within the framework
of the Erasmus-Mundus joint doctorate “EGS-ABG”. Part of this work was funded by an ERC Advanced
Grant (339092 - E-Response) to MEV.
Ethics approval This work was carried out under a license of the Animal Experimental Committee of the
Royal Dutch Academy of Sciences (KNAW) protocol NIOO-10.07.
Figure captions
D
o
w
n
lo
a
d
e
d
fro
m
h
ttp
s:
//a
ca
d
e
mi
c.
o
u
p
.co
m/
g
b
e
/a
d
va
n
ce
-a
rt
icl
e
-a
b
st
ra
ct
/d
o
i/1
0
.1
0
9
3
/g
b
e
/e
vz1
0
6
/5
4
9
4
7
0
2
b
y
U
n
ive
rsi
ty
o
f S
h
e
ffi
e
ld
u
se
r
o
n
3
1
Ma
y
2
0
1
Fig. 1: A) PCA:based on the SNPs located on Chromosome 1A, a principal component analysis revealed two distinct subpopulations. The distinction is given by Eigenvector One, which gave the initial evidence of
inversion carriers. B)FST: these two subpopulations display highly differentiated SNPs across the whole
of Chromosome 1A, except at regions near to telomeres. C) Heterozygosity:each subpopulation exhibits
a particular heterozygosity level across the Chromosome 1A. The inv-norm subpopulation has many SNPs
with high heterozygosity within the region bounded by the tentative breakpoints given byFST analysis (≈3
to 68 Mb, delimited by the red dashed lines). The purple dashed line represents the maximum expected in norm-norm birds. SNPs above this threshold are considered informative.
D
o
w
n
lo
a
d
e
d
fro
m
h
ttp
s:
//a
ca
d
e
mi
c.
o
u
p
.co
m/
g
b
e
/a
d
va
n
ce
-a
rt
icl
e
-a
b
st
ra
ct
/d
o
i/1
0
.1
0
9
3
/g
b
e
/e
vz1
0
6
/5
4
9
4
7
0
2
b
y
U
n
ive
rsi
ty
o
f S
h
e
ffi
e
ld
u
se
r
o
n
3
1
Ma
y
2
0
1
Fig. 2: The pairwise linkage-disequilibrium on the Chromosome 1A. A) D′ measured in 2,296 great
tits. B) D′ measured in 2,179 norm-norm birds. Figures in the lower panels (C and D) support possible
recombination events in the center of the inversion. In other words, possible recombination in the center of the inversion is supported by the distinct genotype distribution in comparison with the rest of the inversion
and confirmed byR2. AsR2metric has reduced power to detect LD among SNPs with low allele frequency,
the LD is reflected only in the center of the inversion.C)R2
measured in 2,296 great tits reveals an LD block only in the middle of the chromosome. The full inversion does not show elevated LD, due to the limitation
ofR2at dealing with low frequency SNP alleles outside the center of the inversion.D)Genotype frequency
of informative SNPs (heterozygosity >0.6) across Chromosome 1A in the inv-norm subpopulation. The
vertical dotted line roughly indicates the genomic region of middle block which harbors a higher number of
birds with “AA” genotypes when compared to the rest of the inversion. Along with the LD pattern fromR2
D
o
w
n
lo
a
d
e
d
fro
m
h
ttp
s:
//a
ca
d
e
mi
c.
o
u
p
.co
m/
g
b
e
/a
d
va
n
ce
-a
rt
icl
e
-a
b
st
ra
ct
/d
o
i/1
0
.1
0
9
3
/g
b
e
/e
vz1
0
6
/5
4
9
4
7
0
2
b
y
U
n
ive
rsi
ty
o
f S
h
e
ffi
e
ld
u
se
r
o
n
3
1
Ma
y
2
0
1
Fig. 3: Genotype distribution within/outside the center of the inversion (20-55 Mb) in inversion
carriers. The number of genotypes is represented on a log2 scale to improve the visualization but
untransformed values are shown on the upperx-axis. Based on the number of “AA”genotypes it is possible
to identify inv-birds birds which harbour a different genotype distribution at the center of the inversion and therefore possibly have different inversion haplotypes (black bars among the dashed lines).
D
o
w
n
lo
a
d
e
d
fro
m
h
ttp
s:
//a
ca
d
e
mi
c.
o
u
p
.co
m/
g
b
e
/a
d
va
n
ce
-a
rt
icl
e
-a
b
st
ra
ct
/d
o
i/1
0
.1
0
9
3
/g
b
e
/e
vz1
0
6
/5
4
9
4
7
0
2
b
y
U
n
ive
rsi
ty
o
f S
h
e
ffi
e
ld
u
se
r
o
n
3
1
Ma
y
2
0
1
Fig. 4:CNVs in the inversion breakpoint. A)CNV frequency across the Chromosome 1A and the genomic
interval of the previously identified CNV region ‘2802’ (≈64.83-67.67 Mb, da Silva et al. (2018)), which is
located at the inversion breakpoint.B)FST values across the chromosome. A red circle is highlighting the
SNP used to the PCR-RFLP analysis. C)A CNV in the inversion breakpoint is present in the vast majority
of inv-norm birds whereas is rarely found in norm-norm birds. D) Digestion pattern of the PCR-RFLP
at the SNP AX-100689781. The black bars represent the expected gel patterns alongside each of the two observed patterns in each subpopulation (i.e. norm-norm and inv-norm). Distinct copy number genotypes are evidenced by the allele intensities in the gel after electrophoresis. The values above each gel picture depicts the fingerprint name and the degree of confidence to tag a specific karyotype state (i.e. percent of the birds with concordant inversion genotype between SNP array and PCR-RFLP). Green was used in highly confident profiles, blue in the medium confidence one and red for B4, which has high heterozygosity (expected in inv-norm) but was only identified in two norm-norm birds. To differentiate between fingerprints note the distinct intensities of subsets of bands; between B1 and B2 the greatest difference is mainly at the 300/169 bp bands and between B3 and B4 the greatest difference is between the 469/300 bp bands.
D
o
w
n
lo
a
d
e
d
fro
m
h
ttp
s:
//a
ca
d
e
mi
c.
o
u
p
.co
m/
g
b
e
/a
d
va
n
ce
-a
rt
icl
e
-a
b
st
ra
ct
/d
o
i/1
0
.1
0
9
3
/g
b
e
/e
vz1
0
6
/5
4
9
4
7
0
2
b
y
U
n
ive
rsi
ty
o
f S
h
e
ffi
e
ld
u
se
r
o
n
3
1
Ma
y
2
0
1
Fig. 5: Representation of the whole Chromosome 1A with the complex structural rearrangement in
the downstream breakpoint of the inversion.Blocks in grey represent the inversion region whereas those
in black are genomic regions outside the inversion. CNVs identified by sequencing in the two inv-norm birds which were sequenced are labeled as CNV1-3 for simplicity. Horizontal curly brackets define the structural complex which encompasses CNVs 1-3. The above chromosomal representation displays the chromosome as shown in the reference genome (Laine et al., 2016). The below representation displays the expected genomic structure in the inversion. CNVs are relatively larger than their real length for schematic purposes.
D
o
w
n
lo
a
d
e
d
fro
m
h
ttp
s:
//a
ca
d
e
mi
c.
o
u
p
.co
m/
g
b
e
/a
d
va
n
ce
-a
rt
icl
e
-a
b
st
ra
ct
/d
o
i/1
0
.1
0
9
3
/g
b
e
/e
vz1
0
6
/5
4
9
4
7
0
2
b
y
U
n
ive
rsi
ty
o
f S
h
e
ffi
e
ld
u
se
r
o
n
3
1
Ma
y
2
0
1
References
Andolfatto P, Depaulis F, Navarro A. 2001, feb. Inversion polymorphisms and nucleotide
variability in Drosophila. Genet. Res. (Camb). 77(01).
Bergero R, Charlesworth D, Filatov DA, Moore RC. 2008, apr. Defining Regions and
Rearrangements of the Silene latifolia Y Chromosome. Genetics. 178(4):2045–2053.
Bergero R, Forrest A, Kamau E, Charlesworth D. 2007, feb. Evolutionary Strata on the X
Chromosomes of the Dioecious Plant Silene latifolia: Evidence From New Sex-Linked Genes.
Genetics. 175(4):1945–1954.
Bergero R, Qiu S, Forrest A, Borthwick H, Charlesworth D. 2013, jul. Expansion of the
Pseudo-autosomal Region and Ongoing Recombination Suppression in the Silene latifolia Sex
Chromosomes. Genetics. 194(3):673–686.
Bishop R. 2010, mar. Applications of fluorescence in situ hybridization (FISH) in detecting genetic
aberrations of medical significance. Bioscience Horizons. 3(1):85–95.
Bosse M, Spurgin LG, Laine VN, Cole EF, Firth JA, et al. 2017, oct. Recent natural selection
causes adaptive evolution of an avian polygenic trait. Science. 358(6361):365–368.
Branca A, Paape TD, Zhou P, Briskine R, Farmer AD, et al. 2011, sep. Whole-genome nucleotide
diversity, recombination, and linkage disequilibrium in the model legume medicago truncatula.
Proceedings of the National Academy of Sciences. 108(42):E864–E870.
D
o
w
n
lo
a
d
e
d
fro
m
h
ttp
s:
//a
ca
d
e
mi
c.
o
u
p
.co
m/
g
b
e
/a
d
va
n
ce
-a
rt
icl
e
-a
b
st
ra
ct
/d
o
i/1
0
.1
0
9
3
/g
b
e
/e
vz1
0
6
/5
4
9
4
7
0
2
b
y
U
n
ive
rsi
ty
o
f S
h
e
ffi
e
ld
u
se
r
o
n
3
1
Ma
y
2
0
1