Rochester Institute of Technology
RIT Scholar Works
Theses
Thesis/Dissertation Collections
5-1-1997
A study in how the ink set, solid ink density and
screening method influence the color gamut in four
color process printing
Mattias Andersson
Follow this and additional works at:
http://scholarworks.rit.edu/theses
This Thesis is brought to you for free and open access by the Thesis/Dissertation Collections at RIT Scholar Works. It has been accepted for inclusion
in Theses by an authorized administrator of RIT Scholar Works. For more information, please contact
Recommended Citation
A study in
how
the
ink
set,
solid
ink
density
and
screening
method
influence
the
color
gamut
in
four
color
process
printing
by
Mattias Andersson
A
thesis
submittedin
partialfulfillment
ofthe
requirements
for
the
degree
ofMasters
ofScience
in
the
School
ofPrinting
Management
andScience
in
the
College
of
Imaging
Arts
andScience
ofthe
Rochester Institute
ofTechnology
May
1997
School of Printing Management and Sciences
Rochester Institute of
Technology
Rochester, New York
Certificate of Approval
Master's Thesis
This is to certify that the Master's
Thesis of
Mattias Andersson
"With
a major in Printing Technology
has been approved by th
e Thesis Committee as
satisfactory
for the thesis requirement for the Masters of
Science degree
at the convocation of
May 20,1997
Thesis Committee:
Joseph L.
Noga
T
hesis advisor
Joseph L.
Noga
Graduate
Progr
a
m
Coordinator
Pemzission
granted
A study
in how the
ink set, solid
ink density
and screening
method influence the color
gamut in
four
color
process
printing.
I, Mattias Andersson, hereby
grant
permission to the Wallace Library
of
the Rochester
Institute
of
Technology to
reproduce my
thesis in whole
or
in part. Any reproduction
will
not be for commercial us
or
profit.
Acknowledgements
This
thesis
would nothave been
possible without greatcontribution ofmy
researchadvisor,
Franz
Sigg,
professor atSchool
ofPrinting
Management
andScience
atRochester
Institute
oftechnology.
In
addition, I
wouldlike
to thank
thefollowing
peoplefor
their
help:
Gustav
Braun,
researcher atCenter for
Imaging
Science,
Rochester Institute of Technology.
Stefan
Gustavson,
researcher atLinkb'ping
University,
Linkbping
Sweden.
J.
A.
Stephen
Viggiano,
seniorImaging
Scientist
RIT
Research
Corporation,
Rochester
New York.
Joseph
L.
Noga,
professoratSchool
ofPrinting
Management
andScience,
Rochester
Institute
of
Technology.
Richard
Holub,
Graphics
artsconsultant,
Imagicolor,
Rochester
New
York.
Jonathan
Aber,
Marketing
manager atDayGlo
Inc,
Cleavland Ohio.
Christopher J.
Ryan,
Sales
representative atCohber
Press,
Rochester
New
York.
Frank
Cost,
professoratRochester Institute of
Technology
.Don
Hutcheson,
Graphics
artsconsultant,
Hutchcolor,
Washington
D.C
Sven-Olof
Sundstrom,
professoratDalarna
University,
Borlange Sweden.
James
Monteleone,
ink
andpaperanalyst atthe
Technical
&
Education
Center,
Rochester
Institute of
Technology
Al
DiBernando,
Pantone Inc. Carlstadt New Jersey.
Serge
N.
Matveyev,
Graphics
aitsconsultant,
Kazan Russia.
Bruno
Schrappe,
graduatestudentatRochester
Institute of
Technology.
Roberto
Gracia,
graduate student atRochester Institute
of
Technology.
Daniel
Gramlich,
Press
operatorRochester
Institute
of Technology.
Rob
Jellison,
undergraduatestudent andpressoperatoratRochester
Institute
of
Technology.
Kris
Greenizen,
Rochester
Institute of Technology.
Hart
Swischer,
Hammer
litho,
Rochester
New York
Stefan
Menningh, Tetterode,
The
Netherlands.
Ralph
Brantenaar,
VISU
Technologies,
The
Netherlajtds.
Roy
Berns,
professoratCenterfor
Imaging
Science,
Rochester
Institute
of
Technology.
Johan
Granas,
researcheratMoDo
Paper,
Omskbldsvik
Sweden.
Table
of
Contents
Abstract
ix
Introduction
1
Theoretical Bases
ofthe
Study
8
Spectral Reflectance
ofInks
8
Solid Ink
Density
14
Screening
15
Literature
review22
Hypothesis
27
Methodology
28
The
Ink
Sets Used
In
The
Experiment
29
Printability
Test
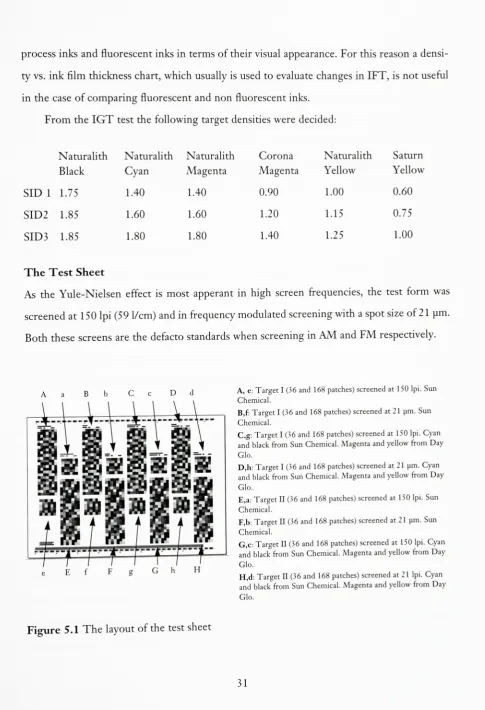
30
The Test
Sheet
31
Randomization
Of The
Experiment
32
The
Press Run
34
Measuring
The Target
38
Calculating
The Color
Gamut
38
Visualization
Of The Color
Gamut
41
Results
42
Estimation
Of
Color Gamut Variation
42
Statistical Analysis
43
Observations From The 3D Renderings
50
Conclusions
"^List
of
tables
Table
2.1
Difference
in
total
border line between
amplitude modulated andfrequency
modulated screening.
Table
5.1
The basic CMY
combinationsusedin
the
168
patch color gamuttarget.Table
5.2
K is black
andFactor
is
thevaluethat
is
multiplied withtheCMY
percentagesto
makea gradual changefrom full
saturationtowhite.Table
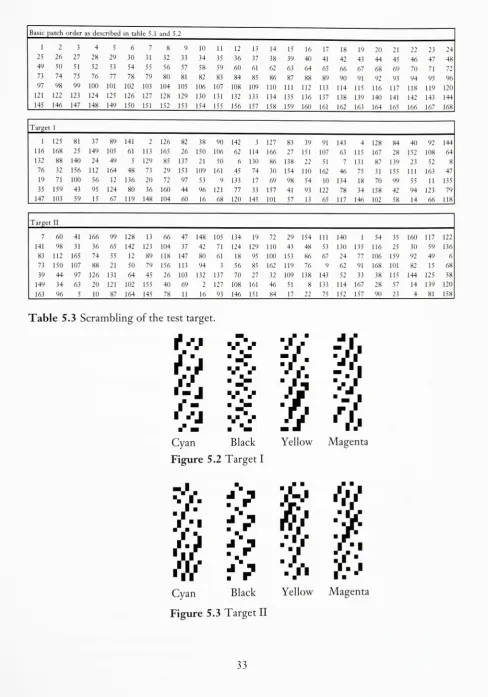
5.3
Scrambling
ofthe
testtarget.
Table
6.1
The
increase in
gamutvolume whenchanging
solidink
density
screening
andink
set.All
valuesin
CIELAB
volume units.Table 7.1.
Summary
ofthe
changein
color gamut volumein
the twelve
different
paraList
of
figures
Figure 1.1
The
three
dimensions
in
CIELAB
andthe
coordinatesfor
a sample color.Figure
2.1
Comparison
between
real andideal
cyan.Figure
2.2
Comparison between
realandideal
yellow.Figure
2.3
Comparison between
realandideal
magenta.Figure
2.4
The
total
color gamutis
derived
by
adding
the
six maindivisions.
Figure 2.5
Difference
in
color gamutwhencomparing
press sheets printed withthe
CMYK inks from he Hexachrome
ink
set with normal processinks.
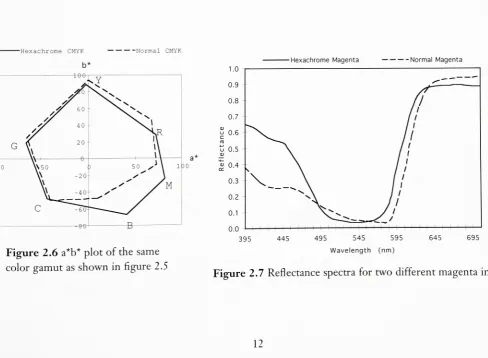
Figure
2.6
a*b*plot of
the
same color gamut as shownin
figure
2.5.
Figure 2.7
Reflectance
spectrafor
two
different
magentainks.
Figure 2.8
Gamut
volumebetween
high,
medium andlow SID levels.
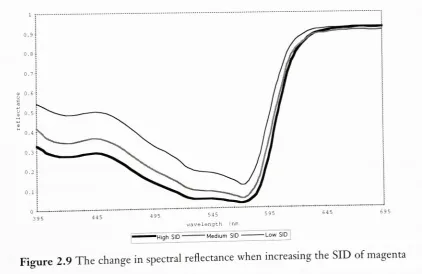
Figure
2.9
The
changein
spectral reflectance whenincreasing
the
SID
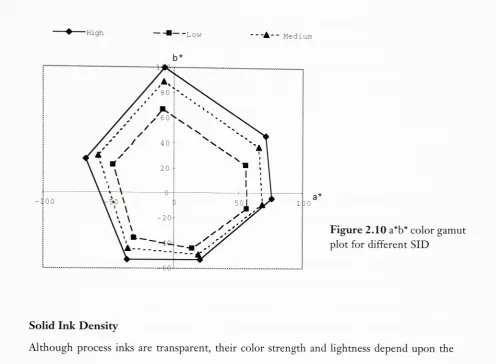
of magenta.Figure 2.10
a*b*color gamut plot of
different SID.
Figure
2.11
Diffusion
and reflection oflight
whenincident
on paper.Figure
2.12
Comparison between
magentatint in FM
andAM.
Figure
2.13
The
area of aAM
rasterdot.
Figure
5.1
The layout
ofthe testsheet.Figure
5.2
Target
I
.Figure 5.3
Target II.
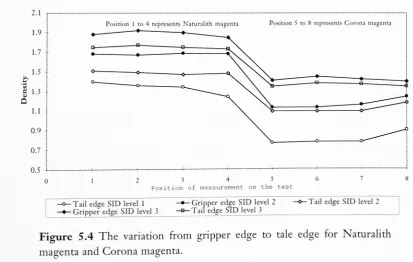
Figure 5.4
The
variationfrom
gripper edgeto tale
edgefor
Naturalith
magenta andCoro
na magenta.
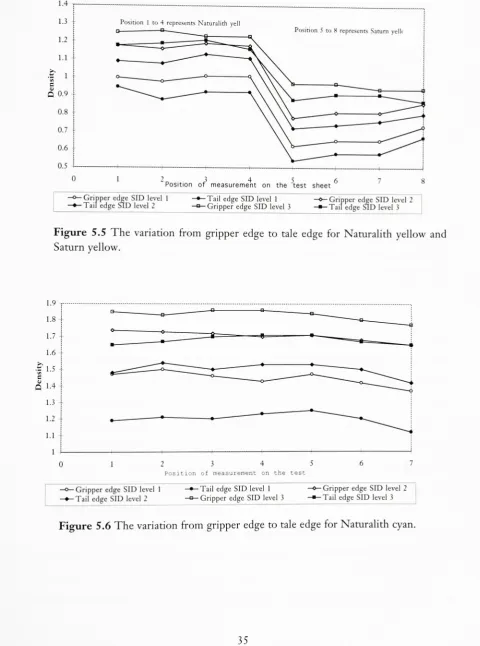
Figure
5.5
The
variationfrom
gripper edgeto tale
edgefor Naturalith
yellow andSaturn
yellow.
Figure 5.7.
The
variationfrom
gripper edgeto tale
edgefor Naturalith black.
Figure 5.8.
A
three
dimensional
representation
ofV,.
Figure 5.9.
The
patch placement usedto
calculatethe total
color gamut.Figure
6.1
"Physical"and"imaginary" replications.
Figure
6.2
The
color gamut variationamong
the
colorgamutreplicationsfor
thestandard
ink
set.Figure
6.3
The
color gamut variationamong
the
color gamutreplicationsfor
the
alternative
ink
set.Figure 6.4
Comparison between AM
andFM
when printed withthe
standardink
set atthe.
first
solidink
density
level. The data
representsthe average ofthetwo
replications.
Figure
6.5
Comparison between AM
andFM
when printed withthe
standardink
set atthe
second solidink
density
level. The data
representsthe
average ofthe
tworeplications.
Figure 6.6
Comparison
between AM
andFM
whenprintedwiththe
standardink
set atthe third
solidink
density
level. The data
representsthe
average ofthe
two
replications.
Figure 6.7
Comparison
between
AM
andFM
when printed withthe
alternativeink
setat
the
first
solidink
density
level. The data
representsthe
average ofthe two
replications.
Figure
6.8
Comparison between
AM
andFM
when printed withthe
alternativeink
setat
the
secondsolidink
density
level. The data
representsthe
average ofthe
two
replications.Figure
6.9
Comparison between
AM
andFM
when printed withthe
alternativeink
setat
the
thirdsolidink
density
level. The
data
representsthe
average ofthe
two
replications.Figure
6.10
How
anincrease in
solidink
density
changesthe
color gamutfor
the
standard ink
set.Figure 6.11
How
anincrease in
solidink
density
changesthe
color gamutfor
the
alternative
ink
set.Figure
6.12
Gamut
renderings ofthe
difference between AM
andFM
screening
whenprinted at
the
first
density
level
withthe
standardink
set.Figure
6.13
The
changein
color gamut whenboth
the
solidink
density
is
increased
andwhen
FM screening
is
used.Figure 6.14
Gamut
renderingsofthe
difference between
AM
andFM screening
at thethird
density
level
printed withthe
standardink
set.Figure
6.15
The difference
in
color gamutbetween
the twoink
sets when printed atthefirst
density
level
and screenedin
AM.
Figure 6.16
The difference
in
color gamutbetween
the two
ink
sets.Abstract
The
number of possible reproducible colorsin
aprinting
methodis
calledthe
color gamut.This
gamutis
the
range of colors aroundthe
spectrum andfrom light
to
dark
that
are availablein
the
process.Previous
researchhas found
that the three
parameters,
spectralreflectanceofthe
ink,
solidink
density
level
and screening
method,
allinfluence
the
gamutin
process color printing.This
thesis evaluatedhow
much
these
parameters changethe color gamutboth
asindividual
parametersandin
combination.
A
test target
with168
patchesin
the
mostsaturated combinations ofcyan, magenta,
yellow
andblack
was printed and measured with a spectrophotometer.The
three coordinatesL*,
a*andb*
for
each patchin
the target
was plottedin
the
CIELAB
space.Connecting
thesepoints
forms
athree
dimensional
object,
the
color gamut volume.By
calculating
the
volume ofthis
objectthe
number ofCIELAB
combinationsthat
canbe
reproducedin
the system wasderived.
The
pressrun wasmade atthree
levels
of solidink
density
andthe targets
were screenedusing
frequency
and amplitude modulated screening.The
print was made on the sixcolorHeidelberg
Speedmaster
72
sheetfed
lithography
press atSchool
ofPrinting
Management
and
Science,
Rochester Institute
ofTechnology.
The inks
thatwereusedin
thetest
print arethe
Naturalith
processcyan, magenta,
yellow
andblack from
Sun Chemical.
In
additionto
these,
afluorescent
magentaandyellowink
from
DayGlo's ink
seriesStarfire
were used.These
alternativemagenta and yellowinks
wereprinted with
the
Naturalith
cyan andblack.
In
this
way
two
four
color processcombinationswere evaluated with
only
sixinks. The
prints where made onaglossy
coatedpaper,
Cenrura
Gloss from
Consolidated Paper Inc.
The
resultshowthat:
Fluorescent inks
canbe
usedin
process colorprinting
andthat
they
produced a color gamutthat
reproducelight
and more colorful colors than normalprocesscolors,
whiledark
col orswerereproducedwithlower
colorfulness.The fluorescent inks
that
were used are semitransparent
and can not yield adark
black
when printed on
top
ofblack. The
solutionis
touse ahigh degree
of under color removal and orto
printing black
asthe
last down
ink.
High
solidink
densities
wasfound
to
increase
the
color gamutfor both
ink
sets.Frequency
modulatedscreening
wasfound
to
reproduce a color gamut withsignificantly
higher
gamutfor
the
normal sheetfed
inks,
while noincrease
couldbe found for
thefluo
rescent
inks.
By
using
frequency
modulatedscreening
andincreasing
the solidink
density
whenusing
normal sheetfed
ink,
the color gamut couldbe
increased
about30
percent comparedto
amplitude modulatedscreening
andSWOP
solidink densities.
The
Silicon
Graphics
based
3D
softwareExplorer
wasfound
tobe
avery
useful toolwhenChapter
1
Introduction
In
the beginning of the 1990s graphicsarts expertDon
Carli
and consultantMills Davis
coined aterm
for high quality
colorreproduction,
HiFi Color. Mills
Davis
has described
the
conceptofHiFi Color
in
the
following
way:The
essencesof
HiFi Color
is
a visibledifference
-a visu-al edge.
HiFi
Color is
to
print:what stereo audiois
to mono soundbetter
quality;
whathigh-octane
gasolineis
to
automotivetravel
-superior
peifoivnance;
andwhat cappuccino
is
to
regular coffee-added value.1
By
definition,
HiFi
Color
is
color reproduction with a color gamutthat
is larger
thanfor
normal process color printing.
The first
HiFi
Color
techniques used extra process colorsto
achieve a
higher
colorfidelity. Because
ofthis, HiFi
Color is
often misunderstood as a processthat
need extra colors.In
this thesis
it
willbe described
how
three
print parameters canincrease
the color gamut.Without
the
economical and technicalinconvenience
of extraprocess colors
A 4+ ink
set thathas become
adefacto
standardis Pantone's Hexachrome ink
set.This
is
a processink
set with sixcolors, cyan,
magenta,
black,
yellow,
green and orange.Hexachrome
has
oftenbeen
misunderstood as anink
setthatuses"two
extra"
inks,
green andorange,
andthat the
otherinks
are normalcyan, magenta,
yellow andblack.
However,
magenta and yellow
have
moreideal
reflection than the normal processink
sets,
resulting in
cleaner colorcombinations.
Cyan
andblack
have
aslightly
higher
pigmentconcentration.Just
by having
ahigher
printable colorgamut,
is
of course no guaranteethat the printed
result will
be high
fidelity;
it
alsodepends
onthe
separations.Separations consisting
of morethan
four
colors arebecoming
availablefrom
several manufacturers.One
ofthe
morelar
color separation softwareprograms
is ICISS from VISU Technologies. Other
software
solutions are
Hyper Color from DuPont
andederMCS
from Linotype-Hell.
Since Carli
andDavis
coinedthe
HiFi Color
term there
has been
muchtalk
aboutit
atgraphics arts
trade
shows and at seminars.However,
there
have been few
implementations in
regular
production,
notto
say
that
it is
not usedat all.Several
high quality
reproduction andprinting
companies useit
aroundthe
world,
but HiFi Color
is
facing
technical
and economical
problems.The basic
problemis
that
morethan
four
colorsare used.4+
color productionincreas
es
the
costofequipmentinvestments
andin
production.A
separation software andproofing
system
that
canhandle
morethan
four
colorsis
needed.As
the
color spaceis
larger
thannormal
the
image
has
to
be digitized
in
a color spacethat
can utilizethe
larger
printable gamut.If
the
image is
separatedin
the
scannerto
CMYK,
the
out of gamutcolorswillbe
compressedinto
the
CMYK
gamut,
giving
no usefor
theincreased
printable color gamut.Many
professional
drum
scanners arehardware separating
and can not scan adigital
image in RGB.
When
the
job
is
ready
for
the
press,
apresswith six or more unitsis
neededto
makethe
production somewhat economical.
The
press operatorhas
to
register and setup
the
inking
for
sixprinting
unitsinstead
offour.
For
good control ofthe
solidink
densities
ofthe
extrainks
either adensitometer
with colorfilters
that
correspondto the
complimentary
colors ofthe
printing inks
has
to
be
usedor a spectrophotometeris
required.Again,
newinvestments.
But
evenif
allthe
equipmentis
purchasedthe
big
problemis
still ahead.How
shouldthe
six,
seven or eight
inks
be
usedto
makea good separation?Scanner
operators are accustomedto
scanin
CMYK.
They
know how
the
highlight
andshadow placement
is
done
withCMYK.
They
know
how
the
CMYK
values shouldbe
changed
in
orderto
do
color correctionto the
customers wishes.In
RGB,
all changes areindirect
withthe
image
being
separatedin
alater
step.This
makes precision correctionsin
RGB
almostimpossible.
The
visual appearance onthe
particular monitoris
more usefulthan
RGB
values.Therefore,
problems with monitor calibration comeinto
play.glob-alcolor
correction
aswellashighlight
and shadow placementwiththe
same set of colorsthatwill
be
usedin
the
final
separation.
But
this
does
notmakeit
mucheasier.Lets
take
an example.
A
scanner operatorknows
that
agoodskintone
shouldbe
reproduced with:10 %
cyan,
20 %
magenta,
20 %
yellow and6 % black.
Traditionally
the
scanner operator could make aselective color correction
to
makethe
skintone toward the
reddish sideby increasing
magenta
and orreducing
yellow.If
the tone
shouldbe
darker,
more cyan couldbe
added.Every
thing
is
quiteunderstandable.
In
aHexachrome
separationthe
same skintone
colormay
be
madeup
withthe
follow
ing
combination(called Hexadecimal):
10 %
cyan,
10
%
yellow,
13 %
magenta,
30 %
orange,
3 %
green and3 %
black. How does
that
colorlook
when printed?A
proofhas
to
be
madeto
find
outthat the
skintone
is
too
"orange".
In
normalCMYK,
a color correctionlike
this
is relatively
easy,
but how
shouldit
be done
in
Hexadecimal
?
Should
thecorrectionbe
madein
only
theorange or should magentabe
increased? How
do
theyellowand orangeinteract?
How
does
the
greenink
influence
the
otherinks
in
this
skintone?
With
the
experience ofdoing
Hexachrome
separationsthe
author can statethat this
is very
difficult
to
determine.
This
is
one ofthe
main problems whenchanging
to
morethan
four
processinks. It
is
notatechnical
problemin
Hexachrome,
but
the
problemis
that the
useris
not usedto
specifying
process color mixes
in
six or more colors.This
of courseis
something
that
canbe learned
overtime,
but
as wehave five
chromatic primariesto
understand,
it is
muchharder
tolearn
the
function
ofthebasic
primaries:cyan, magenta,
and yellow.Further
technicalinconvenience
is
present through the workflow which makesit
moreexpensive
to
make separations with more thanfour
colors.Here
are some examples:The digital
image
files
willincrease
linear
to the
extra number ofinks.
Difficulties
to
separateimages
tobe
printedin
amplitudemodulated screening.New proofing
materials are needed.The
time
for
making
proofs arelinearly
increased
withthe
number of colors.The
printing
cost willbe
increased,
especially if
the
job
is going
to
be
printed withtwo
runsThere
arefew ICC
profilegenerating
application that
fully
supports4+
colorseparation.Digital proofing devices
are not yetavailable
for
morethan
four
colorsBecause
ofthese problems separations
withHexachrome
is
not aseasy
asit
may
seem.There
is a need
for
alot
ofexperimentation
to generate predictable
results.
It
wouldbe
mucher
if
HiFi Color
couldbe
madewithjust four
inks,
andit
can!There
are severalmethodsincrease
the
color gamut withoutusing
morethan
four
processinks.
Some
ofthe parameterseasi-to
are:
Process inks
with moreideal
reflection and absorption ofthe
light.
Increased
solidink
density
(SID).
Screening
method.Use
offlourecense
in
the
printing inks.
Increased
transparency
oftheink.
Better
wettrapping.
Higher
paperquality.Higher
pigment concentrationin
the
ink.
To
test
allthese
parameters was notpossiblewiththe
limited
time
for
this thesis
work.For
this thesis
it
weredecided
to
investigate
how
the
ink
set,
solidink
density
(SID)
andscreening
methodwould change thecolor gamut.
To determine how
thesethree
parametersinfluence
the
gamut,
atest
print was made ona sheet
fed
offset press withtwo
CMYK
ink
combinations.As
a reference anormal sheetfed
process
ink
setfrom Sun
Chemical,
was used.This
ink
set wascolorimetrically
comparedwith a process
ink
set where yellow and magenta are changedto
inks
with moreideal
reflection,
but
withblack
and cyan unchanged(for
reasonsthat
willbe
described
in
moredepth
later). Both ink
sets were run atthreelevels
ofSID. For
eachSID
andink
setatest target
wasIn
orderto
quantify
the
color gamutof apress a printedtest target
has
to
be
measured.
The best known
methodmeasuring
coloris
with a spectrophotometer.This
instrument
detects
the
reflectance overthe
visible spectrumand quantifiesit
as a reflection percentageof
the
incident light illumination. The
spectrophotometric
reflection canthen
be
usedto
calculate a
three
value measurement.There
are several color spacesbut CIELAB
is
the mostfrequently
usedin
the
graphicsarts.Each
coloris
presentedwiththree
values,
lightness
(L*),
redness/greenness
(a*)
and yellowness/blueness(b*). These
values areby
definition
threecoordinates and can
be
placedas a pointin
athree
dimensional
space,
seefigure
1.1.
By
measuring
the
colors withhighest
colorfulnessin
a color visualizationprocess,
such asprocess color
printing,
the
CIELAB
three
dimensional
points canbe
connectedto
form
athree
dimensional
body,
the
color gamut volume.A
test
targetwas usedto
measurethe
gamutthat
each combination ofthe parametersgenerate.
The
test target
includes
patches thatresultedin
colorsthat
arelocated
onthe
surface
ofthe
colorgamut,
andthey
were measured with a spectrophotometer.The
volume ofthe
color gamuts werethen
calculatedin
turns ofCIELAB
volume units.The
color gamutsizes were
then
comparedto
each other so thatit
couldbe derived
how
theparametersinflu
ence
the
colorgamut.To be
able tovisualizehow
thegamutchanges,
threedimensional
plotswere made of
the
color gamutsto
determine
graphically
how
the parametersinteract
withthe
color gamutthatwere produced.
The fact
thatonly CYMK
was used eliminatesmany
oftheproblemsthat
wasdescribed
previously
for
4+ HiFi Color
printing.Scanners
that
arehardware separating
canbe
used,
if
the scannerparametersare setto
thenewprintspecifications.
rr^r- ci u
^^a
Figure 1
.1
The
threedimensions
in
ICC
profiles canbe
used. &CIELAB
and thecoordinatesfor
aColor
correctionis
easier andmore understandable.Proofing
withdigital
proofersis
possible.The
resultsfrom
this thesis
have
madeit
possibleto
recommend whichink
setto
use,
how
the
SID
shouldbe
set and with whichscreening
method theimages
shouldbe
screened,
toensure that
the
highest
possible color gamut canbe
achieved,
withoutthe needto
use addiEnd
notes1. Mills
Davis,
"HiFi
Color"Chapter
2
Theoretical
Bases
of
the
Study
t
I
A
his chapter will present how the spectral reflectance ofthe
ink
set,
Solid Ink
Density
(SID)
andscreening
method effect the color gamut.To
the
author's
knowledge
there
has been
no research onhow
these parametersinteract.
Spectral
Reflectance
ofInks
Ideal printing
inks do
not exist.All inks
have
some unwanted absorption oflight.
Printing
inks for
process color reproduction canbe divided
in
two
main parts:black
ink
and chromaticinks.
There
areseveralkinds
ofblack ink
on themarketand theirfunction is
oftento
absorbasmuch of
the
visual spectrumas possible.Chromatic inks
aredifferent.
They
are made so thatonly
a part ofthe visiblelight
is
absorbed,
whilethe
restofthe
light
shouldbe
unchanged sothat
it
can reflect onthe
papersurface
back
again throughthe
ink. The ink
functions
as afilter for light.
In
contrastto
wallpaint,
the
chromatic processprinting inks
are madeto
be
transparent.The
reasonis
that
process color
printing
relies onthesubtractive colortheory.If
layers
of magentaand cyan areover
printed,
the
light
willbe filtered
through each oftheseinks,
andnormally
both
whenincident
onthepaper,
and again ontheway
back
to
theobserverafterreflecting
offthepaper.The
resultis
a color thatis
a mixture ofthe twoprimaries,
asecondary
color or overprintcolor.
According
to
calculations madeby
Schlapfer
andWidmer,
thelargest
number ofcolors-Cyanmeasu
only
about35
percent ofthe
ideal
vol-Figure 2.1Comparison between
realand
ideal
cyan.ellowideal
Figure 2.2 Comparison
between
realand
ideal
yellowFigure 2.3 Comparison between
real andideal
magentaume.
The
reasonis
that
the
spectralreflectance
from
cyan,
magenta and yellow
arefar from
perfect.Yellow is
normally
closeto
theideal,
but
cyan andespecially
magenta are skewedfrom
theideal.
Cyan
is
bluer
than
it
shouldbe,
i.e.
with
little
reflectance of greenlight.
Magenta
is
too
reddue
tohigh
absorp
tion of
blue light
when compared to theideal.
For
thisreasonthe
cyanink
is
oftenreferred to as
being
contaminated withmagenta,
andthemagentaink
as contaminated
with yellow.If
purerinks
couldbe
usedthecolorgamut would
be
extended.In
figure
2.1
to2.3.
theideal
CMY inks
are compared to the mean of ten ran
domly
chosen controlbars,
printed withnormal process
inks. In
these chartsit is
clear that magenta and cyan
is
far
from
the
ideal
curve.The ideal
primarieshave
been
calculatedby
Schlapfer
andWid-mer.2
By
measuring
the
primary
colors,
the
three
two-coloroverprintcolors,
andblack,
the color gamut canbe
approximated with a
formula
that
Schlapfer
andWidmer
described
in
the
previously
Sv
=V
abs
L*2
a*2
b*2
1
L*3
a*3
b*3
1
L*4
a*4
b*4
1
(2.1)
J
The
color gamut volume isdivided
in
six parts and calculatedwith
formula
2.1.
These
volumesare
then
addedtogether to
derive
the
complete gamut volume.L*h
a*1;
b*,
andL*2,
a*2,
b*2
arethe
CIELAB
coordinates
for
the
substraterespectively black.
L*3,
a*3,
b*3
andL*4,
a*4,
b*4
arethe
CIELAB
coordinates
for
the
primary
and overprint(red,
green andblue)
colors
in
the
following
order:White
L*3,
a*3,
b*3
L*4,
a*4,
b*4
Vi
yellow red(yellow
+magenta)
v2
red(yellow
+magenta)
magentav3
magentablue
(magenta
+cyan)
v4
blue (magenta
+cyan)
cyanv5
cyan green(cyan
+yellow)
v6
green(cyan
+yellow)
yellowFigure 2.4
The
total
color gamutis
derived
by
adding
the
six maindivisions.
In
figure
2.4,
animaginary
3D
view of a color gamutis
shown.The
volume producedfor
CIELAB
coordinatesfor
paperwhite,
black,
blue (cyan
and magenta overprinted)
andmagenta
forms
afour
sided volume(Vj).
By
adding
the
six possible volumesVi
to
V6
thetotal
volume canbe
calculated.As
these
arethe
patchesthat
normally
are presentin
the
process controlpresstarget,
it
is relatively easy
to
calculatethe
gamutfor any
printed sheet.The disadvantage is
that the
formula is
rather simplified.It
assumes thatthe
gamutbetween
the
measured patches areendof
this
chapter,
willtend to
be
non-linear,
depending
onthe
paper andscreening
processused.
Although
formula
2.1 is
not a preciseway
ofcalculating
the
completegamut,
it
canfunction
as a goodtool to
comparethe
increase
in
gamutwhenchanging
the
ink.
Preliminary
experimentsThis
author ofthis thesis
has
made somepreliminary
experimentsby
measuring previously
printed color
bars.
The
sevenkey
patches ofthe
process control presstarget
printedboth
with normal sheet
fed
processinks
andwiththe
CMYK
processinks
from
theHexachrome
scale were measured
by
this
author,
andthe
volume calculated withformula 2.1. The
readings indicated
a65
percentincrease
in
the
color gamutin
the regionfrom
redto
cyan.Fig
ure
2.5
showsthe
gamutfor
the
sixkey
regions as calculated withformula
2.1.
The
reasonfor
the
larger
gamutis
that the
Hexachrome
magentaink
has
a muchhigher
reflectionin
the
blue
portion ofthe
spectrum and alsohigher
absorption ofgreenlight. See
fig.
2.7
Another
viewofthe
spectrumis
the
a* b*plot which
today
is
the
mostcommonly
used.Although
this
is
atwo
dimensional
projectionthat
does
notinclude information
aboutlight
ness,
it is
a methodto
visualizethe
color gamut.In
figure
2.6
the a* b*of
the
primary
andoverprint colors
for
the normalink
set andHexachrome
are putin
relationto
each other.It
can
be
noticed thatthe
gamutis
enlargedconsiderably in
the
regionfrom
magentato
cyan.The
reasonwhy
the greento
red part ofthe gamutis
larger
in
thenormalink
setis mostly
due
to
unequalSID levels
in
the
twosamples.As
a normal magentaink is
skewed towardyellow,
it
will producebetter
orange tonesthan
the
moreideal hexachrome
magenta and yellow.This is
one ofthereasonswhy Pantone
included
orangein
theHexachrome
system.On
the
otherhand,
figure
2,6 indicate
that the
region
from
yellowto
magentais slighdy larger
withHexachrome
CMYK,
whileit is
smallerin
the
a* b*
chart.
This
is
due
to thedifference
in
lightness,
which can notbe
seenin
figure
2.7.
To
get a preciseconclusion,
threedimensional
plots withhigher accuracy
needto
be
made.
100000
90000
80000
70000
60000
Hexachrome C>T DNormal CMYllowto Red to Magenta Elueto Cyan to Green to
red magenta toblue cyan green yellow
Figure
2.5
Difference
in
color gamut whencomparing
press sheets printed withthe
CMYK
inks
from he Hexachrome
ink
set with normal processinks.
-Hexachrome CMYK Normal CMYK
Figure
2.6
a*b*plot ofthe same
color gamut as shown
in figure 2.5
1.0 0.9 0.8 0.7 OJ u 0.6 c n, o 0.5
1
0.4 0.3 0.2 0.1 0.0Hexachrome Magenta Normal Magenta
CAAZ.
(l
i
i
/
/
I
/
1
/
i
\/
i
/
/
\
/
/
W
/
/
i
S^"N. -^-A395 445 495 545 595
Wavelength
(nm)
645 695
[image:24.525.14.489.77.335.2] [image:24.525.21.510.373.731.2]12000
100000-80000
o 60000 >
40000
20 000-r
Yellow to Red to
red magenta
? High
Magenta Blue to Cyan to Green to
toblue cyan green yellow
[image:25.525.35.423.76.346.2]HMedium Low
Figure 2.8 Gamut
volumebetween
high,
medium andlow SID
levels
545
wavelength (nrr
-High SID" MediumSID Low
SIDJ
Figure 2.9
The
change inspectral reflectance whenincreasing
theSID
of magenta [image:25.525.41.464.395.669.2]"? High "
"Low
A--Medi
Figure
2.10
a*b*color gamut
plot
for different
SID
&&J
Solid Ink
Density
Although
processinks
aretransparent,
their color strength andlightness depend
upon theamountof
ink
that
is
applied to the substrate(ink
film
thickness, IFF).
It
is
generally
understood
that
anincrease in IFT
will produce colors thathave higher
colorfulnessbut
at thesame
time
the
colorsbecome
darker,
asshownby
Robert W. Bassemir
andJean
S
LavelleY
By
measuring
presssheets printed withgradually
increased IFT
andusing
formula
2.1,
the
author ofthis thesis
found
during
preliminary
studiesthatthe
gamutincreased
considerably
withhigher
SID,
althoughthe
increase
seemsto
level
off at ahigh SID
in
the
overprintcolors.
In
figure
2.8
the total number of colors are shown aroundthe
spectra.And
in
figure
2.10
the
a* b*
gamut
is
shown.The
totalvolume(calculated
withformula
2.1)
increased
from
180,000 CIELAB
volume unitsto
312,000
with thefirst SID
increase
andto
410,000 in
thesecond
increase
ofSID.
This
was2.3 times
larger
than
thelowest
solidink
density. The
reason
why
ahigher SID
produces colors withhigher
colorfulnessis
because
the
inks
have
[image:26.525.11.508.59.423.2]third
ofthe
spectrum wherethe
ink
should absorblight. If
the
density
is increased
thispartof
the
spectrum willbe
the
first
partthat
willbe
almosttotally
absorbed ascanbe
seenin
fig
ure
2.10. This
makesthe
colorless
gray,
but
atthe
sametime
darker
as some ofthe wantedreflection also
is
absorbedto
a greater extent.The
resultis
that
thehue
ofthe
magenta colorin
figure 2.10
is
shiftedtowards the
reddish sideas moreblue light
is
absorbed withthehigh
er
SID.
Screening
Measuring
the color gamutby
measuring
only
the
solid process color patches ofthe
primary
andoverprintcolors
is
the
normalway
to
determine
the
color gamutin
aprinting
system.But
asmentioned
earlier,
this
is only
an approximation ofthe
color gamutbetween
the
key
pointsand
it
does
not needto
be
straightlines
in
CIELAB.
Recent
studiesby
Stefan
Gustavson,
atLinkoping University
in
Sweden,
showsthat
high dot
gain andtheYule-Nielsen
effect(some
times
called opticaldot
gain)
willincrease
the
gamut .Similar
resultshave been
found
by
Marc
Mahily,
whohas
shownthat
withFM
screening
the
gamut willincrease
comparedto
AM
screens .In 1951 J. A.
C. Yule
andW.
J. Nielsen
presentedthe
basic
theoreticaland experimentalwork aboutthe phenomena thatmakes
halftone
dots
optically
larger
thanthey
mechanically
are5.It
is
based
on thefact
thatlight
will scatterin
thepaperbecause
it is
notperfectly
opaque and
uniform,
but
is
build
up
by
a network offibers
interspersed
withfillers,
pigments,
voids and various other
constituents,
allpartly
transparentand each with adifferent
refractive index.
The theory behind
the phenomena oflight
scattering in
paperandthe
phenomena thatevolves when
ink
is
applied on the paperis very
complex,
andis
not within the scope ofthisthesis.
Here follows
a general overviewhow
theYule-Nielsen
effectinfluence
the colorgamut.
Paper
a,
b, d,
e:
diffuse
reflectionc,
h: direct
reflectionHalftone dot
f:
transmission g: absorptionby
thepaperb,
e:Yule-Nielsen
effectFigure 2.11 Diffusion
andreflection oflight
whenincident
on paperWhen
light is
incident
onthe
paper there arefour
possible actionsthat can take placewhenthe
light
reachesthe
paper surface:The light
can reflectdirectly
from
the
paper surface(h in figure 2.11).
On
almost all occasionsthelight
scatters multipletimes
within thepaper(a). After
a seriesof scatterings the
light
is
reflectedback
in
a randomdirection,
calleddiffuse
reflection.If
notreflected
back,
thelight
is
either absorbedin
thepaper(g)
or transmittedthrough the paper(f).
In diffuse
reflection thelight
penetratesinto
thebody
ofthepaper,
whereit
reflectsbetween
the
fibers
andeventually
exitsfrom
thepaper surfaceatapositionfarther away from
thepointwhere the
light
penetrated thepaperin
thefirst
place.When
ahalftone
dot
isprintedonpaper,
light
that entersthe paper closeto the
border
line
between ink
and paper canscatterin
thepaper,
and when it emergesfrom
thepaper,
itis trappedunderthe ink andthen absorbedmore or
less
depending
ontheink
and thewavelength
ofthe photon.For inks
that aretransparentsuchas,
cyan,
magentaor
yellow,
thelight
can either
have
traveled throughtheink
andthen penetrated intothepaper where it scatters
and exits
from
the paper on a place where thepaper is notcovered
by
ink.
In
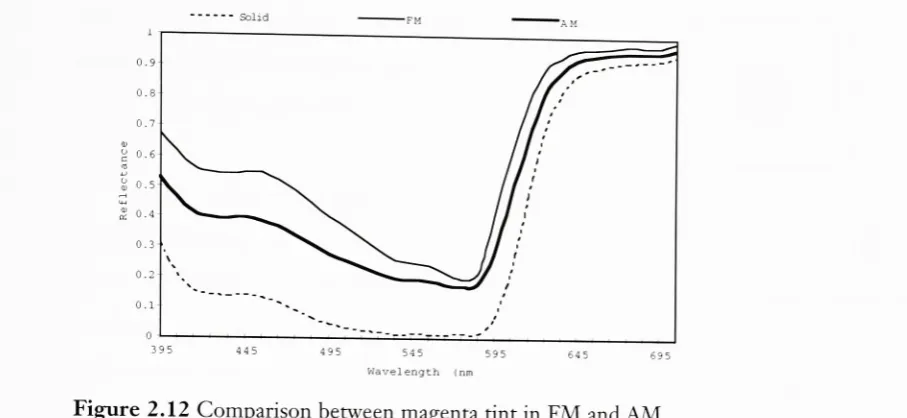
this case theFigure
2.12
Comparison between
magentatint
in
FM
andAM
happen
whenlight
entersthe
paperwithoutgoing
through the
ink,
but
the
scatter oflight
in
the
paper exits on a place wherethe
paperis
coveredby
ink.
The Yule-Nielsen
effecthas mainly
two
properties:For
opaqueinks
the
dot
seemsto
be larger
aslight
entersfrom
the paper and exits underthe
halftone
dot,
thereby
forming
a shadow aroundthe
dot.
For
transparent
ink,
notonly
the
dot
willgrow,
but
alsothe
spectral reflection willbe
purerbecause light
willbe filtered
onceinstead
oftwice.Transparent
ink only
absorbsa portion ofthelight. The
spectrophotometricreflectancefrom
the
ink
willbe different because
the
light has
traveled twice
throughthe
ink.
This
is
due
to
the
unwanted absorptionin
the
ink
whichmakes some ofthe
wantedlight
to
be
absorbed.The
solid magenta patchthat
is
shownin
figure
2.12
was measuredfrom
atest
printmade at
Rochester Institute
ofTechnology
as anindependent study
by Teerapong
Laohar-avee,
underthe
direction
ofFranz Sigg. The
test
print was made at avery
high SID
andthe
report compared
the
result offrequency
modulated(FM)
and amplitude modulated(AM)
screening.
In figure
2.11
the
slopeofthe
reflectance curve ofthe
FM
tint
is
higher from
the
[image:29.525.3.457.69.278.2]blue
to
the
green portion ofthe
spectra,
whichmakes
the
FM tint
moreideal
in
color.The AM
wasscreened at
1
5 0
lpi
andthe
FM had
a spotsize of2 1
pm.
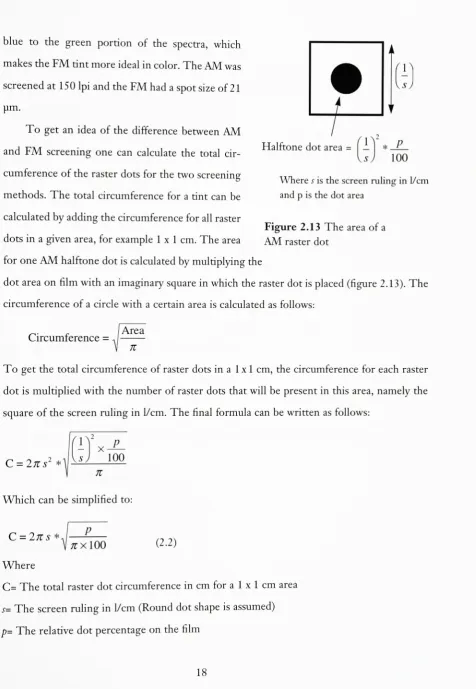
To
get anidea
ofthe
difference between
AM
and
FM screening
one can calculatethe total
circumference of
the
rasterdots for
the two
screening
methods.
The
total
circumferencefor
atint
canbe
calculated
by
adding
the
circumferencefor
all rasterdots
in
a givenarea,
for
examplelxl
cm.The
areafor
oneAM
halftone dot is
calculatedby
multiplying
the
dot
area onfilm
with animaginary
squarein
whichtherasterdot is
placed(figure
2.13).
The
circumference of a circle with a certain area
is
calculated asfollows:
Halftone dot
area =[__]*R.
p)
100
Where
sis
thescreenruling in
1/cm
and
p is
thedot
areaFigure
2.13
The
area of aAM
rasterdot
Circumference
=Area
n
To
getthe total
circumference of rasterdots
in
alxl
cm,
the
circumferencefor
each rasterdot
is
multiplied withthe
number of rasterdots
thatwillbe
presentin
thisarea,
namely
thesquare of
the
screenruling
in
1/cm. The final formula
canbe
written asfollows:
C
=2ttA
*Which
canbe
simplified to:C
=2ks
*. ;rxl00
(2-2)
Where
C=
The
totalrasterdot
circumferencein
cmfor
a1
x1
cm areas=
The
screenruling in 1/cm
(Round
dot
shapeis
assumed)
[image:30.525.37.514.37.727.2]It is
possibleto
usethe
formula for
roundrasterdots
up
to
70
percent wherethe
dot becomes
so
big
that
it
will nolonger
grow circularly.This
is
not usedin
today'sAM
methods,
but
serves
the
function in
this
calculationif
p<70.
For FM screening
the
formula is different
andis
based
onthe
same size asin
formula
2.2,
lxl
cm.The
circumferencefor
eachdot
is
the
square ofthe
spot size width.The
totalnumber
ofspotsin
a givenareais:
Area
(spot
size)
If
a centimeteris
used as acommonunit,
the
number of spots ofthe spot width/(in
pm)fora
1
x1
cm area willbe:
u
oooo
J
The
circumference(in
cm)
for
each spotis further:
f
4*
I
10000
By
multiplying
the circumferencefor
each spot with the numberof possible spotsin
a1
x1
cmand the raster
dot
area,
the
totalcircumference canbe
expressed asfollows:
1
f
f
2AJ\*-P.
*
l
4
*.10000
J
100
A
ioooo.
Which
canbe
simplified to:/
I
oooo
100
Which is
the
same as:p
*400
C
=/
(2.3)
Where:
f=
Width
ofthe
spot sizein
pmC=
The
total
circumferencein
cmfor
a1
x1cm
areap=
The
relativedot
percentage onthe
film
In
this
casethe
assumptionis
madethat the
FM
methodis
made sothat
it
will never placetwo
spotsin
contactto
each otherif
the
dot
areais
lower
than
fifty
percent.Again
this
is
notalways the case
in
practice,
but
it
can serve as a rough estimation ofthe
total circumference.In
table
2.1
the total
circumferenceis
calculatedfor
somedifferent dot
percentages andscreen rulings and
for different
spot sizes.It is
clear thatFM
gives atotal
circumferencethatis
usually
muchhigher
than theAM
screening.AM
screening
FM
Screening
60
1/cm
100
1/cm
200
1/cm
28
um21um
14
um10%
67
cm291cm
1209
cm143
cm190
cm286
cm30%
116
cm383
cm1387
cm429
cm571cm
857
cm50%
150
cm435
cm1478
cm714
cm952
cm1429
cmTable
2.1 Difference in
totalborder line
between
amplitude modulatedandfrequency
modEnd
notes1. Kurt Schlapfer
andErwin
Widmer,
"Which
color gamut canbe
achievedin
multi colorprinting
andin
television"
TAGA Proceedings (1993):
41
2. Robert W.
Bassemir
Jean
S.
Lavelle,
"Colorimetric
parameters oflithographic
prints atvarious
ink
film
thickness"
TAGA
Proceedings (1993):
327
3.
Stefan
Gustavson,
"The
color gamut ofhalftone
reproduction"
IS&T/SID Color
imag
ing
Conference (1996):80
4. Marc
Mahly,
"Gamut
calculation of colorreproduction"
IS&T/SID
Color
imaging
Con
ference (1996):
145
5.
J.A.C. Yule
andW. J.
Nielsen,
"The
penetration oflight
into
paper andits
effect onhalftone
reproduction"TAGA
proceedings(1951):
65
Chapter
3
Literature
review
The
penetrationoflight into
paper andits
effectonhalftone
reproductionA
research paper presentedin
the
1951
TAGA Proceedings
by
J. A.
C. Yule
andW.
J. Nielsen.
This
is
the
first
report on whathas been
called opticaldot
gain,
orthe
Yule-Nielsen
effect.The
phenomenais
based
onthe
fact
that
light does
not reflect atthesurface ofthepaperbut
diffuses
in
the
body
ofthe
paper.The
following
quotefrom
the
paperdescribes
the
basic
phenomenon:
The
distance
over whichlight
spreadsmay
be
roughly indicated
by
thewellknown
fact
that
if
youplaceapieceof
paperonadark
surfaceit
appearsblacker
than ona
light
surface.The
black
surface showsthroughthe
paper.This
must mean thatan appreciable amount
of
light
passes throughthe
paper,
whichis usually
about3
or
4
milsthick.
This
is
comparableto the
distance between
halftone
dots.
Since
light is diffused
by
the
paperit is
likely
to
spread sidewaysto
aboutthesame extentthat
it
penetrates through.Therefore
someof
thelight
which enters ahalftone
patternthrough
a spacetries to
come outthrough adot,
andis
absorbedinstead of
being
reflected.Yule
andNielsen
made an experimentwherethey
placed ahalftone film
ontodifferent
substrates and measuredthe reflectance.
In
thisway
the
actualdot
area wasknown
andonly
the
con-struct a new
formula
for calculating dot
areain
print.
The formula includes
afactor
thatdepends
onthe
light
diffusing
effectthat
occurs:D
=n
log
1
af
~Ds)
1-10
"V
)j
Where:
D=
The
reflecteddensity
n =
A
factor
that
depends
uponthe
screening
frequency
and papertranslucency
a=
Dot
areaDr
=Density
ofthe
solidink.
Although
thebasic
studies ofthe
increase
in
density
due
to
thelight diffusion
was made withblack
ink,
the
theory
alsoappliesfor
chromaticinks:
(another
quotefrom
the
paper)
The
equationappliesequally
wellto
a coloredink,
and enables usto
calculate moreaccurately
the
amountof
red,
green andblue
light
absorbed.The
practicaleffectis
that
halftone
tints
appears morelike
continuostone tints
thanthey
wouldif
there
were nopenetration
into
paper.The
sameink
printedin
afiner
sa~een shows adefinitively
purercolorthanthe
sameink
printedin
a coarserscreen,
wherethese
effects arenegligible.1
Colorimetric
parameters oflithographic
prints at variousink
film
thicknesses
A
research paper presentedin
the1993 TAGA Proceedings
by
Robert
W.
Bassemir
andJean
S.
Lavelle.
In
an attemptto
set aninternational
colorimetric standardfor
printedink
films,
test
printsfor
the
International Standard Organization
where made withSWOP
andEuroscale
ink
sets.The
prints were made on alaboratory
press at sevenink
film
thicknessesranging from
0.7
to
1.3
micrometers with0.1
micrometerincrements.
Spectrophotometric
measurements weremade at
four
laboratories.
The
result showedthat:
L*
is
decreased
whenIFT is increased.
The
magnitude of a*and b*
increase for
allinks
except a*for
cyan which almostis
unchanged when
IFT is increased.
The
density
is increased
withincreased IFT.
Which
colorgamutcanbe
achievedin
multi colorprinting
andin
television
A
research paper presentedin
the1993
TAGA Proceedings
by
Kurt
Schlapfer
andErwin
Widmer.
The
paper presents a methodto
calculatethe
gamut withthe
CIELUV
valuesfrom
the
solidpatches of
the
primaries and the overprintcolors,
i.e.
red,
green andblue.
In
addition tothese,
black
and whiteare also usedto
make athree
dimensional
volume.The
volumeis
calculated,
aspreviously
described,
withformula
2.1
The
paper also presents a theoretical gamut calculationfor
ideal
primaries.This
showsthat the
maximum volumeis 1.645
millionCIELUV
volume units.The
color gamut ofhalftone
reproductionResearch
paper submittedto thefourth
IS&T/SID Color
Imaging
Conference, 1996,
by
Ste
fan
Gustavson,
Linkoping
University,
Sweden.
A
researchgroup
atLinkoping University
has
developed
a modelfor
predicting
dot
gain andthe
Yule-Nielsen
effectin
print.By
using
this
model togetherwith spectrophotometric measurements of actual
CMYK printing inks
the
gamut wascalculated,
notjust
withthe
solid primaries,
asKurt Schlapfer
andErwin
Widmer,
but
alsoconsidering
the
halftone
reproductionThe
results showthat the
gamutis increased
both
by
theYule-Nielsen
effect and thedot
gain.
The
gamutincreases
more whenthe
inks
are printed withdot-on-dot
screens,
thanif
the
inks
wouldbe
placed nextto
each other.The
gamutincrease
due
to the
dot
gain andYule-Nielsen
effectis
most apperantin
light
colors and smallin
dark
colors,
where someparts
decrease slightly
in
gamut when comparedto
a system withoutany
dot
gain.End
notes1.
J.
A.
C. Yule
andW. J.
Nielsen,
"The
penetration oflight
into
paper andits
effect onhalftone
reproduction"TAGA Proceedings (1951): 67
Chapter
4
Hypotheses
Today
HiFi Color
is o f t e ndiscussed
in
the graphicsartsindustry
andmany
printers are uncertain
if it
willbe
productive,
because
ofthe
increase
cost and yetunpredictable results.
The
main problemis
that
morethan
four
colors are used.If
the
color gamut couldbe increased
withonly four printing
inks,
HiFi Color
wouldbe
moreviable.
This
researchinvolves
the
increase
ofthe
color gamutusing
four inks
printedby
sheetfed
lithography,
andvarying
the
solidink
density,
ink
set andscreening
method.As
described
in
chapter
two,
the three
independent
parameters of spectral reflectance ofthe
printedink,
solidink
density
andscreening
method canincrease
the
color gamut.The
major questionthat this
research
has
answeredis:
How
does
the
ink
set,
SID
andscreening
methodinfluence
the
colorgamut,
both
asindividual
parameters and
in
combinationwith each other?In
orderto
answerthis
questionthree
hypothesizes
are stated:HI. There
willbe
no significantdifference
in
colorgamut volume whenthe
SID
is increased.
H2. There
willbe
no significantdifference
in
color gamut volume whenfrequency
modulatedscreening
is
comparedto
amplitude modulated screening.H3. There
willbe
no significantdifference
in
color gamut volume when purerinks
areused.The
rejection and acceptance ofthehypothesizes
willbe
evaluated withANOVA
and anF-test
with
0.05 level
ofsignificanceasteststatistic.Chapter
5
Methodology
The
sole goal of this research is to monitorthe
changein
color gamut.It is
evaluatedwith atest target that
is
printedwith eachcombinationofthe threeparameters.
Further,
the test target
needsto
be
designed
sothat
it
candetect
changes
in
the whole printablegamut,
around the color spectra andfrom dark
tolight. As
screening is
aparameter,
thetest target
mustinclude
colorsbetween
theprimary
and overcolors,
from
whiteto
black
The
solutionis
aspecially designed
test target
with168
patches.The
target
is
twodimensional,
having
the
hue
on one axis andlightness
onthe
other.A
worldmap is
a goodanalogy
ofthetarget.
The
equatoris
the pure combinations ofcyan,
magenta andyellow.These
colors are referredto
in
this thesis
asthe
colors with"highest
colorfulness"
These
twenty
four hues
are arrangedin
the
following
manner:Hue: 1 2 3 4 5 6 7 8 9 10 11 12 13 14 15 16 17 18 19 20 21 22 23 24
C% 0 0 0 0 0 0 0 0 25 50 75 100 100 100 100 100 100 100 100 100 75 50 25 0
M % 25 50 75 100 100 100 100 100 100 100 100 100 75 50 2 5 0 0 0 0 0 0 0 0 0
Y% 100 100 100 10075 50 25 0 0 0 0 0 0 0 0 0 25 50 75 100 100 100 100 100
red blue yellow
Key
colorTable
5.1
The
basic
CMY
combinations usedin
the168
patch color gamuttarget.
The
poles are the maximumblack
(overprint
ofsolidC, M, Y, K)
and paper white.In
"north-south"
direction
each ofthe
thirty hues
in
table5.1
are overprintedwith25,
50
and75
percentblack
a