City, University of London Institutional Repository
Citation
:
Gavaises, M., Andriotis, A., Papoulias, D., Mitroglou, N. and Theodorakakos, A.
(2009). Characterization of string cavitation in large-scale Diesel nozzles with tapered holes.
Physics of Fluids, 21(5), 052107. doi: 10.1063/1.3140940
This is the published version of the paper.
This version of the publication may differ from the final published
version.
Permanent repository link:
http://openaccess.city.ac.uk/14822/
Link to published version
:
http://dx.doi.org/10.1063/1.3140940
Copyright and reuse:
City Research Online aims to make research
outputs of City, University of London available to a wider audience.
Copyright and Moral Rights remain with the author(s) and/or copyright
holders. URLs from City Research Online may be freely distributed and
linked to.
Characterization of string cavitation in large-scale Diesel nozzles
with tapered holes
M. Gavaises,1,a兲 A. Andriotis,1D. Papoulias,1N. Mitroglou,1and A. Theodorakakos2 1
City University London, Northampton Square, GB-London EC1V 0HB, United Kingdom
2
Fluid Research Co., 49 Laskareos Str., GR-Athens 152 34, Greece
共Received 8 March 2008; accepted 9 December 2008; published online 21 May 2009兲
The cavitation structures formed inside enlarged transparent replicas of tapered Diesel valve covered orifice nozzles have been characterized using high speed imaging visualization. Cavitation images obtained at fixed needle lift and flow rate conditions have revealed that although the conical shape of the converging tapered holes suppresses the formation of geometric cavitation, forming at the entry to the cylindrical injection hole, string cavitation has been found to prevail, particularly at low needle lifts. Computational fluid dynamics simulations have shown that cavitation strings appear in areas where large-scale vortices develop. The vortical structures are mainly formed upstream of the injection holes due to the nonuniform flow distribution and persist also inside them. Cavitation strings have been frequently observed to link adjacent holes while inspection of identical real-size injectors has revealed cavitation erosion sites in the area of string cavitation development. Image postprocessing has allowed estimation of their frequency of appearance, lifetime, and size along the injection hole length, as function of cavitation and Reynolds numbers and needle lift. © 2009 American Institute of Physics.关DOI:10.1063/1.3140940兴
I. INTRODUCTION
The subject of vortex cavitation has received great atten-tion in literature, particularly in propellers, hydraulic tur-bines, and hydrofoils, with relevant studies those of Hsiaoet al.,1Arndt,2 Arndt,3 and Hsiaoet al.4 among many others. Cavitation is linked with undesirable effects such as sharp reduction in performance, increased noise and vibrations, as well as surface erosion. Fundamental cavitation bubble dy-namics theories are also well documented, for example, in Ref. 5. Nonspherical bubble dynamics simulation models have been employed in predicting vortex cavitation in Ref.1
but so far, such models have not been applied to nozzle flows. A recent review paper on experimental techniques and simulation models for cavitation is reported Ref.6still, this study refers to flow environments far from those realized in automotive injector nozzles.
The main differences arises from the nozzle geometric configuration and operating conditions: in fuel injectors huge pressure drops are encountered within very short distances, while the lifetime of the formed vortical structures is usually only a fraction of the injection period; the latter is of the order of 1 ms for typical engine operating conditions. Thus, the formation and development of such vortical structures has only been studied in enlarged nozzle replicas operating under steady-state conditions. Nevertheless, their formation and file time is a rather transient phenomenon, as recently reported in Ref.7.
Although the theory of formation of vortical structures in separation regions is well documented, for example, Refs.8
and 9, the complexity of the geometries of production nozzles is one of the main reasons for the insufficient
infor-mation available in such systems and its link to cavitation. Nevertheless, significant research has been dealing with the flow distribution in Diesel injector nozzles and its effect on the injected fuel spray plumes. Diesel injectors operate at high injection pressure reaching 1800 bars while the fuel is discharged through tiny holes of less than 0.2⫻10−3 m in
diameter. Under these conditions, cavitation is expected to be formed due to the local pressure drop taking place at the inlet to the injection holes; relevant publications for real-size Die-sel injectors are those of Chaveset al.,10Badocket al.,11and Arcoumaniset al.12while a number of investigations studied the development of cavitation in transparent nozzle replicas, for example, Soteriou et al.,13 Soteriou et al.,14 He and Ruiz,15and Kimet al.16 Cavitation can be modified or even eliminated completely through appropriate design of the hole entry rounding and the noncylindrical shape of the holes, as shown by Blessing et al.17 although careful optimization is required for achieving engine exhaust emissions without de-terioration in performance.
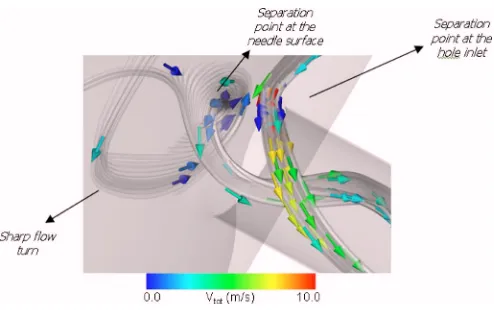
Cavitation in such nozzles has been identified into two district forms of geometric induced and vortex or string cavi-tation, according to Afzal et al.,18Arcoumanis et al.,19 and Roth et al.20 The geometric-induced cavitation becomes gradually a relatively well-studied phenomenon initiating at sharp corners where the pressure may fall below the vapor pressure of the flowing liquid. String or vortex cavitation has been observed in the bulk of the liquid of sac or min sac-type nozzles where the volume available may allow formation of large-scale vortices relative to the nozzle geometry. In nozzle flows, two possible flow separation regions typically exist. These can be realized in Fig. 1. In this figure, the vortical structures are represented by an isosurface of the swirl num-ber, as documented by Jeong et al.21 This is a nondimen-sional parameter used to locate vortical flow structures,
a兲Author to whom correspondence should be addressed.
which are shown as transparent tubes in that figure. Inside them, fluid’s velocity vectors are indicated. Two distinct structures can be observed. The first one originates from in-side the sac volume upstream of the injection hole. As the flow turns in order to enter inside the injection hole, it forms a separation region near the needle seat area and forms a clearly indicated vortex. Flow separation is sometimes asso-ciated with formation of cavitation in such locations. As it enters into the nozzle hole passage forms a clearly identified vortex.
The second flow detachment point is located at the top or side surface of the hole inlet. Again, a clear vortical structure can be identified. In addition, a small eccentric placement of the needle valve promotes the asymmetric entrance of the flow in the discharge channels. More recent studies have shown similar behavior in various types of multihole nozzles, as reported by Gavaises et al.22 and Nouri et al.23
Recently, investigations reported in a marine injector by An-driotis et al.7 showed that such structures are found at the core of large-scale recirculation zones developing transiently within the nozzle. However, no evidence for the existence of string cavitation has been reported so far for valve covered orifice 共VCO兲 nozzles, which are known to reduce engine unburned hydrocarbon emissions in modern Diesel engines. Due to the difficulty in obtaining real-time measure-ments during the injection process, most of the experimental studies reported refer to experimental devices emulating op-erating conditions similar to those of Diesel engines. Limited number of studies have shown that dynamic flow similarity based simultaneously on the Reynolds and cavitation num-bers 共CNs兲 may allow comparison between the two-phase flow regimes formed in real-size and enlarged nozzle replicas with identical scaled-up geometric characteristics, according to Soteriouet al.24and Arcoumanis et al.12 In those experi-ments, Reynolds number 共Re兲 was defined on the basis of hole diameter and mean injection velocity while the CN was defined as CN=共Pinj−Pback兲/共Pback−PV兲, where Pinj, Pback,
and PV represent the injection, downstream air, and fluid’s
vapor pressure, respectively. Although the dynamics of cavi-tation phenomena at the microscale of bubble dynamics can-not be scaled, experimental evidence suggests that similar
flow regimes form macroscopically both in real-size and large-scale injectors. Furthermore, almost all related experi-mental data show that the discharge coefficient of nozzles with cylindrical holes decreases asymptotically to a mini-mum value with increasing CN but it is independent of the Reynolds number. Giannadakiset al.25 reported simulations results in real-size and scaled-up models using a variety of cavitation models. Giannadakiset al.25indeed confirmed that similar flow regimes are formed despite the obvious differ-ences in the microscale level of bubble formation and devel-opment. This is effectively an effect of the large number of the cavitation bubbles which coalesce and form the macro-scopically observed cavitation cloud. It ought to be men-tioned though that no other thorough investigation clarifying issues related to scaling effects in nozzle cavitating flows has been reported so far. Thus, extrapolation of experimental re-sults obtained in large-scale nozzle to real-size injectors, have to be treated with skepticism.
Parallel to the continuing efforts to obtain better experi-mental information under as realistic conditions as possible, there is an increasing demand for developing and validating computational fluid dynamics共CFD兲 models able to predict cavitation; relevant publications are those of Schmidtet al.,26 Singhalet al.,27and Giannadakis.28Experimental validation of computational models is essential for assisting to the un-derstanding of the flow processes in complicated nozzle ge-ometries and ultimately, to the design of new nozzle designs. However, the difficulty in manufacturing real-size transpar-ent nozzles that may allow direct visualization of cavitation under realistic conditions imposes simplifications to be made to the design of the nozzle itself and the transient operation of the needle. Complications related to the physical proper-ties and the quality of the working fluid imposes additional difficulties. Nevertheless, experimental data obtained in large-scale injectors can be valuable for the development and validation of cavitation models applicable for fuel injectors. The aforementioned models have been applied so far in simulating the geometric-induced cavitation. Unfortunately, there is no study reported on the prediction of string cavita-tion in fuel injeccavita-tion equipment. This is mainly due to the lack of experimental data available for the relevant flow phe-nomena and thus, the incomplete physical understanding of the process.
[image:3.612.51.298.48.203.2]The present paper aims to provide new experimental data for the origin, formation, area of development and life-time of the vortex type or string cavitation observed in en-larged replicas of VCO Diesel injector nozzles incorporating tapered 共converging兲 holes. To allow comparison with the majority of previously published studies on cavitation visu-alization in Diesel injectors, images are compared between identical nozzles incorporating cylindrical holes. The specific design of these nozzles allows for clear optical access to all holes and the nozzle volume to be obtained. High speed im-ages reveal that cavitation strings form not only from cavi-tation sites inside the injector but also from downstream air trapped to the vortical structures persisting up to the nozzle exit; such observations are made for the first time and reveal the formation of a two-phase flow structure inside Diesel injectors not identified before. Use of CFD simulations has
FIG. 1. 共Color online兲Visualization of flow separation points present in typical Diesel automotive injector nozzles. Velocity vector colored with the magnitude of velocity showing locations of sudden deceleration.
provided information about the local flow field at the loca-tion where cavitaloca-tion strings develop and has assisted in the interpretation of the experimental images. Image collection over long enough duration has provided information on the lifetime of cavitation strings and their diameter as function of the flow conditions. Extrapolation though of the present find-ings to real-size nozzles is not discussed here since such information is not available, neither experimentally nor com-putationally.
Section II of this paper describes the experimental setup used and the test cases investigated. Then, the various results obtained are presented while the most important findings are summarized at the end.
II. EXPERIMENTAL SETUP AND TEST CASES
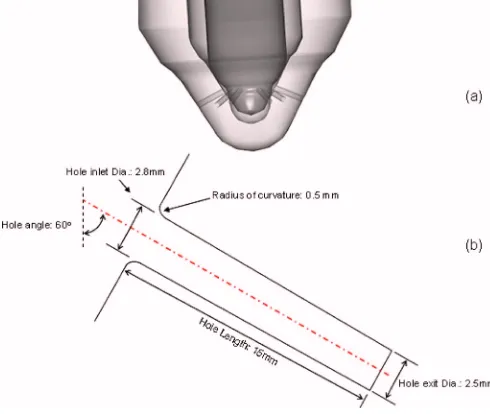
Cavitation visualization has been performed in 15⫻ enlarged transparent nozzle replicas. Transparent nozzles were manufactured from an acrylic transparent material 共PERSPEX兲. The design of the nozzle can be seen in Fig.
2共a兲; Fig.2共b兲shows a cross section at the symmetry plane of one injection hole. The nozzle itself is a VCO design which implies that the needle valve seals directly in the hole entry area, thus eliminating the dead volume below the in-jection holes. A recent study by Gavaises et al.29 reported cavitation images and fluid dynamics predictions for two VCO nozzles identical with that used in the present study but with cylindrical holes; emphasis was placed in that study on the effect of two different needle designs which has been found to influence nozzle cavitation and erosion. The present investigation focuses on the shape of the injection holes. The nozzles with tapered holes have shown persistently forma-tion of string cavitaforma-tion; the images obtained have allowed detailed characterization of this flow structure. The nominal hole diameter is 2.925⫻10−3 m共0.195⫻10−3 m in the
real-size injector兲. For both designs the radius of curvature at the hole entry has been ⬃0.3⫻10−3 m 共approximately 0.2
⫻10−4 m in the real-size nozzle兲. The observed
geometric-induced cavitation structures of the cylindrical holes are very similar to those observed in the majority of published data. However, the converging tapered holes greatly modify the pressure distribution within the nozzle, and as a result the formation of cavitation, as can be seen in Figs.3共a兲and3共b兲
for the cylindrical and tapered nozzle hole shapes, respec-tively. Results are presented at 0.3⫻10−3 and 3.75
⫻10−3 m, which will be referred to as low and high needle
lift positions, respectively; these correspond to 20⫻10−6and
250⫻10−6 m of equivalent needle lift in the real-size
injec-tor, respectively.Pinjis the calculated pressure just upstream
of the injection hole andPmin is the minimum pressure
[image:4.612.302.561.49.234.2]cal-culated through the simulation. Tapered holes create a smooth pressure gradient along the hole length; the cavita-tion site is completely eliminated at high needle lift and only a very small region exists for low needle lifts. On the con-trary, the computational results obtained for the cylindrical holes indicate a strong cavitation “eye” at the top corner of the injection holes caused by the sharp pressure drop at the hole inlet. The measured and calculated discharge coefficient can be seen in Fig. 4 for the two nozzles and for the two
[image:4.612.50.295.52.259.2]FIG. 2.共Color online兲 共a兲Three-dimensional computer-aided design共CAD兲 nozzle design and共b兲geometry of the injection hole.
FIG. 3.共Color online兲Predicted normalized pressure distribution within the injection of the共a兲cylindrical and共b兲tapered injection hole at two different needle lifts of 0.3⫻10−3 m共top row兲and 1.5⫻10−3 m共bottom row兲.
[image:4.612.333.543.571.729.2]needle lift sets investigated. The tapered hole nozzles have a much higher discharge coefficient, as expected. In order to keep the fuel injection quantity and injection duration the same between the cylindrical and the tapered holes, the exit diameter of these nozzles was significantly reduced com-pared to the cylindrical ones, down to 2.43⫻10−3 m
共0.162⫻10−3 m in the real-size injector兲. On the same plot,
predictions from the CFD model are also included; these results are indicated with two horizontal bars. The upper one corresponds to predictions obtained with the single-phase flow solver and they are exhibiting values a little higher than those predicted using the cavitation model of Giannadakiset al.30 This model accounts for the geometric-induced cavita-tion forming at the hole inlet due to the sharp pressure drop in this area. The model indicates that cavitation may be re-sponsible for up to 5%–10% reduction in the nozzle dis-charge coefficient at low needle lifts while its relative impor-tance increases with the increased amount of cavitation. This is the case of the cylindrical hole nozzle at the highest needle lift setting. As mentioned, there is no cavitation for the same lift when tapered holes are employed so in this case, only one horizontal bar is depicted. Overall, model predictions are close to the experimental values and thus model predictions can be considered reliable for providing more detailed infor-mation of the flow distribution inside the nozzle; more thor-ough validation of the CFD model used can be found in Ref.
25and more recently in Ref.31.
The visualization studies to be reported here provide ob-servations of the flow characteristics in these nozzles which are fundamentally different due to the formation of string cavitation. High speed images have been collected at fixed needle lift positions and various combinations of injection and back pressure values. The steady-state flow test rig that has been described in detail in past studies20 has been uti-lized. The working fluid was filtered water at 25 ° C con-trolled by a heater/cooler installed in the storage tank, a de-gasification filter using membranes was also fitted in the flow rig. The flow rate was controlled by a valve in the pipe downstream of the feed pump and measured by an orifice plate flow meter. Both the injection pressure and the pressure downstream of the injection holes were adjusted by restrict-ing the inflow and outflow of the injector, respectively. In order to reach subatmospheric back pressures and therefore higher CN and Re numbers, a suction pump is installed in
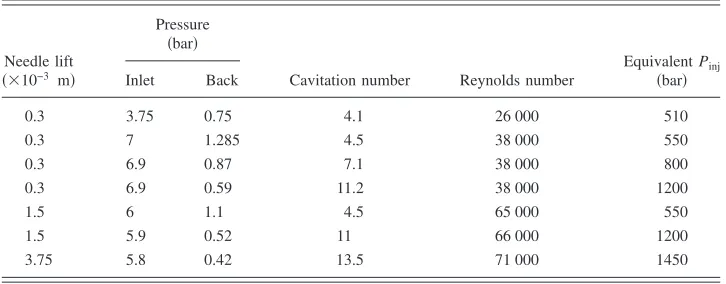
addition to the main feed pump. The operating conditions tested for the two large-scale transparent nozzles are summa-rized in TableI. As can be seen, CNs up to 13.5 have been tested, which are similar to those of the real-size injector operating under engine operating conditions. Imaging was performed for various combinations of the listed parameters. Results to be reported here correspond to three values of needle lift of 0.3⫻10−3, 1.5⫻10−3, and 3.75⫻10−3 m,
re-spectively; these are equivalent to 20⫻10−6, 100⫻10−6, and
250⫻10−6 m in the real-size injector, respectively. The
[image:5.612.125.488.64.206.2]range of Reynolds numbers tested共up to⬃71 000兲indicates that for the whole range of operating conditions, the fuel flow through the injector nozzles and especially through the holes, is turbulent; laser Doppler velocimetry measurements reported in Ref.22for similar operating conditions indicated high levels or rms velocities, attributed not only to liquid turbulence but also to the transient behavior of the formed cavitation structures. It can thus be expected that all flow features behave transiently and with short time scales even at steady-state conditions. Since it is important to gain knowl-edge about the dynamics of the cavitation inception and for-mation processes, a high speed digital video system was set up. For the particular cases investigated here, up to 16 000 fps 共frames per second兲 were sufficient to capture the tem-poral development of cavitation using a shuttering time of 30 ns. Considering that the maximum liquid velocity inside the injection holes is of the order of 30 m/s, during the shuttering time the cavitation bubbles move less than 1 m, which can be considered low enough to freeze the image. In total, up to 4000 images have been collected for every case. A strong halogen floodlight together with halogen spotlights were nec-essary to provide enough light for the intensified charged coupled device video chip in combination with the high frame rates. Following image acquisition, postprocessing has been performed which has provided further insight into the observed two-phase flow structures. Temporal averaging of sufficient number of instantaneous string cavitation images has provided a mean image projected on the two-dimensional共2D兲viewing plane, which has been interpreted as the probability of finding vapor within the injection hole. Furthermore, the frequency of appearance of cavitation strings as well as their radius has been derived along the hole length whenever possible. Finally, the limited CFD predic-tions included to assist in the interpretation of the observed
TABLE I. Operating conditions tested for the large-scale nozzles.
Needle lift
共⫻10−3 m兲
Pressure
共bar兲
Cavitation number Reynolds number
EquivalentPinj 共bar兲 Inlet Back
0.3 3.75 0.75 4.1 26 000 510
0.3 7 1.285 4.5 38 000 550
0.3 6.9 0.87 7.1 38 000 800
0.3 6.9 0.59 11.2 38 000 1200
1.5 6 1.1 4.5 65 000 550
1.5 5.9 0.52 11 66 000 1200
3.75 5.8 0.42 13.5 71 000 1450
cavitation regimes have been obtained with the author’s in-house CFD code; details of the specific models and flow processes considered can be found in Ref.25.
III. RESULTS AND DISCUSSION
A. Cavitation regimes
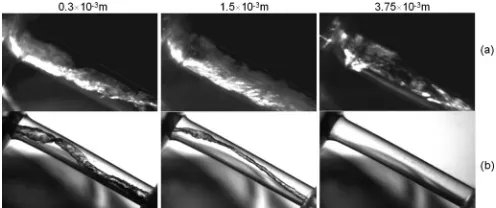
The first findings regarding the cavitation regimes formed inside the cylindrical and tapered nozzle holes can be realized from Fig.5. This figure shows representative images of the observed cavitation for all three needle lift positions investigated. Clear differences can be observed between the cylindrical and the tapered holes. For the low needle lift case, the cylindrical hole nozzle exhibits mainly the forma-tion of a cavitaforma-tion cloud at the hole inlet, which occupies most of the hole inlet cross sectional area. The majority of the formed cavitation bubbles seems to collapse within the injection hole before reaching the hole exit. This regime has been referred to in past studies as incipient cavitation, for example, see Ref.32. Increasing needle lift results to fully developed cavitation, which extends up to the hole exit. In addition to the geometric-induced cavitation, vortex or string cavitation has been observed, similar to that of Rothet al.33
The structure of cavitation is clear inside the tapered nozzle hole. There, string cavitation dominates the flow at low and intermediate lifts while both geometric and string cavitation disappear completely at high needle lifts. This type of cavi-tation structures has been observed in similar enlarged nozzle designs investigated over the past few years while limited evidence has been also reported in real-size nozzle operating at realistic injection pressures and needle opening/closing events, as reported by Arcoumaniset al.,12Blessinget al.,17 and Roth et al.33 More recently, in Ref. 22 the flow in a relatively different nozzle geometry used with low-speed two-stroke large Diesel engines was dominated by string cavitation, which was also linked to important effects on the atomization process of the injected liquid.34In a complemen-tary study by Andriotiset al.,35limited information on simi-lar structures of string cavitation have been observed but this time in nozzles incorporating tapered converging holes. It is thus of interest to explore in more detail the conditions which lead to the initiation and area of development of these observed two-phase flow structures.
B. String cavitation origin
Two questions may arise from Sec. III A:共i兲How cavi-tation strings originate?共ii兲Where do they develop? The first one can be answered by observing the following two figures. Figure6 shows the formation of a cavitation string as cap-tured from the high speed camera at 16 000 fps. For this particular operating condition, a weak geometric-induced cavitation bubble cloud is forming at the top corner of the injection hole. Cavitation bubbles found at locations closer to the axis of symmetry of the injection hole suddenly elongate and may take the shape of the observed strings within only a very small time interval. Figure7shows a different origin or mechanism of string cavitation formation observed at the intermediate needle lift of 1.5⫻10−3 m. This time, the
in-creased needle lift combined with the tapered hole shape eliminates geometric-induced cavitation sites pre-existing to the formation of string cavitation. Thus, initially, a single-phase liquid flow is present within the injection hole. Despite that, the sequence of high speed images indicates that
[image:6.612.315.561.50.237.2]down-FIG. 5. Sample representative images of cavitation structures formed in the injection hole of the VCO nozzle with grooved needle at three different needle lifts,共a兲cylindrical and共b兲tapered hole, at the maximum Reynolds and CNs investigated.
[image:6.612.50.298.51.155.2]FIG. 6. Sequence of events showing the formation of string cavitation from cavitation bubbles formed at the top corner of the injection holes feeding the vortical structure present inside the injection hole 共needle lift: 0.3 ⫻10−3 m, Re= 38, 000, and CN= 11.2兲.
[image:6.612.316.559.563.710.2]stream air may enter into the injection hole and propagate upstream, forming again the observed two-phase flow struc-ture. It is surprising though to observe that flow process, considering that the liquid toward the hole exit has almost an axial velocity component, as all past experimental and com-putational studies have indicated. Cavitation strings have been observed not only inside the injection hole but also in the space between adjacent injection holes. The image of Fig. 8共a兲 shows a cavitation string linking two adjacent holes. Averaging of all acquired images results to the picture of Fig. 8共b兲; this can be interpreted as the probability of finding a cavitation string at a particular location in the space between two adjacent holes. The fact that the maximum lev-els of the plotted probability is less than 50% makes obvious that strings are not present continuously. In addition, their presence is more pronounced near the hole inlet rather than in the space between the hole inlet and exit. This is due to the mechanism of their formation and further development. As the pressure distribution plotted in Fig. 3 indicates, in the areas of formation of string cavitation the pressure is well above the vapor pressure of the flowing liquid, which is usu-ally considered as the threshold for cavitation inception. Thus, cavitation strings do not form due to the local pressure drop but they rather represent a mechanism of vapor trans-port in these areas. This transtrans-port mechanism sometimes— but not always—results to a cavitation string linking the two adjacent holes. In most cases, two strings are formed, each one originating from the corresponding hole, but disappear before coalescing and forming the continuous stream of va-por linking adjacent holes. This explains the lower levels of the plotted string probability of Fig.8共b兲at the central part of the injector. A scanning electron microscope共SEM兲picture of the actual injector reported recently in Ref. 29 and also shown here in Fig.8共c兲indicates that cavitation strings may also be responsible for cavitation erosion. In the absence of flow measurements in the areas of string cavitation develop-ment, the predicted flow field has been utilized to provide such evidence. Figure9 shows predicted stream lines inside the nozzle volume as well as the injection holes for the low needle lift case. The plotted streamlines of Fig.9共a兲are col-ored according to the swirl number 共Jeong et al.21兲. It is evident that in the space between the holes, a vortical struc-ture is present. This is formed in the narrow space upstream of the injection holes due to the turning of the upstream flow in its path toward the discharge channels. Similarly, the flow distribution inside the injection hole, shown in more detail in Fig.9共b兲, has also a swirling pattern with a vortical structure formed around its central part. This originates from the
non-uniform flow entering into the holes from the 3 and 9 o’clock sides. The observed flow nonuniformity may originate from the nonsymmetric design of the feed fuel pipe; other factors may be a small eccentricity of the needle lift which is known to affect the flow distribution in the narrow space between the needle and the injection holes as well as the transient development of the flow itself. The latter may be attributed to flow turbulence but also to the instantaneous variation of the discharge coefficient of individual injection holes. This can be caused by the formation of the weak geometric cavi-tation at the top corner, which instantly results to a reduction in the flow rate through that hole, as reported in Ref.25and thus, creating a cross flow between adjacent holes. Combi-nation of the observed cavitation strings with the predicted flow vortices developing within the injector indicates that cavitation strings develop in the area of these vortices, effec-tively they represent a “visualization” of their presence, as supported by the trajectory of cavitation bubbles specifically introduced into the flow and captured at the center of the vortical structure, following closely its path toward the hole exit.
C. String cavitation characterization
[image:7.612.316.560.51.265.2]Having identified their origin and area of development, we proceed now to the last set of results which provide in-formation on the temporal and spatial characteristics of string cavitation as function of the operating conditions. With the given experimental rig, the effect of CN, Reynolds num-ber, and needle lift has been evaluated. Figure 10 depicts clearly the expected effect of increasing CN keeping the flow rate through the rig constant and the needle at its lowest lift of 0.3⫻10−3 m. It can be seen that the formed strings are thinner at low CNs while no differences in their shape and extend can be observed with sufficient high CN.
FIG. 8.共Color online兲 共a兲Instantaneous image and共b兲time-averaged prob-ability of string cavitation appearance between two adjacent injection holes and共c兲SEM image of cavitation erosion at the entry to the injection hole, believed to be caused by string cavitation共from Ref.29兲.
FIG. 9.共Color online兲Model predictions for the original VCO nozzle using slightly eccentric needle position. Calculations indicate共a兲formation of a strong vortex formed in between adjacent holes and共b兲 the vortex core inside the injection hole can be linked with the area where string cavitation has been observed.
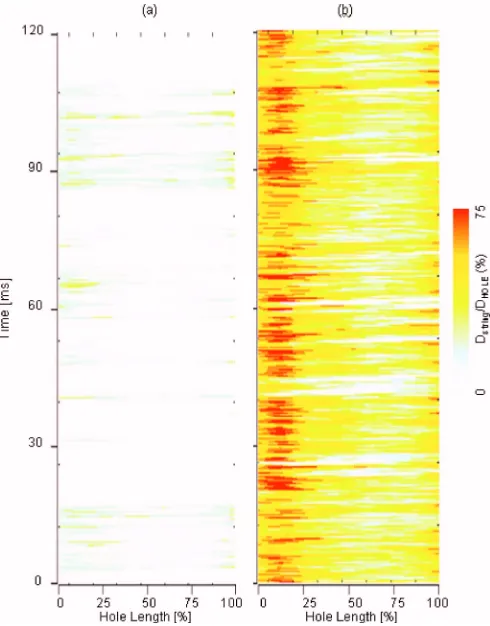
[image:7.612.51.299.53.114.2]In an effort to provide a visual representation of the thousand of the collected frames which show the dynamic development of the phenomenon at nominal quasisteady-state flow conditions, Fig.11is presented. On the plot, every horizontal line plotted indicates the instantaneous presence of string cavitation in the corresponding location along the injection hole. The color used is according to the local diam-eter of the string at each location, normalized with the hole diameter. Thus, this graph allows for a convenient represen-tation of the dynamics of string appearance and size for all individual frames collected. The last three plots 关Figs.
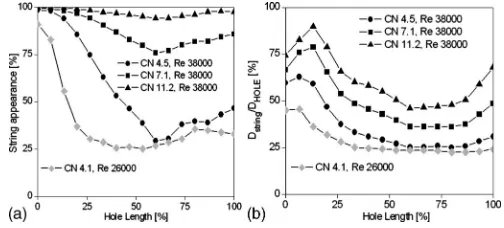
11共a兲–11共c兲兴indicate that the phenomenon is greatly affected by the CN keeping the same Reynolds number共fixed flow rate兲. Increasing CN results to more frequent appearance of cavitation strings which gradually occupy the whole injec-tion hole. Larger diameters can be found at the inlet and the exit of the injection hole while strings seem to become thin-ner and appear less at the central part. Comparison between Figs.11共a兲and11共b兲 indicates that the flow rate共Reynolds number兲 may also be an influential parameter but at low CNs.
From these plots, the percentage of string appearance at a specific location within the injection hole and the temporal mean size has been estimated and shown in Figs.12共a兲and
12共b兲, respectively. The plots reveal that at the hole inlet, cavitation strings are always present but they disappear as they move inside the injection hole. Toward the hole exit,
string appearance increases again due to their formation from the downstream air, as explained previously. The decrease in their appearance is also linked with a decrease of their size. At the hole inlet, strings may occupy up to 75% of the hole cross sectional area while their size drops to 50% at the central part of the hole. This variation in size is also present even at sufficient high cavitation and Reynolds numbers which correspond to continuous presence of cavitation strings inside the injection hole.
Another visual representation of cavitation strings can be seen in Fig.13. This plot shows the effect of cavitation and Reynolds numbers on the temporal averaged string presence at a specific location on the 2D viewing plane of the camera, which can be interpreted as the probability of finding a cavi-tation string at a particular location along the hole length. The images reveal that strings originate mainly from the bot-tom part of the hole inlet or exit while they follow a path toward the upper part of the central hole region.
All previous results refer to the low needle lift case of 0.3⫻10−3 m. Significant differences have been observed
[image:8.612.50.297.50.109.2]with increasing needle lift. A quantification of these differ-ences between the low and intermediate needle lift cases is presented in the following figures. As already pointed out, the geometric-induced cavitation site is significantly reduced or even eliminated with increasing needle lift for the tapered nozzle hole geometry due to the differences in the pressure
[image:8.612.310.562.51.165.2]FIG. 10. Effect of CN of string cavitation structure inside the tapered injec-tion hole共needle lift: 0.3⫻10−3 m and Re= 38 000兲.
FIG. 11. 共Color online兲Spatial extent and temporal development of string cavitation inside the injection as function of Reynolds and CNs for 0.3 ⫻10−3 m needle lift; color according to normalized string diameter.
[image:8.612.56.327.500.723.2]FIG. 12. Effect of Reynolds and CNs on共a兲string appearance along the hole length expressed as percentage of time and共b兲normalized mean string diameter along the hole length共needle lift: 0.3⫻10−3 m兲.
[image:8.612.315.560.564.730.2]distribution inside the nozzle. As a result, lesser cavitation strings have been observed; this can be seen by inspecting the instantaneous string appearance and size of Fig.14. For comparison, the corresponding image obtained at the same CN but for the low needle lift case is also replotted here.
Figure15shows the comparison between the two needle lift cases on the percentage time of string appearance for the highest CN. Increasing needle lift results to a gradual drop in the string appearance until they eventually disappear at the highest needle lift case investigated. Their size is also re-duced to more than half compared to the lowest needle lift case. This reduction is more profound at the hole inlet; as it can be seen, at this intermediate needle lift case the average
string diameter remains almost constant along the injection hole with an increasing trend toward the hole exit. Finally, Fig.16indicates that some differences can be also appreci-ated in the probability of finding string cavitation at a spe-cific location inside the injection hole. Strings now are occu-pying the upper surface of the injection hole toward its exit but they are still concentrated at the lower part at its inlet.
Closing, it has been considered useful to summarize the various findings of the observed flow regimes in flow maps that can be reconstructed by temporal and spatial averaging the instantaneous hole cavitation images at a specific opera-tion point. Such averages are performed from every operat-ing point and the correspondoperat-ing results are shown in the contour plot of Fig.17. The two axes selected for plotting the results are the CN and the needle lift since these two are the most influential parameters. The contour levels represent normalized averages of the percentage hole area occupied by cavitation; from the previous results this parameter is ex-pected to take values up to 50%. This is realized at low needle lifts and increased CN. The cavitation inception num-ber, of around 2, can be realized from these plots. Fully developed cavitation is realized for CNs above 5 as the hori-zontal shape of the plotted lines indicate.
IV. CONCLUSIONS
[image:9.612.314.559.49.155.2]High speed visualization of the cavitation structures forming in enlarged tapered Diesel VCO nozzle designs has been reported, addressing questions for their origin, area of formation, size, and lifetime. Interpretation of the obtained images has been assisted by CFD predictions of the nozzle and hole flow. The specific designs tested incorporate six
[image:9.612.52.297.50.363.2]FIG. 14.共Color online兲Effect of needle lift on spatial extent and temporal development of string cavitation inside the injection.共a兲 Needle lift: 1.5 ⫻10−3 m, Re= 66 000, and CN⬇11 and共b兲needle lift: 0.3⫻10−3 m, Re = 38 000, and CN⬇11; color according to normalized string diameter.
FIG. 15. Effect of the needle lift on共a兲string appearance along the hole length expressed as percentage of time and 共b兲 normalized mean string diameter along the hole length.
[image:9.612.332.542.609.731.2]FIG. 16.共Color online兲Effect of needle lift on spatial probability of string cavitation location. 共a兲 Needle lift: 1.5⫻10−3 m, Re= 66 000, and CN ⬇11 and共b兲needle lift: 1.5⫻10−3 m, Re= 38 000, and CN⬇11.
FIG. 17.共Color online兲Flow map showing the normalized percentage hole area occupied by string cavitation as function of needle lift and CN.
[image:9.612.51.298.615.721.2]cylindrical as well as tapered holes; tests were performed at fixed flow rate and needle lift positions. Cavitation images have revealed that although the conical shape of the converg-ing tapered holes suppresses formation of geometric cavita-tion, known to form at the entry to the cylindrical injection hole, string cavitation has been found to prevail, particularly at low needle lifts. Cavitation strings appear in areas where large-scale vortices develop and originate either from pre-existing geometric-induced cavitation sites or even from trapped air, present downstream of the hole exit. Computa-tional fluid dynamics simulations have shown that these vor-tical structures, which act as the tracers of cavitation strings are mainly formed upstream of the injection holes due to the nonuniform flow distribution upstream of the injection holes and persist also inside the injection hole. Cavitation strings have been frequently observed to link adjacent holes. The nozzle flow and cavitation strings have been found to be sensitive to small variations in the needle shape upstream of the injection holes as well as to needle eccentricity. The ef-fect of Reynolds and CNs on their temporal and spatial de-velopment has been examined. Processing of the acquired images has allowed estimation of the probability of finding cavitation strings at a specific location in the space between adjacent holes as well as inside them. Information for their frequency of formation, time of development, frequency of appearance and size within the injection hole has been also reported.
ACKNOWLEDGMENTS
The authors would like to thank Dr. J. M. Nouri and Professor C. Arcoumanis for providing the experimental rig and test facilities at City University London used in the present investigation.
1C.-T. Hsiao and G. Chahine, “Numerical study of cavitation inception due
to vortex/vortex interaction in a ducted propulsor,” 25th Symposium on Naval Hydrodynamics, 2004关J. Ship Res.52, 114共2008兲兴.
2R. E. A. Arndt, “Cavitation if fluid machinery and hydraulic structures,”
Annu. Rev. Fluid Mech. 13, 273共1981兲.
3R. E. A. Arndt, “An experimental insight into the effect of confinement on
tip vortex cavitation of an elliptical hydrofoil,” J. Fluid Mech. 290, 1
共1999兲.
4C.-T. Hsiao and L. L. Pauley, “Numerical study of the steady-state tip
vortex flow over a finite-span hydrofoil,”ASME J. Fluids Eng. 120, 345
共1998兲.
5C. E. Brennen, Cavitation and Bubble Dynamics 共Oxford University
Press, New York, 1995兲.
6R. E. A. Arndt, “Cavitation in vortical flows,”Annu. Rev. Fluid Mech.34, 143共2002兲.
7A. Andriotis, M. Gavaises, and C. Arcoumanis, “Vortex flow and
cavita-tion in Diesel injector nozzles,”J. Fluid Mech. 610, 195共2008兲. 8G. K. Batchelor,An Introduction to Fluid Dynamics共Cambridge
Publica-tions, Cambridge, 1967兲.
9P. G. Saffman, Vortex Dynamics 共Cambridge Publications, Cambridge,
1992兲.
10H. Chaves, M. Knapp, A. Kubitzek, and F. Obermeier, “Experimental
study of cavitation in the nozzle hole of Diesel injectors using transparent nozzles,” SAE Paper No. 950290共1995兲.
11C. Badock, R. Wirth, A. Fath, and A. Leipertz, “Investigation of cavitation
in real size Diesel injection nozzles,”Int. J. Heat Fluid Flow 20, 538
共1999兲.
12C. Arcoumanis, M. Badami, H. Flora, and M. Gavaises, “Cavitation in
real-size multi-hole Diesel injector nozzles,” SAE Paper No. 2000-01-1249共2000兲.
13C. Soteriou, M. Smith, and R. J. Andrews, “Cavitation hydraulic flip and
atomization in direct injection Diesel sprays,” IMechE Paper No. C465/ 051/93共1993兲.
14C. Soteriou, R. J. Andrews, and M. Smith, “Direct injection Diesel sprays
and the effect of cavitation and hydraulic flip on atomization,” SAE Paper No. 950080共1995兲.
15L. He and F. Ruiz, “Effect of cavitation on flow and turbulence in plain
orifices for high-speed atomization,” Atomization Sprays 5, 569共1995兲. 16J. H. Kim, K. Nishida, and H. Hiroyasu, “Characteristics of internal flow
in a Diesel injection nozzle,” International Journal of Fluid Mechanics Research 24, 34共1997兲.
17M. Blessing, G. König, C. Krüger, U. Michels, and V. Schwarz, “Analysis
of flow and cavitation phenomena in Diesel injection nozzles and its effect on spray and mixture formation,” SAE Paper No. 2003-01-1358共2003兲. 18H. Afzal, C. Arcoumanis, M. Gavaises, and N. Kampanis, “Internal flow
in Diesel injector nozzles: Modelling and experiments,” IMechE Paper No. S492/S2/99共1999兲.
19C. Arcoumanis, M. Gavaises, J. M. Nouri, E. Abdul-Wahab, and R. W.
Horrocks, “Analysis of the flow in the nozzle of a vertical multi hole Diesel engine injector,” SAE Transactions Journal of Engines 107, 980811共1998兲.
20H. Roth, M. Gavaises, and C. Arcoumanis, “Cavitation initiation: Its
de-velopment and link with flow turbulence in Diesel injector nozzles,” SAE Paper No. 2002-01-0214共2002兲.
21J. Jeong and F. Hussain, “On the identification of a vortex,”J. Fluid Mech. 285, 69共1995兲.
22M. Gavaises and A. Andriotis, “Cavitation inside multi-hole injectors for
large Diesel engines and its effect on the near-nozzle spray structure,” SAE Paper No. 2006-01-1114共2006兲.
23J. M. Nouri, N. Mitroglou, Y. Y. Yan, and C. Arcoumanis, “Internal flow
and cavitation in a multi-hole injector for gasoline direct-injection en-gines,” SAE Paper No. 2007-01-1405共2007兲.
24C. Soteriou, M. Smith, and R. J. Andrews, “Diesel injection: Laser light
sheet illumination of the development of cavitation in orifices,” IMechE Paper No. C529/018/98共1998兲.
25E. Giannadakis, D. Papoulias, M. Gavaises, C. Arcoumanis, C. Soteriou,
and W. Tang, “Evaluation of the predictive capability of Diesel nozzle cavitation models,” SAE Paper No. 2007-01-0245共2007兲.
26D. P. Schmidt, C. J. Rutland, and M. L. Corradini, “A fully compressible,
two-dimensional model of small, high-speed, cavitating nozzles,” Atomi-zation Sprays 9, 255共1999兲.
27A. K. Singhal, M. M. Athavale, H. Y. Li, and Y. Jiang, “Mathematical
basis and validation of the full cavitation model,”ASME Trans. J. Fluids Eng. 124, 617共2002兲.
28E. Giannadakis, “Modelling of cavitation in automotive fuel injector
nozzles,” Ph.D. thesis, Imperial College, University of London, 2005. 29M. Gavaises, D. Papoulias, A. Andriotis, E. Giannadakis, and A.
Theodor-akakos, “Link between cavitation development and erosion damage if Die-sel fuel injector nozzles,” SAE Paper No. 2007-01-0246共2007兲. 30E. Giannadakis, M. Gavaises, and C. Arcoumanis, “Modelling cavitation
in Diesel injector nozzle holes,”J. Fluid Mech. 616, 153共2008兲. 31E. Giannadakis, D. Papoulias, A. Theodorakakos, and M. Gavaises,
“Simulation of cavitation in outwards opening pintle injectors,”Proc. Inst. Mech. Eng., Part D共J. Automob. Eng.兲 222, 1895共2008兲.
32C. Arcoumanis, H. Flora, M. Gavaises, N. Kampanis, and R. Horrocks,
“Investigation of cavitation in a vertical multi-hole injector,” SAE Paper No. 1999-01-0524共1999兲.
33H. Roth, E. Giannadakis, M. Gavaises, C. Arcoumanis, K. Omae, I.
Sakata, M. Nakamura, and H. Yanagihara, “Effect of multi-injection strat-egy on cavitation development in Diesel injector nozzle holes,” SAE Pa-per No. 2005-02-1237共2005兲.
34A. Andriotis and M. Gavaises, “Influence of vortex flow and cavitation on
Near-nozzle Diesel spray dispersion angle,”Atomization Sprays 19, 247
共2009兲.
35A. Andriotis, M. Spathopoulou, and M. Gavaises, “Effect of nozzle flow
and cavitation structures on spray development in low-speed two-stroke Diesel engines,”Proceedings 25th CIMAC World Congress on
Combus-tion Engine Technology, 21–24 May 2007共International Council on