Colour text segmentation in web images based on human perception
D. Karatzas
a, A. Antonacopoulos
b,*aSchool of Electronics and Computer Science, University of Southampton, Southampton SO17 1BJ, United Kingdom bPattern Recognition and Image Analysis (PRImA) Research Lab, School of Computing, Science and Engineering University of Salford,
Manchester M5 4WT, United Kingdom
Received 24 July 2004; received in revised form 14 April 2006; accepted 16 May 2006
Abstract
There is a significant need to extract and analyse the text in images on Web documents, for effective indexing, semantic analysis and even presentation by non-visual means (e.g., audio). This paper argues that the challenging segmentation stage for such images benefits from a human perspective of colour perception in preference to RGB colour space analysis. The proposed approach enables the segmen-tation of text in complex situations such as in the presence of varying colour and texture (characters and background). More precisely, characters are segmented as distinct regions with separate chromaticity and/or lightness by performing a layer decomposition of the image. The method described here is a result of the authors’ systematic approach to approximate the human colour perception charac-teristics for the identification of character regions. In this instance, the image is decomposed by performing histogram analysis of Hue and Lightness in the HLS colour space and merging using information on human discrimination of wavelength and luminance.
Ó2006 Elsevier B.V. All rights reserved.
Keywords: Web document image analysis; Colour document analysis; Character segmentation; Text segmentation; Colour images
1. Introduction
Images constitute an important part of the information content of any document. In the case of Web documents, in particular, images play a crucial role in bringing visual impact to an otherwise plain text medium. In addition to illustrations, Web document designers also frequently cre-ate text in image form on Web pages, as an attempt to overcome the stylistic limitations of HTML.
The text that is created in image form corresponds more often than not to document headers, titles, links to sections or banners and, therefore, has a potentially high semantic value. One common use of this semantic value is in terms of indexing and ranking the Web pages that contain this text. For instance, a search term con-tained within a document title is likely to indicate that
the document is more relevant than another document in which the same term was found somewhere towards the end of its main body.
The situation can be worse if the text in image form is not found at all. As current search engine technology does not allow for text extraction and recognition in images (see
[1] for a list of indexing and ranking criteria for different search engines), the text in image form is ignored.
Ignoring (not being able to access) the text embedded in images can be a serious matter since this information may not be present anywhere else in the document. According to a study carried out by the authors[2], of the total num-ber of words visible on a Web page, 17% are in image form (most often semantically important text). Worse still, 76% of these words in image form do not appear elsewhere in the encoded (e.g., ASCII or UNICODE) text. These results agree with earlier findings[3]and clearly indicate an alarm-ing situation that does not seem to be improvalarm-ing.
Another significantly desirable goal is to obtain a uni-form representation (e.g., UNICODE) of all visible text (whether in image form or not) in a Web document. This
0262-8856/$ - see front matter Ó2006 Elsevier B.V. All rights reserved. doi:10.1016/j.imavis.2006.05.003
* Corresponding author.
E-mail address: [email protected] (A. Antonacopoulos).
URL:http://www.primaresearch.org(A. Antonacopoulos).
www.elsevier.com/locate/imavis
uniform representation can be used in a number of applica-tions such as translation, summarisation, voice browsing
[4] and automated content analysis [5] for rendering (re-flowing) on small screen devices such as PDAs and mobile phones. A number of further applications are emerging in the field of Web Document Analysis [6]. The extraction and recognition of text in image form is a significant step towards achieving this representation.
There has been a formal provision for specifying the encoded (ASCII/UNICODE) equivalent of the text in Web images, in the form of ALT tags in HTML. However, the same study mentioned earlier [2], assessing the impact and consequences of text contained in images, indicates that the ALT tag strategy is not effective. It was found that the textual description (ALT tags) of 56% of images on Web pages was incomplete, wrong or did not exist at all.
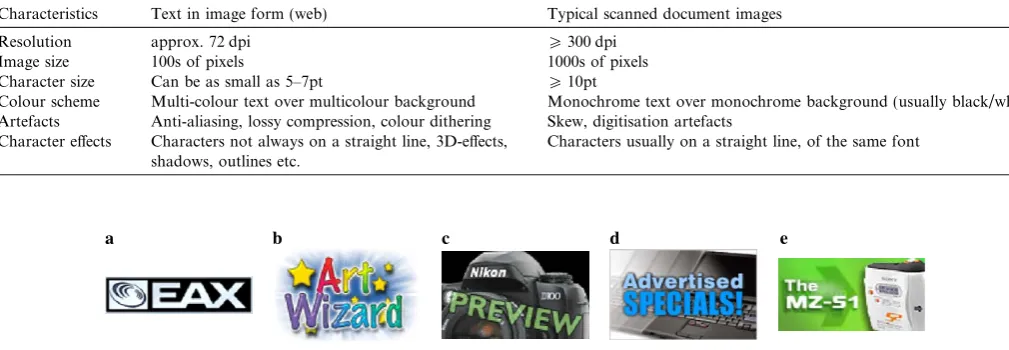
It can be seen from the above that there is a significant need for methods to locate and recognise the text in images in Web documents. Considering traditional optical character recognition (OCR), one may initially think that Web images present some advantages over scanned docu-ments, such as the lack of digitisation-induced noise and skew. However, the task is considerably difficult for tradi-tional OCR for a number of reasons. First, these (often complex) colour images tend to be of low resolution (usu-ally just 72 dpi) and the font size used for text is very small (about 5–7pt). Such conditions clearly pose a chal-lenge to traditional OCR, which works with 300 dpi images (typically bilevel) and character sizes of usually 10pt or larger. Moreover, images on Web documents tend to have various artefacts introduced by the authoring software (e.g., by performing colour quantization and lossy compression) [3]. A comparison of the characteris-tics faced by the task of analysing text in Web images versus the input expected by traditional OCR can be seen in Table 1.
Without loss of generality, the goal of achieving an encoded representation of the text in image form can be split into three objectives (and corresponding stages):
a.Character segmentation. The image must be segment-ed first so that regions corresponding to potential character components are separated from the back-ground. A successful segmentation will be one where background and foreground regions are not merged. b.Text extraction. Character-like components that fulfil criteria of constituting text (e.g., they appear to form a textline) are extracted.
c.Text recognition. Strings of character-like components are recognised, possibly aided by application or docu-ment-specific information.
In view of the difficulties posed by the image and text char-acteristics (as faced by traditional document analysis meth-ods) it can be appreciated that the segmentation stage is by far the most challenging. It is also the most crucial in terms of the detrimental effect of any errors made at that stage. As such, it merits special attention and individual study.
This paper presents a new approach for character seg-mentation, especially in complex Web images (e.g., see
[image:2.595.34.539.550.725.2]Fig. 1). It argues that the RGB colour space representation (commonly used by previous approaches – see below) is not suited to this particular task and adopts a segmentation method based on analysing differences in chromaticity and lightness that are closer to how humans perceive dis-tinct objects. This is the authors’ first approach among a number of alternatives in their pursuit of different ways to address this problem by exploiting human colour per-ception. An initial account of work in progress of this method has been presented in [7]. This paper constitutes the entire and detailed account of the now completed and systematically evaluated approach.
Table 1
Characteristics of text in web images versus scanned documents
Characteristics Text in image form (web) Typical scanned document images
Resolution approx. 72 dpi P300 dpi
Image size 100s of pixels 1000s of pixels
Character size Can be as small as 5–7pt P10pt
Colour scheme Multi-colour text over multicolour background Monochrome text over monochrome background (usually black/white) Artefacts Anti-aliasing, lossy compression, colour dithering Skew, digitisation artefacts
Character effects Characters not always on a straight line, 3D-effects, shadows, outlines etc.
Characters usually on a straight line, of the same font
a b c d e
In the following section, relevant previous work is brief-ly reviewed. In Section 3, the rationale of the whole approach and details of the different stages of the text seg-mentation method are described. Experimental results are presented and evaluated in Section 4. A brief description of a relevant extension in the form of text extraction is giv-en in Section5before the paper concludes in Section 6.
2. Related work
Responding to the evident need for text recovery from Web images, a small number of approaches have been pro-posed. Zhou and Lopresti [3]have proposed methods for text segmentation, extraction and recognition. Their method for text segmentation and extraction is based on clustering in the RGB colour space and then for each clus-ter assessing connected components whose colour belongs to that cluster. The approach works well with GIF images (only 256 colours) and when characters are of almost uni-form (constant) colour. With similar assumptions about the colour of characters, the segmentation approach of Antonacopoulos and Delporte[8]uses two alternative clus-tering approaches in the RGB space but works on (bit-re-duced) full-colour images (JPEG) as well as GIFs. Jain and Yu[9]report a segmentation method based on decompos-ing an original image into a number of foreground images and a background one. The original number of colours (8-bit or 24-bit images) is dramatically reduced (to between 4 and 8 distinct colours) by bit dropping and colour quan-tization in the RGB space. Although this method produces good results for relatively simple images, it shares the same problems with the other methods when more complex images are encountered.
Existing approaches assume a practically constant and uniform colour for text and fail when this is not the case. In practice, there are many situations where gradient or multicolour text is present. Furthermore, the background may also be complex (in terms of colour) so that the assumption that it is the largest area of (almost) uniform colour in the image[9]does not necessarily hold.
For completeness, it should be mentioned that the prob-lem of text recovery from Web images is by no means equivalent to the separate problems of recovering text from video sequences or real scenes, although it may appear so at a superficial level. The recovery of text from video (e.g., captions, credits) takes advantage of certain charac-teristics of video that are either not possible or not practical to assume for text in Web images. Such characteristics include the fact that text remains between frames or scrolls independently of the rest of the data[10]and that text is of uniform colour and appears on horizontal textlines[11].
With regard to the recovery of text from natural scenes (including scene text in video), there are also specific appli-cation-domain characteristics that do not generally apply to the recovery of text from Web images. On one hand, scene text can be unevenly illuminated and suffer from 3-D projection distortions. On the other hand, existing
methods are based on the assumptions that the text is of uniform colour (as well as its immediate background), that text originally exists in horizontal textlines and that there is high contrast between text and background in the image/ frame[12–14].
3. The method
The proposed method is designed to exploit characteris-tics of the human perception of colour differences, based on certain observations about Web image text. The most important observation is that text in Web Images is pro-duced using only software (no alterations occur by print-ing/scanning) and optimised for viewing on a monitor screen. This fact manifests itself in a number of ways. Apart from the issues listed in Table 1, the focus at this point is on the design process of Web image text. As this text (headers, banners etc.) is created in image form to add impact to the message of the document, the colour of the text and its visual distinction from the background is chosen (consciously or subconsciously) according to how humans perceive it to ‘stand out’.
The premise of this paper is that a method for text extraction in these circumstances will benefit from the anal-ysis of chromaticity and lightness differences as humans perceive them and not necessarily as expressed in the RGB space. In reality, colours that have equal distances in the RGB space are perceived by humans as having unequal differences1. Therefore, the difference between col-ours that were designed to be contrasting will be perceived by humans as disproportionately greater than that between other colours, whereas the pairwise distances in the RGB space may not be as indicative of the colour difference. Similarly, colours belonging to the same object will be designed to be perceived as more similar (irrespective of their RGB distance).
The approach presented in this paper is based on a com-bination of the Hue–Lightness–Saturation (HLS) represen-tation of computer colour and biological data that describes the means by which humans differentiate between colours of different wavelengths, colour purities and lumi-nance values. The rationale behind the selection of the HLS colour system, as well as the set of biological data used, will be described in the next section.
In overview, the method works in a split-and-merge manner, aiming to identify and analyse regions that are perceptually different in colour. The image is first (recur-sively) split, based on histogram analysis, and a tree struc-ture of layers is created. Connected components are then identified in the leaf layers of the tree structure.
quently, a merging process combines connected compo-nents of similar colour and satisfactory interrelationship (to progressively assemble characters) in a bottom up fash-ion, starting in the leaf layers, and moving up to the root layer of the tree.
3.1. Human colour perception and discrimination
Colour is expressed by measurements of its physical
properties: wavelength, colour purityand luminance. These properties give rise to the psychophysical attributes of
hue, saturationandlightness, which constitute a description of colour asperceivedby humans. The approach described in this paper has been designed so that, both the colour sys-tem employed and the way of expressing and evaluating colour differences are directly related to this description of the human perception of colour.
The choice of colour system has been influenced by the observation that the use of perceptually oriented quantities (the psychophysical attributes described above) can prove more suitable for the analysis of images created to be viewed by humans [15,16] than RGB components (which are used in computer systems to represent colour). Each of the components of the HLS colour system (Hue, Light-nessandSaturation), which is used here, is directly related to the corresponding psychophysical attribute (hue, light-ness and saturation).
Another important consideration in the design of the approach described here is the expression of the ability of humans to distinguish between colours. This ability is affected by numerous factors primarilywavelength separa-tion(i.e., distance between given wavelengths),colour puri-ty and lightness [17]. As wavelength separation (between colours) increases, the ability to discriminate between col-ours increases accordingly. Increases in colour purity max-imize the perceived distance between colours. Finally, humans are able to differentiate between colours with high-er lightness values much more easily than between those with lower lightness values.
The ability of the HLS colour system to express the above factors is straightforward. TheH (Hue) component of the HLS system corresponds to the perceived wave-length of each colour, thus larger differences in Hue are translated to better wavelength separation. TheS( Satura-tion) component corresponds to colour purity, while theL
(Lightness) component corresponds to lightness. Based on the above discussion, the case for using the HLS colour sys-tem for colour analysis of Web images is further strengthened.
In order to characterise whether two colours are per-ceived as similar or not, based on given HLS values, the representation of colour in HLS must be coupled with information about the intrinsic thresholds of human vision (i.e., the least noticeable differences that a human can per-ceive in Hue, Lightness and Saturation).
Certain biological information on colour discrimination (by humans) has been published in terms of expressions of
minimum discrimination ability as a function of each of the
physicalproperties of colour (wavelength, colour purityand
luminance as mentioned in the beginning of this section)
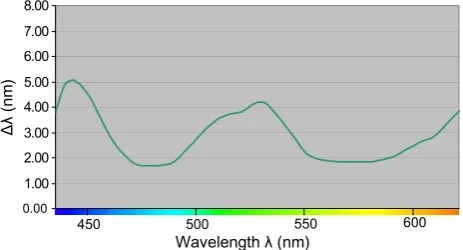
[18,19]. The diagram in Fig. 2 illustrates the change in wavelength required to produce a perceived change in hue. Experiments were designed and conducted by the authors in order to establish whether existing colour dis-crimination information could be used in the specific appli-cation domain (colour discrimination between small-sized coloured areas viewed under largely uncontrolled everyday viewing conditions). The measured thresholds correspond-ed well to the publishcorrespond-ed biological information, verifying thus the applicability of existing data to the particular application.
However, there is no published information on the low-esthue discrimination thresholdsofnon-spectralcolours (the ‘‘line of purples’’), since these colours do not really have a dominant wavelength (they are the effect of a natural white colour lacking a specific wavelength around the green area). Therefore, another aspect of experimentation by the authors was concerned with establishing these discrim-ination thresholds. The initial expectation that the thresh-olds would be similar to the complementary (green) colours was verified experimentally.
Finally, the lowest saturation discrimination thresholds
were established. More specifically, the authors measured the amount of pure hue needed to be added to white, mid-grey and black until the hue becomes detectable. All thresholds were experimentally derived, with the exception of the case of white for which existing biological informa-tion[18] was noted and verified. The applicability of the experimental results to non-spectral colours was also verified.
The above information on colour discrimination thresh-olds (as verified and extended by the authors) is utilised in each stage of the method described below in order to assess colour similarity.
3.2. Chromatic/achromatic layer splitting
[image:4.595.312.544.70.195.2]achromatic content (pixels) of the image for independent further processing.
Chromatic colour is any colour for which a dominant wavelength can be identified (red, green, blue, yellow, etc). On the other hand, if no dominant wavelength can be identified, a colour is said to beachromatic (shades of grey, including black and white).
Separating chromatic from achromatic pixels at this stage is important as any process that examines Hue values will fail if applied to achromatic pixels, since the Hue for these pixels is either undefined, or unreliable[20].
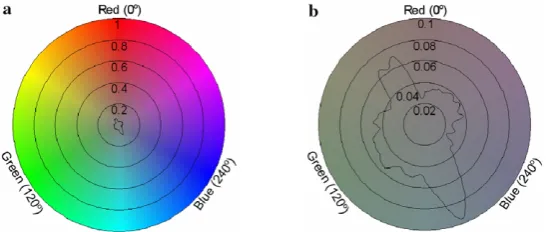
The exact levels of Saturation and Lightness for which colours should be considered achromatic are not straight-forward to set. The extended biological data prepared by the authors (see previous section) on the least noticeable differences in colour purity (saturation) are used here to define the border surface between chromatic and achro-matic pixels in the HLS colour space. InFig. 3a slice of the HLS colour space is presented, where the marked cen-tre area denotes the colours considered achromatic based on the measurements made. It should be noted that in the authors’ experience this use of information derived from experiments in realistic situations (taking into account the effect of different Hues) is superior to using a single Saturation (and Lightness) threshold for separating
chromatic from achromatic pixels (the border surface would have been depicted as a circle inFig. 3).
Based on this information, the image is split in two lay-ers, one containing all the achromatic pixels (perceived as grey-levels) and the other all the chromatic ones (see first level of the tree in Fig. 8). Characters may be present in either or both layers.Fig. 4shows an example of an image in which some characters (‘‘Forum’’ and ‘‘Boon or Bane?’’) are present wholly in the achromatic layer while others (‘‘The U.S. in Panama’’) are wholly in the chromatic layer.
Fig. 5 shows an instance of an image where parts of the same character lie in both the achromatic and the chromatic layers.
The chromatic layer is further processed based on both the Hue and Lightness components, whereas the achromat-ic layer is strachromat-ictly kept out of any subsequent processing involving Hue.
3.3. Further splitting
This subsequent splitting process attempts to identify and describe areas ofsimilar(as humans perceive it)colour
in the image. To achieve this, the chromatic and achromat-ic layers are split into a number of more refined (in terms of colour uniformity) layers, based on global information
[image:5.595.165.440.389.505.2]Fig. 3. (a) Outline of (perceived) chromatic/achromatic boundary surface shown through a slice atL= 128, and (b) magnified.
[image:5.595.122.477.548.610.2]Fig. 4. Example of an image (a) where some characters are in the achromatic (b) and some in the chromatic (c) layer.
[image:5.595.115.480.649.734.2]derived from the (Hue or Lightness, as appropriate) histo-gram of each layer.
3.3.1. Achromatic layer
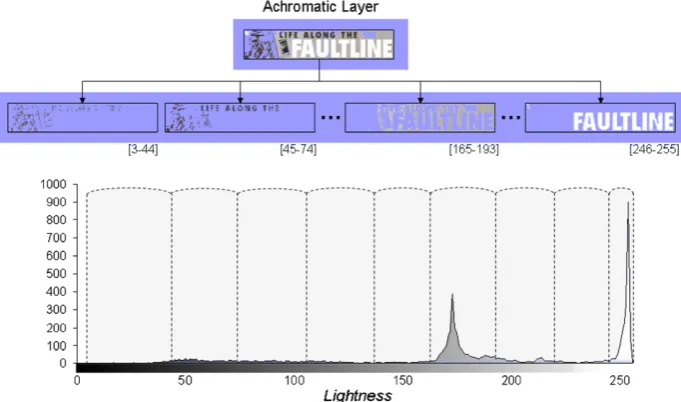
For the pixels of the achromatic layer, the histogram of Lightness (the only available information) is computed and peaks are identified by locating minima and maxima. Each peak is described by a left-minimum, a maximum and a right-minimum. An example of a Lightness histogram can be seen at the lower part ofFig. 6.
If two or more peaks are present the splitting process proceeds as follows, otherwise it stops (leaving the achro-matic layer unchanged). Consecutive peaks are analysed by examining the horizontal distance (Lightness value difference) between them and their corresponding height difference (ratio of peak maxima).
Certain groups of (adjacent) peaks are combined if those peaks represent colours (shades) that are deemed to be per-ceived as ‘similar’ by a human observer.Similarity is con-sidered and measured in two complementary ways using the two measurements mentioned above. The first, Light-ness valuesimilarity, is determined based on the results of the experiments designed and conducted by the authors, which established the least noticeable (by humans) light-ness differences, as explained in Section 3.1. The second, the similarity of theheightof the adjacent peaks (the ratio of peak maxima) under consideration is assessed to accom-modate for the possible presence of gradient colour (as observed in experiments)[20]. At the end of this peak anal-ysis and combination process, the pixels in the layer that have Lightness values under each final peak group, are exported to a separate sub-layer. Fig. 6shows the achro-matic layer of an image (root of the tree) and the corre-sponding Lightness histogram. The final (combined) peak groups are shown as intervals in the histogram and some
of the corresponding sub-layers (for brevity) are illustrated as children of the achromatic layer.
The resulting sub-layers cannot be split further, since the only information available for achromatic pixels is their Lightness values. Therefore, the splitting process for the achromatic layer stops at this point.
3.3.2. Chromatic layer
For chromatic colours, the most important factors in terms of colour discrimination are mostly Hue and Light-ness[17]. Consequently, there are two options to first split the chromatic layer: either based on the Hue histogram or based on the Lightness histogram. In that respect, previous research[21,22]indicates that Hue has the greatest discrim-ination power among colour components and, more often than not, humans first differentiate objects according to their Hue, and then interpret differences in Lightness as shadows or highlights of the objects[22].
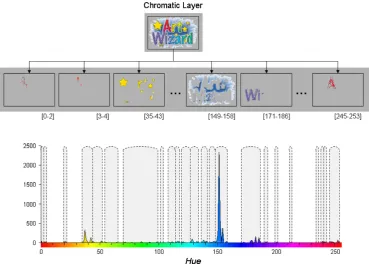
[image:6.595.123.464.519.720.2]In view of the above, the histogram of the Hue values is first computed for the pixels of the chromatic layer and peaks are identified (in the same way as peaks of the Light-ness histogram in the achromatic layer). Again, the hori-zontal distance (Hue difference) between consecutive peaks and their corresponding difference in height is calcu-lated. Adjacent peaks are combined in this case if the Hue values spanned by the peaks are deemed to be perceived as ‘similar’ by a human observer. Similarity is assessed by examining both Hue similarity (defined based on the bio-logical data discussed in Section 3.1) between peaks and the corresponding height ratio (to account for the presence of gradient colour). The chromatic layer is thus split into sub-layers of different Hue (each layer containing the range of hues under each of the final peaks). An example of chro-matic layer splitting based on the Hue histogram is shown inFig. 7. The chromatic layer of the image (root) gives rise
to the histogram at the lower part of the figure. Note that the absence of certain hues is manifested by a discontinu-ous histogram. Groups of combined peaks are indicated by intervals (for illustration purposes). The sub-layers pro-duced for some of these intervals are shown as children of the chromatic layer.
For each of the sub-layers produced, the Lightness his-togram is then computed, peaks are identified and the peak analysis and grouping process is performed (as in the ach-romatic layer). New image sub-layers are created for pixels with Lightness values in the ranges under each of the final peak groups.
It should be noted that the splitting process is terminat-ed early if only a single peak is identifiterminat-ed in the histogram currently analysed (Hue or Lightness). In that case the cor-responding layer remains unchanged (not split).
3.3.3. Layer tree
Following the splitting of the image into achromatic and chromatic layers and their corresponding sub-layers, a tree representation is produced. The root represents the original image and the nodes correspond to each of the layers pro-duced by the splitting process. Each layer contains regions of a certain distinct (to humans) Hue or Lightness.Fig. 8
illustrates the layer tree representation.
3.4. Colour connected component information
At this point, each bottom (leaf) layer contains a subset of the pixels of the original image, as filtered through the (successive) splitting (i.e., the union of all leaf layers is
the original image). In order to prepare for possible merg-ing (Section 3.5), connected components are identified on each leaf layer, using a one-pass labelling algorithm [23]
and the average colour of each component is computed and stored.
Each connected component corresponds to a region in the image that has an effectively distinct (to humans) col-our. In terms of characters, each connected component may correspond to a single character but, more often than not, it corresponds to part of a character or stroke. It should be noted at this point that over-splitting of charac-ters occurs regularly due to the cautious nature of the splitting process (the similarity criteria are strictly enforced regarding the separation of colours that are per-ceived to be even slightly different). In contrast, the sub-sequent merging process (Section 3.5) is based on a more relaxed colour similarity principle (components whose colour may be perceived as ‘slightly’ different are still merged) and is also guided by local evidence. The fea-tures (characteristics) used and their derivation are explained next.
3.4.1. Vexed area
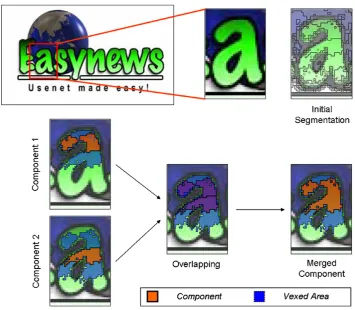
[image:7.595.118.488.68.333.2]The principle of component extensibility is examined first, based on colour similarity. For each component in each leaf layer, its neighbourhood in the original image is analysed to determine which pixels could be annexed to the component based on colour similarity. The pixels com-prising thatpotentialextension of that region are collective-ly referred to as thevexed areaof the region (see the blue areas of the two components inFig. 9).
The overarching idea is that a human should not be able to perceive asignificantdifference between the core region (component) and the vexed area pixels. For layers resulting from splitting based on the Hue histogram, the analysis cri-terion corresponds to humans’ minimum colour discrimi-nation ability as a function of wavelength. For layers resulting from splitting based on the Lightness histogram the criterion corresponds to humans’ minimum colour dis-crimination ability as a function of lightness.
[image:8.595.146.444.72.239.2]The thresholds for the colour similarity criteria have been experimentally determined based on the biological data (with respect to wavelength and lightness) explained earlier. It should be noted, however, that there is a sig-nificant difference in the use of this biological data. In the determination of vexed areas the thresholds are rela-tively relaxed as the emphasis is on collecting all pixels that a human will perceive as similar. In contrast, in the splitting stage the emphasis was on strict distinction Fig. 9. Merging process. Starting from the connected components identified in the leaf layers (Initial Segmentation) pairs of components and their vexed areas are examined. If the overlapping degree is more than a specified threshold the components are merged to form a single component with a vexed area defined as the combination of the original vexed areas.
Original Image
…
…
……
…
Lightness Layer
Lightness Layer Lightness Layer
Lightness Layer
Lightness Layer
Lightness Layer
Lightness Layer
Lightness Layer
Lightness Layer Hue Layer
Hue Layer
Hue Layer
ChromaticLayer
[image:8.595.114.470.276.586.2]Achromatic Layer
between any pixels that could be perceived as being
different.
After this examination of the neighbourhood of each component, all pixels that fulfil the relevant colour similar-ity criterion are noted as the vexed area of that component.
3.4.2. Overlapping
In addition to component extensibility (determination of vexed areas) as discussed above, the topological relation-ship between components is examined. This leads to the need for an expression ofoverlapbetween two components (taking also into account their vexed areas).
An expression of overlap is derived as follows: Given two componentsaandb, and their associated vexed areas
av and bv, NCP(av,b) is the number of common pixels between the vexed area of component a and component
b, andNCP(a,bv) is the number of common pixels between componenta and the vexed area of component b. There-fore,NCP(av,b) =jav\ bjandNCP(a,bv) =ja\bvj.
The overlapping between componentsa andb, denoted
Ovl(a,b), is defined as in Eq.(1), as the number of overlap-ping pixels between the components a and b, given by
NCP(av,b) +NCP(a,bv),divided by the maximum number of pixels that could potentially overlap.
Ovlða;bÞ ¼ NCPðav;bÞ þNCPða;bvÞ
minðAreaðavÞ;AreaðbÞÞ þminðAreaðaÞ;AreaðbvÞÞ
ð1Þ
whereArea(x) denotes the number of pixels ofx.
Detailed experiments carried out by the authors have shown thatOvl(a,b) gives a reliable indication of the suit-ability of the overlap (for the purpose of determining and prioritising a possible merger – see below). However, it is less reliable in special cases where the areas of the compo-nents involved are comparable to the number of pixels overlapping: NCP(av,b) +NCP(a,bv). To take this into account a suitable weighting function was experimentally derived[20]:
Wða;bÞ ¼ NCPðav;bÞ þNCPða;bvÞ
2minðAreaðaÞ;AreaðbÞÞ ð2Þ
The weighted overlapping, referred to from here onward as theoverlapping degree, for a pair of componentsa and b,
W(a,b)ÆOvl(a,b), is the feature finally used. For each pair of components, the overlapping degree is computed and stored.
3.5. Merging strategy
In each of the leaf layers, every possible combination of components is examined, and, if their overlapping degree is above a pre-defined threshold (experimentally derived: 0.56), a possible merger is identified. All identified possible mergers in each layer are kept in a sorted list and merging starts with the pair of components having the highest over-lapping degree. When two componentsaandbare merged,
the two core regions are combined to form the core region of the new componentc(i.e.,c=a[b). The vexed areacv of the new core component will be the remainder of the vexed areas of a and b (i.e., cv= {pjp2(av[bvÙ
p62a[b}). An illustration of the merger of two compo-nents is shown in Fig. 9. First, the initial segmentation (region contours) is indicated. Two components that form part of the character and their corresponding vexed areas are shown next. The overlap of core regions and vexed areas is shown for the two components (indicated as blend-ed colours). Finally, the newly creatblend-ed component is pre-sented with its vexed area.
After each merger is completed, other potential mergers involving one of the two no-longer-existing componentsa
and b with an existing component, e.g., k, are reassessed to take into account the resulting newly created compo-nent,c. The overlapping degree betweenkandcis calculat-ed and the list of potential mergers is suitably updatcalculat-ed. The process continues as long as there are potential mergers in the list with overlapping degree above the threshold (as described in the beginning of this section).
After all possible mergers have taken place within each of the leaf layers, merging between the components of all sibling layers (across the same level) is performed. This involves copying the final components of the leaf layers one level up, and repeating the merging process in the layer that receives the components. At the end of the merging process in that parent layer, the vexed areas of the resulting components need to be refined, so that they are representative of the new layer in which they now reside (the vexed areas of the components were identified in the leaf layers, according to the type of those leaf lay-ers). For instance, after copying all the components iden-tified in the Lightness leaf layers to their parent Hue layer, the vexed areas must be refined so that they con-tain pixels not only of similar Lightness to the compo-nent, but of similar Hue as well. This is important, as merging between sibling Hue layers (at the same tree level) will be performed next, and this merging must be based on Hue similarities.
After the refinement of vexed areas a component integ-rity check is performed. The purpose of this process is to assess the validity of components resulting from the previ-ous merging activity and, if necessary, to dismantle merged components that are unlikely to represent parts of charac-ters. This situation may happen when at the end of all pos-sible mergers there exist components that are disjoint (the union of the merged components is not a single connected component). In such a case, the disjoint components are relabelled as separate components.
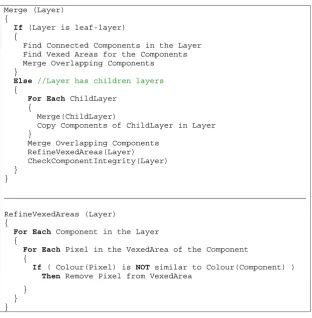
and component integrity checking. The resulting compo-nents are then copied to the next higher level. An illustra-tion of the process is given in the form of pseudo-code in
Fig. 10.
At the end of the final merging process in the top-level (root) layer, the original image has been segmented into a number of connected components, some of which will corre-spond to characters (or character fragments) and the rest will be part of the background (everything which is not text).
Thecharacter segmentation stage is now complete and forms the basis for further processes towards the extraction and recognition oftext. A detailed evaluation of the com-plete segmentation process is given below (Section 4), fol-lowed by an examination of the possibilities offered beyond segmentation.
4. Evaluation
The degree of success of any process that follows seg-mentation will heavily depend on how well the background is separated from the characters. As mentioned in the Introduction, the character segmentation process is both crucial to the performance of subsequent processes and has to deal with certain challenges that are not necessarily faced by extraction and recognition. As such, the character segmentation results constitute a milestone that warrants individual study and evaluation, without the additional,
possibly application-specific stages that introduce their own errors.
The performance of the segmentation method has been evaluated using a dataset created by the authors. Signifi-cant attention has been paid to design the dataset to be as representative as (realistically) possible of the variations of text in image form present on the Web. To that effect, two issues play an important role in the selection of images. First, thesizeof the dataset is determined by balancing the specific evaluation needs with the difficulty in its creation. For segmentation evaluation (as opposed to OCR or text retrieval evaluation, for instance) a relatively compact dataset is generally sufficient in representing the difficulties at the pixel level (a consideration shared by previous approaches as well[3,9]).
Second, the selection of the images must be based on both technical difficulty (to represent a variety of condi-tions) and context of use criteria (to reflect a realistic dis-tribution of the different levels of difficulty). The dataset focuses on images containing text that a typical user may encounter on a Web document they will find while fulfill-ing a typical everyday request. Images containfulfill-ing text on websites of newspapers, companies, academic sites, e-commerce sites, search engines etc. were included in the sample. The function (header, menu item, logo, equa-tion etc.) of an occurrence of image text in the corre-sponding Web document was also considered when
Merge (Layer) {
If (Layer is leaf-layer) {
Find Connected Components in the Layer Find Vexed Areas for the Components Merge Overlapping Components }
Else //Layer has children layers {
For Each ChildLayer {
Merge(ChildLayer)
Copy Components of ChildLayer in Layer }
Merge Overlapping Components RefineVexedAreas(Layer) CheckComponentIntegrity(Layer) }
}
RefineVexedAreas (Layer) {
For Each Component in the Layer {
For Each Pixel in the VexedArea of the Component {
If ( Colour(Pixel) is NOT similar to Colour(Component) )
Then Remove Pixel from VexedArea
} } }
creating the dataset, so that the resulting collection is representative in this respect as well.
Furthermore, text in the images of the dataset is charac-terized as eitherreadableornon-readable. A minimum size (width of 4 pixels and height of 6 pixels) was determined for a character to be considered readable, since even humans have difficulties recognizing characters smaller than this threshold (seeFig. 11(a)). Other issues that affect read-ability (by humans) are the choice of colours and the use of anti-aliasing (seeFig. 11(b)). The classification of characters was made by a human operator, on a case-by-case basis.
The dataset comprises115images with varying degrees of complexity. The number of characters in the images ranges from 2 to 83. On average, an image was found to have around 20 characters, out of which around 16 are readable. In total, the images in the dataset contain2404
characters, out of which 1852 are classified as readable and552are classified as non-readable.
Finally, the images in the dataset were grouped into four categories according to the colour combinations of text and background.Category Aholds images that contain multi-colour characters over multimulti-colour background (14 imag-es). Category B contains images that have multicolour characters over single-colour background (15 images).
Category C has images with single-colour characters over multicolour background (37 images). Finally,Category D
holds images with single-colour characters rendered over single-colour background (49 images). The distribution of images in the four categories reflects the occurrence of images of those types on Web documents.
The evaluation of the segmentation method was per-formed by visual inspection of the results produced on all the images in the dataset (similarly to previous approach-es). Automated evaluation was considered but was not pos-sible in this case for two reasons. First, the authors consider that the use of synthetic data will not be represen-tative enough of the situations under evaluation. Second, there is no ground truth available for real Web images (it is actually not straightforward to create accurate segmenta-tionground truth for such images[20]).
Each character contained in the segmented image is characterised as identified, split, merged ormissed. Identi-fied characters are those that are described by a single com-ponent. As split are considered the characters described by more than one component, as long as each of those
compo-nents contain only pixels of the character in question (not any additional background or other character pixels). If two or more characters are described by only one compo-nent (which does not contain any non-character pixels), then they are considered as merged. Finally, missed are the characters for which no component or combination of components exists that describes them completely with-out containing non-character pixels.
In practical terms, any segmentation where a character is not ‘‘missed’’ is useful for further processing, even if the character is ‘‘merged’’ or ‘‘split’’. Furthermore, it should be noted that the above characterisation of segmen-tation results is very strict in, effectively, considering any character that contains non-character pixels as wrong. This is a conscious choice, however, to assess the absolute per-formance of the segmentation method without including any components that could potentially pose problems to OCR.
The overall results for the split and merged method can be seen inTable 2. In total, the method was able to correct-ly identify 1290(69.65%) out of 1852readable characters, while 151 (8.15%) characters were merged, 271 (14.63%) were split and140(7.56%) characters were missed. In addi-tion, out of the 552 non-readable characters, the method was able to identify 184(33.33%).
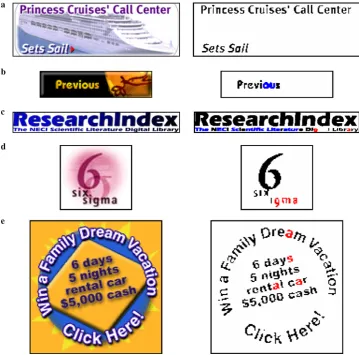
Examples of representative images from the dataset and the corresponding results are shown in Fig. 12. In the results, characters in black colour have been identified, characters in blue colour have been merged, and characters in red have been split (however, no background parts have been merged with characters).
As expected, the method worked better for images in categories C and D – i.e., images containing text of single colour. However, considering the complexity encountered, it also performed satisfactorily well on images in categories A and B – i.e., those containing multicoloured text. It should be mentioned that over-splitting the image into lay-ers, does not seem to affect the merging process, which is able to combine (reconstitute) the oversplit components, so long as their fragments are visually similar. Naturally, the overall results reflect the increasing difficulty in catego-ries where the text and/or the background are multicoloured.
[image:11.595.154.454.623.733.2]It is not very meaningful to compare directly the results of this method to existing ones as, in contrast to those, the
proposed approach is applicable to a much broader range of character images that pose widely varying levels of difficulty.
More specifically, of the very few methods dedicated to the analysis of text in web images, detailed results are only given in the work of Lopresti and Zhou [3]. As described in Section 2, that method is designed for (and consequently evaluated on) GIF images, which contain a maximum of 256 colours only. Moreover, the assess-ment of that method was concentrated on a subgroup
[image:12.595.36.554.89.208.2]of Web images that meet the assumptions set for that method (the test images contain homogeneously coloured text). For that specific type of image, a detection rate of 78.8% is reported. The authors of that method also report a relatively low character detection rate (36.6%) on a very small set of images in which the character and the back-ground colours are not homogeneous. Similarly, for very small characters (in the ‘unreadable’ category in the con-text of this method), a low detection rate of 44.3% is reported.
[image:12.595.111.471.237.592.2]Fig. 12. A number of representative images with the corresponding results. Table 2
Results of the split and merge method over all images of the dataset
Number of characters Identified Merged Split Missed
All categories Readable 1852 1290 (69.65%) 151 (8.15%) 271 (14.63%) 140 (7.56%) Non-readable 552 184 (33.33%) 22 (3.99%) 160 (28.99%) 186 (33.70%)
Category A Readable 206 115 (55.83%) 0 (0.00%) 60 (29.13%) 31 (15.05%)
Non-readable 58 12 (20.69%) 2 (3.45%) 15 (25.86%) 29 (50.00%)
Category B Readable 260 135 (51.92%) 48 (18.46%) 67 (25.77%) 10 (3.85%)
Non-readable 42 6 (14.29%) 3 (7.14%) 3 (7.14%) 30 (71.43%)
Category C Readable 699 530 (75.82%) 48 (6.87%) 64 (9.16%) 57 (8.15%)
Non-readable 150 55 (36.67%) 11 (7.33%) 45 (30.00%) 39 (26.00%)
Category D Readable 687 510 (74.24%) 55 (8.01%) 80 (11.64%) 42 (6.11%)
Bearing in mind that a direct comparison between the method of Lopresti and Zhou[3]and the proposed one is not very meaningful, in broad terms the performance of the two methods on the homogeneous images is compara-ble. However, the proposed approach is also applicable to the very wide range of images found on the Web and in this respect it is superior to previously published methods.
5. Beyond character segmentation
This section explores concrete ways of exploiting the results of character segmentation within the context of Web image text recognition. To demonstrate a viable extension of the character segmentation process, the authors have developed a test application to identify text-like groups of connected components [20]. The objective is to extract sets of connected components that satisfy cri-teria for being part of text (without any attempt to recog-nise the text).
It must be noted that there can be several approaches to the extraction and recognition of the text based on the same segmentation results. These can range from simple connected component analysis and OCR to integrated approaches involving feedback from recognition and the utilisation of contextual information. The demonstrator approach described here is relatively simple and is based on geometric criteria only.
The method exploits the fact that characters belonging to the same word or textline share common characteris-tics, e.g., they are similarly sized and lie on the same base-line (not necessarily a straight base-line), and attempts to identify such groups of connected components. The com-ponents are first grouped according to their size and an attempt is made to identify straight lines of components in each size group. For each line identified an assessment process follows, which indicates whether it is a valid text-line or not.
The assessment process involves two scoring mecha-nisms. One mechanism examines the distances between suc-cessive components in a candidate (identified in the previous step) line, and assigns a higher confidence value to lines whose components have equal distances between them. The other mechanism devised for assessing the lines, uses the projection profile of the components along the direction of the line identified, and examines whether this projection is structurally similar to the projection profile expected from a real textline. Lines yielding a score above a specified confidence threshold (defined as part of the scor-ing scheme) are output as true character lines.
The method is able to identify lines (straight or curving) of components corresponding to characters in most of the cases as long as a good segmentation has been obtained. This highlights the importance of the character segmenta-tion stage to the text extracsegmenta-tion process.
The most frequent problem encountered is the wrongful inclusion (in the extracted text-like lines) of components which do not actually correspond to characters. A possible
solution to this issue would be to incorporate additional component filtering using further character properties (post processing steps like this are suggested as future work). It should be noted, however, that this type of error further highlights that the character segmentation results are indeed useful and that the segmentation method is successful.
6. Concluding remarks
This paper has presented a novel method to the topical problem of segmenting characters in colour Web images containing text (headers, titles, banners etc. that are often artistically created). In contrast to previous approaches, this paper abandons analysis in the RGB colour space and adopts a segmentation method based on analysing dif-ferences in chromaticity and lightness that is closer to how humans perceive distinct objects. Human perception-spe-cific characteristics of the method were presented and dis-cussed and the segmentation method was detailed and evaluated. Results show a superior ability of the method to segment characters in complex situations such as in the presence of varying colour and texture (characters and background).
References
[1] Search Engine Watch,http://searchenginewatch.com.
[2] A. Antonacopoulos, D. Karatzas, J. Ortiz Lopez, Accessing textual information embedded in internet images, in: Proceedings of SPIE Internet Imaging II, San Jose, USA, January 24–26, 2001, pp. 198– 205.
[3] D. Lopresti, J. Zhou, Locating and recognizing text in WWW images, Inf. Retrieval 2 (2000) 177–206.
[4] M.K. Brown, Web page analysis for voice browsing, in: Proceedings of the 1st International Workshop on Web Document Analysis (WDA ’2001), Seattle, USA, September 2001, pp. 59–61.
[5] G. Penn, J. Hu, H. Luo, R. McDonald, Flexible web document analysis for delivery to narrow-bandwidth devices, in: Proceedings of the 6th International Conference on Document Analysis and Recog-nition (ICDAR’01), Seattle, USA, September 2001, pp. 1074–1078. [6] A. Antonacopoulos, J. Hu (Eds.), Web Document Analysis:
Chal-lenges and Opportunities, Series in Machine Perception and Artificial Intelligence, World Scientific Publishing Company, New York, 2003. [7] A. Antonacopoulos, D. Karatzas, An anthropocentric approach to text extraction from WWW images, in: Proceedings of the 4th IAPR International Workshop on Document Analysis Systems (DAS2000), Rio de Janeiro, Brazil, December 2000, pp. 515–525.
[8] A. Antonacopoulos, F. Delporte, Automated interpretation of visual representations: extracting textual information from WWW images, in: R. Paton, I. Neilson (Eds.), Visual Representations and Interpre-tations, Springer, London, 1999.
[9] A.K. Jain, B. Yu, Automatic text location in images and video frames, Pattern Recognit. 31 (12) (1998) 2055–2076.
[10] R. Lienhart, F. Stuber, Automatic text recognition in digital videos, in: Proceedings of SPIE Volume: 2666 – Image and Video Processing IV, 1996, pp. 180–188.
[11] H.K. Kim, Efficient automatic text location method and content-based indexing and structuring of video database, J. Vis. Commun. Image Represent. 7 (1996) 336–344.
[13] P. Clark, M. Mirmehdi, Recognising text in real scenes, Int. J. Doc. Anal. Recognit. 4 (2002) 243–257.
[14] S. Messelodi, C.M. Modena, Automatic identification and skew estimation of text lines in real scene images, Pattern Recognit. 32 (1999) 791–810.
[15] R.S. Ledley, M. Buas, T.J. Golab, Fundamentals of true-color image processing, in: Proceedings of the 10th International Conference on Pattern Recognition, Atlantic City, New Jersey, June 1990, pp. 791– 795.
[16] S. Tominaga, Color image segmentation using three perceptual attributes, in: Proceedings of the Conference on Computer Vision and Pattern Recognition, Miami, Florida, 1986, pp.628–630.
[17] L.D. Silverstein, Human factors for color display systems: concepts, methods and research, in: H.J. Durrett (Ed.), Color and the Computer, Academic Press, Orlando, Florida, 1987, pp. 27–61.
[18] G. Wyszecki, W. Stiles, Color Science: Concepts and Methods, Quantitative Data and Formulae, 2e, Wiley, New York, 1982. [19] R.E. Bedford, G.W. Wyszecki, Wavelength discrimination for point
sources, J. Opt. Soc. Am. 48 (2) (1958).
[20] D. Karatzas, Text segmentation in web images using colour percep-tion and topological features, PhD Thesis, University of Liverpool, UK, 2002.
[21] A.R. Weeks, G.E. Hague, Color segmentation in the his color space using the K-means algorithm, in: Proceedings of SPIE Volume: 3026 – Nonlinear Image Processing VIII, 1997, pp. 143–154.
[22] A. Moghaddamzadeh, N. Bourbakis, A fuzzy region growing approach for segmentation of color images, Pattern Recognit. 30 (1997) 867–881.