Report on the implementation
of the Nitrates Directive
in Finland 2004
Sari Mitikka, Ritva Britschgi, Kirsti Granlund, Juha Grönroos,
Pirkko Kauppila, Risto Mäkinen, Jorma Niemi, Sonja Pyykkönen,
Arjen Raateland and Kimmo Silvo
This publication is the Finnish implementation report on the EU NitratesDirective (91/676/EEC) given to EU in June 2004. The implementation of the Nitrates Directive is one of the policy measures aimed at decreasing nutrient, nitrates and phosphates, discharges and losses from agricultural sources. In Finland, the Nitrates Directive is transposed to national legislation through the Environmental Protection Act (2000/86) and Government Decree No 931/2000. The provisions of the Government Decree apply to the whole national territory of Finland. The Decree contains provisions on good agricultural practices, storage of manure, spreading and allowable quantities of fertilizers and silage liquor, analysis and recording of nitrogen in fertilizers and enforcement of the Decree. The Regional Environment Centres and the municipal environmental authorities are responsible for the enforcement of the Decree.
The whole country has been evaluated as a nitrate vulnerable area. In this report, concentrations of nitrate and other variables indicating eutrophication (total P, total N and chlorophyll a) were studied in all Finnish surface waters during the last reporting period 2000–2002. In addition, seasonal and annual changes in these 4 variables were investigated in 20 lakes, 23 rivers and 19 estuaries, which all receive nutrients primarily from agricultural sources. Investigation period focused mainly on years 1992–2002. However, long-term changes in agricultural nitrogen leaching were studied in detail in three agricultural catchments for the period 1981–2003. The background information about the quality of groundwater came from 53 sites of the Environment Administration’s ground water monitoring. The impact of agriculture on groundwaters was asessed with monitoring data from 12 aquifers situated in or near agricultural areas.
Changes in cultivation measures were not noticed to have significant effect on discharges or water quality.
Report on the implementation of the Nitrates Directive
in Finland 2004
FINNISH ENVIRONMENT INSTITUTE P.O.BOX 140, FIN-00251 HELSINKI
ENVIRONMENTAL
PROTECTION
. . . .
ENVIRONMENTAL
PROTECTION
F I N N I S H E N V I R O N M E N T I N S T I T U T E
T h e F i n n i s h E n v i r o n m e n t
T h e F i n n i s h E n v i r o n m e n t
741
Report on the implementation of the Nitrates Directive in Finland 2004
741
Edita Publishing Ltd.
P.O.Box 800, FIN-00043 EDITA, Finland Phone +358 20 450 00
Mail orders:
Phone +358 20 450 05, fax +358 20 450 2380 Edita-bookshop in Helsinki:
Annankatu 44, phone +358 20 450 2566
This publication is also available in the Internet: www.environment.fi/publications
Report on the implementation
of the Nitrates Directive
in Finland 2004
T h e F i n n i s h E n v i r o n m e n t
Sari Mitikka, Ritva Britschgi, Kirsti Granlund, Juha Grönroos,
Pirkko Kauppila, Risto Mäkinen, Jorma Niemi, Sonja Pyykkönen,
Arjen Raateland and Kimmo Silvo
. . . .
HELSINKI 2005ISBN 952-11-1917-9 ISBN 952-11-1918-7 (PDF)
ISSN 1238-7312
Cover photo: Sari Mitikka and Kirsti Granlund Page layout: Ritva Koskinen
Printing: Edita Prima Ltd, Helsinki 2005 This publication is also available in the Internet
Contents
Contents
Contents
Contents
Contents
Introduction ... 5
1 Implementation of the Nitrates Directive – measures to be
taken by individual farms ... 7
1.1 Data concerning the territory of the Member State (Finland) ... 9
1.2 Information to be included in the reports referred to in Article 10 ... 12
1.2.1 Council Directive, Annex II ... 12
1.2.2 Council Directive, Annex III: Measures to be included in action programmes as referred to in Article 5 (4) (a) ... 21
1.3 Environmental permits for agriculture ... 24
1.4 Contraventions of the Decree and summaries on the manure heap notifications required under the Government Decree ... 25
2 Surface water quality ... 28
2.1 Data collection ... 28
2.2 Nitrate concentrations in 2000–2002 ... 29
2.3 Total phosphorus, total nitrogen and chlorophyll a concentrations in 2000–2002 ... 35
2.4 Water quality changes in surface waters affected by agriculture in 1992–2002 ... 41
2.4.1 Lakes affected by agriculture ... 41
2.4.2 Rivers affected by agriculture ... 50
2.4.3 Estuaries affected by agriculture ... 60
2.5 Nitrogen leaching in small agricultural catchments ... 67
3 Groundwater quality ... 70
3.1 Data collection ... 70
3.2 Nitrate concentrations in 1992–2002; background values and those affected by agriculture ... 71
4 Future development of water quality ... 79
5 Conclusions ... 81
References ... 85
Introduction
Eutrophication of surface water is recognised as a significant environmental problem and a major environmental policy issue in Finland. On the national scale, approximately 50% of the total nitrogen (total N) and 60% of total phosphorus (total P) loading originate from agricultural sources (Silvo et al. 2002). Sewage from dwellings accounts for approximately 20% and industrial sources approximately 5% of the total N and total P discharges into the water bodies.
The implementation of the Nitrates Directive (91/676/EEC 1991) is one of the policy measures aimed at decreasing nutrient, nitrogen and phosphorus, discharges and losses from agricultural sources. Two national water protection target programmes and the EU agri-environmental support scheme also directly address the issue of decreasing nutrient discharges from agricultural sources.
The Finnish Government has adopted a Decision-in-Principle on the Water Protection Targets to 2005 (19 March 1998) (Ministry of the Environment 1998) accompanied by a specific programme of measures that address the problem of nutrient discharges from agriculture. The Decision-in-Principle sets out the general target of reducing phosphorus and nitrogen discharges from agricultural sources to 50% compared with the level of 1990–1993. Furthermore, the Government has approved another Decision-in-Principle on steps to be taken to protect the Baltic Sea (26.4.2002). The Decision states that in combating eutrophication, the most important action is to be taken in the agricultural sector. The Baltic Marine Environment Protection Commission (Helsinki Commission) has issued a revised recommendation on measures aimed at the reduction of emissions and discharges from agriculture (24/3, 25 June 2003).
In Finland, the Nitrates Directive is transposed to national legislation through the Environmental Protection Act (4th February 2000/86, paragraph 11.6) and Government Decree No 931/2000 (9 November 2000) on reducing the release of nitrates from agricultural sources into water bodies. The provisions of the Government Decree apply to the whole national territory of Finland without regional or local differentiation. The Decree contains provisions on good agricultural practices, storage of manure, spreading and allowable quantities of fertilizers and silage liquor, analysis and recording of nitrogen in fertilizers and enforcement of the Decree. The Regional Environment Centres and the municipal environmental authorities are responsible for the enforcement of the Decree.
In parallel with the implementation of the Nitrates Directive, farmers have widely adopted the EU agri-environmental support scheme in Finland. The coverage of the scheme was approximately 90% of the cultivated area during the first support scheme period 1995–1999 and 96% during the second period 2000–2006. Environmental support for basic and additional measures is paid to farmers who meet the eligibility criteria laid down in Government Decree No 644/2000 (26 June 2001) and undertake the basic measures related to the following activity areas for five years:
– environmental planning and monitoring in farming – basic fertilization levels of arable crops
– plant protection – filter strips
There are certain other basic measures available for livestock farms. The basic measures are supplemented with specific additional measures on the farm level.
In addition to the environmental protection measures and changes in farming practices, there are other factors such as the use of the agricultural land as well as the production and areal structure of agriculture that have an effect on nutrient discharges and losses. Among these factors, nutrient releases have been affected most significantly by the decrease in the field area kept fallow during the last decade.
This report on the implementation of the Nitrates Directive in Finland 2004 involves 1. measures to be taken by individual farms,
2. water quality of surface waters with special emphasis on waters affected by agriculture,
3. nitrate concentrations in groundwaters affected by agriculture and background information of nitrate levels in groundwaters with minor human impact, and
Implementation of the Nitrates
Directive – measures to be taken
by individual farms
The European Commission regulation on good farming practices has been incorporated in the system of compensatory allowance and the agri-environmental support scheme which are contained in the Horizontal Rural Development Programme for Finland and on which a Government Decree was issued on June 26, 2000 (644/2000, as amended 449/2001, 1220/2001, 361/2002 and 825/2002). The payment of agri-environmental support and compensatory allowance is conditional on adherence to the code of good agricultural practices. The code of good agricultural practices (Ministry of Agriculture and Forestry 2001) contains the obligations on good cultivation practices issued by the Commission and the obligations set out in the Finnish environmental legislation and regulations. The code also contains recommendations on environmentally friendly cultivation methods but the support is not conditional on adherence to the recommendations. The criteria for eligibility for the basic and additional agri-environmental support measures are contained in the Ministry of Agriculture and Forestry Decree 646/2000 (amended 1207/2000, 463/ 2001, 1278/2001, 398/2000 and 786/2002). The eligibility criteria for compensatory allowance are contained in Ministry of Agriculture and Forestry Decree 645/2000.
In accordance with the Nitrates Directive, the report must contain details of the preventive measures carried out in accordance with Article 4. Based on Article 4, the Nitrate Decree incorporates the code of good agricultural practices, which contains the provisions laid down in Annex II of the Directive. The report must contain a summary of the action programmes drawn up in accordance with Article 5 and, in particular, of the measures required under sub-items a and b of Article 5(4). Sub-item a refers to Annex III of the Directive (measures that must be incorporated in action programmes referred to in sub-item a of Article 5(4)). Sub-item b refers to the measures that are part of the code of good agricultural practices, except for those that have been replaced with measures referred to in Annex III. Thus paragraph 4 has been examined on the basis of Annex III by excluding the measures coming under good agricultural practices as mentioned above. In the report, consideration was given not only to requirements set out in the Directive but also to the document ‘Reporting Guidelines For Member-States (art. 10) reports, Nitrates Directive, Status and trends of Aquatic Environment and Agricultural Practice’, which was prepared for the 2000 report.
The information for the report was collected on the basis of the mid-term evaluationof the Horizontal Rural Development Programme commissioned by the Ministry of Agriculture and Forestry and prepared by the Economic Research Unit of the MTT Agrifood Research Finland, the Finnish Environment Institute and the Department of Applied Biology at the University of Helsinki. The report examines how well the development programme targets have been implemented in Finland as far as the impacts of the compensatory allowance and agri-environmental support are concerned. The mid-term evaluation covers the years 2000–2003 (the programming period covers the years 2000–2006). Most of the information in the report is from the period 2000–2002 and the information has been compared with the figures for the previous programming period (1995–1999).
The results of the MYTVAS study were used as a data source too. In that study the changes in cultivation measures and their impacts on nutrient loading of water bodies originating from farms was assessed on the basis of cultivation data covering basic parcels and sub-parcelscollected for the study by interviewing farmers. The interviews were part of the process of monitoring the agri-environmental support scheme. The study covered the years 1994–2002 and consisted of four rounds of interviews. The results are presented in the following reports: Grönroos et al. 1997, Grönroos et al. 1998 and Palva et al. 2001. The information collected in the 2000– 2002 interviews has been discussed by Pyykkönen et al. 2004. Areas located in different parts of Finland were selected for the study. The southern areas, the catchment areas of the Yläneenjoki and Lepsämänjoki rivers are areas where grain and special plants are grown, while the northern areas, the catchment areas of the Lestijoki and Taipaleenjoki rivers are characterized by grass cultivation. These areas were covered by all four rounds of interviews. The last round of interviews also covered farms in the Savijoki, Löytäneenoja and Kinarehenoja areas, which form part of the larger Lestijoki river catchment area. The cultivation information collected from these farms covers the period 1999–2002. During the last round, interviews were carried out on a total of 409 farms, which have a cultivated area of about 18,000 hectares. The farms participating in the study account for 0.8% of the area under cultivation in Finland and 0.5% of all farms. The results of the MYTVAS study do not represent the whole country. Because of some nationwide information were unavailable, results of the MYTVAS study have been used.
In addition, Yearbook of Farm Statistics 2003, which includes statistics of the Information Center of the Ministry of Agriculture and Forestry, was used as an information source. Ministry of Agriculture and Forestry delivered information on number of manure storage facilities and outdoor yards that have received funding as part of the environmental protection support scheme and in connection with new investment for livestock farms, in 2000–2002. In addition, Department of Agriculture in Ministry of Agriculture and Forestry delivered information on cautions made when the rules of the Government Decree were not conformed.
1.1 Data concerning the territory of the Member State
(Finland)
Cultivated area
The area of cultivated field is presented in table 1. Cultivated field covers only farms with more than one hectare of field in 1996 and 1998. There were 893 farms in 2000, 1,001 farms in 2001 and 1,146 farms in 2002 which had less than one hectare of field.
Table 1. Cultivated area in Finland in 1996–2002. (Yearbook of Farm Statistics 2003).
Year 1996 1998 2000 2001 2002 Cultivated area (ha) 2,133,980 2,190,714 2,196,435 2,202,355 2,215,480
Number of farms in Finland
The number of farms in Finland has decreased in recent years (Table 2). In 2002 the total was 45,875 (38%) lower than in 1992 and 12,596 (14%) lower than in 1998.
Table 2. Number of farms in Finland in 1992–2002. (Yearbook of Farm Statistics 2003).
1992 1994 1996 1998 2000 2001 2002 Number of farms in Finland 121,349 114,510 94,114 88,070 79,783 77,320 75,474
Number of active farms
An active farm is a farm that has at least one hectare of land under cultivation and is engaged in agricultural production or other business. Farms that have entered into a contract to reduce production or made a closure commitment are not considered active farms. Since 1995, only farms engaged in forestry or some other form of production that have cultivated land have been defined as ‘active farms’. In 1995, there were 99,960 active farms in Finland and by 2000 the number had dropped to 79,780. In 2002, active farms numbered 74,200. In 1995, some 96% of all active farms received some kind of agricultural support, and in 2002 this proportion had risen to 99% (Ministry of Agriculture and Forestry 2004).
Number of livestock farms
The number of livestock farms decreased by 9,750 between 1995 and 1998 and by a further 3,800 between 2000 and 2002. In 2002, there were 32,990 livestock farms in Finland, which was 43.7% of all active farms. In 1995, livestock farms accounted for 54.0% of all active farms. Closures and change-over to crop production have been particularly common among small livestock farms. Southern Finland has been the area with the steepest decline in the number of livestock farms (Ministry of Agriculture and Forestry 2004).
Cultivated area of livestock farms
land and by 2002, the total had more than halved, to 24,800 hectares. The study showed that farms with a large number of livestock in proportion to their cultivated area tend to remain outside the agri-environmental support scheme. In fact, on such farms the proportion is much higher than on farms that have joined the system (Ministry of Agriculture and Forestry 2004).
Number of animals
Every year, when submitting their applications for farm subsidies, farms report the number of their animals on May 1. The number of animals by animal group in 1998–2002 is given in Table 3. Animal numbers have decreased in all animal groups. The number of fur farms and the number of pelts produced during each sales period (1.6.–31.5.) are given in Table 4. The number of fur farms decreased by 1,588 (47%) between 1992 and 2002, but the number of pelts produced has not declined in the same proportion. The number of mink and fitch pelts produced decreased by 0.6% between 1992 and 2002, while the number of fox and raccoon dog pelts increased by 47% during the same period.
Table 3. Number of animals in the entire country, May 1, 1998–2002 (thousands of animals). (Yearbook of Farm Statistics 2003.)
1998 1999 2000 2001 2002 Cattle 1117.1 1086.8 1056.7 1037.4 1025.4 Pigs 1401.0 1351.3 1295.8 1260.8 1315.0 Poultry 11049.6 11033.6 12569.5 10553.6 10733.9 Sheep and goats 136.4 114.5 108.2 103.4 102.5 Horses 26.3 26.3 25.5 26.2 25.2
Table 4. Number of fur farms and pelt production units in the sales period (1.6.–31.5) 1991/92, 1993/94, 1995/96, 1997/98, 1999/00, 2000/01 and 2001/02. (Yearbook of Farm Statistics 2003.)
Year Number of farms Pelts produced
Mink and fitch Fox and raccoon dog 1991/92 3,354 1,505,198 1,091,601 1993/94 2,406 1,659,534 1,220,807 1995/96 2,166 1,944,663 1,803,904 1997/98 2,152 1,828,210 2,493,410 1999/00 1,993 1,732,710 1,972,340 2000/01 1,855 1,497,859 1,862,643 2001/02 1,766 1,496,609 2,043,902
Compensatory Allowance and agri-environmental support
(1995–1999), the cultivated area of the farms receiving compensatory allowance averaged 1,622,400 hectares or 76% of all areas under cultivation in Finland. In 2002, the area covered by compensatory allowance totalled 2,171,000 hectares or 96.3% of all areas under cultivation (Ministry of Agriculture and Forestry 2004).
In 1995 a total of 78,750 farms in mainland Finland received agri-environmental support, but by 1999, the number had dropped to 73,480. In the period 1995–1999, an average of 84.4% of all active farms received agri-environmental support. Between 2000 and 2002, the number of farms covered by the agri-environmental support scheme dropped from 70,812 to 68,215. However, in 2002 a high proportion of all active farms (91.9%) received support. In the period 1995–1999, the area under cultivation on the farms receiving agri-environmental support averaged 1,891,000 hectares or 76.9% of all areas under cultivation on active farms. In 2002, the area covered by agri-environmental support totalled 2,171,000 hectares or 96.3% of all area under cultivation on active farms (Ministry of Agriculture and Forestry 2004).
Changes in cultivation practices
There were few changes in cultivation practices between 1998 and 2002. Support systems guiding cultivation practices have remained largely unchanged during the period in question. The biggest change was that in support areas A and B the demand for 30% winter covering of fields with plants or plant residues was removed. In Finland, the area under grass cultivation has decreased with the decreased number of cattle and because cereals have replaced grass in cattle feeds.
Even though there have been few changes in crops and crop varieties, there are signs that cultivation practices are becoming increasingly restricted. Ploughing has decreased while the use of field cultivator has increased. There has also been an increase in the area covered by direct-sown fields. The area treated with pesticides has grown and the amounts applied per hectare have increased. The increase in reduced tillageand direct sowing, lack of crop rotation and the fact that more and more headlands and buffer strips are left un-maintained have been given as the main reasons for this development.
The conclusion in the MYTVAS study (Pyykkönen et al. 2004) was that even though average fertilization levels are still lower now than in the years before Finnish EU membership, the use of cattle manure in particular remains a problem. Livestock production is increasingly concentrated into smaller and smaller areas, which means that manure is spread on the same parcels every year. As a result, nutrient levels, and most of all phosphorus levels, in these field parcels rice, and the risk of nutrient leaching from fields to water bodies increases. At the same time, the supply of and demand for manure do not meet as the suppliers and users are too far apart.
Nitrogen discharges to surface waters
Information on nitrogen discharges from agriculture, industry and built-up areas are given in Table 5. The average nitrogen load of livestock farming in 1990-1993 was estimated at 2,900 t a-1, while the figure for crop production was put at 30,000
Table 5. Nutrient load into waters and natural leaching in 2002. Measured emissions from industries, fishery and communities in 2002. Other emission sources and natural leaching has been estimated by the Finnish Environment Institute (SYKE 2004). Source of emission Nitrogen t a-1 Nitrogen %
Pulp and paper industries 2,568 3.3 Other industries 946 1.2 Communities 11,843 15.1
Fishery 722 0.9
Fur production 430 0.5
Peat industry 1,000 1.3
Total peak load 17,509 22.4
Agriculture 39,500 50.5 Scattered settlement 2,500 3.2
Forestry 4,100 5.2
Total scattered loading 46,100 58.9
Fall out 14,600 18.7
Total loading 78,209 100 Natural leaching 70,000
1.2 Information to be included in the reports referred
to in Article 10
1.2.1 Council Directive, Annex II
A) Mandatory issues
1. Periods when the land application of fertilizer is inappropriate
Government Decree, Section 5
Nitrogen fertilizers must not be applied on snow-covered, frozen or water-saturated ground. Animal manure may be applied in the autumn up to November 15, and application may be started in the spring no earlier than April 1, provided the ground is not frozen and is sufficiently dry to avoid runoff into watercourses and any danger of subsoil compaction. Manure may not be applied on grassland after September 15.
Regional Environment Centres have issued some statements on contraventions concerning manure application in winter.
The times in which manure was applied during the years 2000–2002 was examined as part of the MYTVAS study. In the farms participating in the study, most of the manure was applied in accordance with the Decree. During that period manure was applied annually for about 20 parcels when spreading was not allowed. This is less than 2 percent about all field parcels, where manure was used. Most of these fields were grasslands.
2. Land application of fertilizer on steeply sloping ground
Government Decree, Section 5
The information received from the Regional Environment Centres does not indicate that contraventions of the Government Decree coming to their attention would have concerned the manure application distance.
Information on the average slope of the parcels was also incorporated in the MYTVAS study if the slope had resulted in cultivation problems. This means that not all sloping parcels were reported. The parcels were classified in accordance with the decree of slope causing cultivation problems (2–10% or more than 10%). In the Lestijoki catchment area, there were a total of nine parcels for which a slope of more than 10% was given and on three of them cattle manure was used. On these parcels manure was applied each year during the period 2000–2002. In other areas, too, there were parcels with a slope of more than 10%, but no cattle manure was applied on them.
3. Land application of fertilizer to water-saturated, flooded, frozen or snow-covered ground
Government Decree, Section 5
Nitrogen fertilizers must not be applied on snow-covered, frozen or water-saturated ground. Application of nitrogen fertilizers is prohibited between October 1 and April 15 on field areas that are repeatedly flooded in spring, but this does not apply when new growth is being established
The Regional Environment Centres have issued statements on contraventions concerning manure application in winter.
On the farms participating in the MYTVAS study, there were a total of 86 field parcels that were repeatedly flooded during the spring and most of them were located in the Lepsämänjoki, Lestijoki and Kinarehenoja areas. These parcels were flooded each spring in the period 2000–2002. The parcels in Lepsämänjoki were mainly used for growing spring grain, while most of the parcels in Lestijoki and Kinarehenoja were used for grass cultivation. None of the parcels flooded during spring floods were fertilized in the period between October and the end of April in the years 2000–2002. Spring fertilization began in May, while autumn fertilization was concluded by the end of September.
4. The conditions for land application of fertilizer near watercourses
Government Decree, Section 5
Use of nitrogen fertilizers is prohibited on areas closer than five metres to a watercourse. Along the width of the next five metres, surface application of nitrogen fertilizers is prohibited if the field slope exceeds 2%.
The information received from the Regional Environment Centres does not indicate that contraventions of the Government Decree would have concerned the application of fertilizers near water bodies.
5. The capacity and construction of storage vessels for livestock manure, includingmeasures to prevent water pollution by run-off and seepage into the groundwater and surface water of liquids containing livestock manures and effluents from stored plant materials such as silage
Government Decree, Section 4
with litter bedding are also considered. Manure storages and manure gutters must be watertight. The structures and equipment used must be such that no leakage occurs when the manure storage is emptied and the manure is transferred. The size of storage must follow the principles set out in Annex 2.
Government Decree, Section 7
The silage effluent created in silage production must be retained and stored in watertight containers.
Government Decree, Annex 3
In Annex 3 there are recommendations on manure storaging.
Manure storage facilities
In 2000, an agricultural accounting was carried out in Finland. Farms were asked among other things whether they had solid manure storage, urine tank or slurry tank, how many months each of these storage systems could be used without emptying and whether the manure storage was covered. The results are presented in table 6. A total of 3,055 farms had both solid manure storage and slurry tank.
Table 6. Number of animal manure storages in Finland by type and the capacity of the storages, (how many months storage is sufficient without emptying) with information about covering of the storages. (Information Centre of the Ministry of Agriculture and Forestry 2004).
Solid manure storage Urine tank Slurry tank
Number of farms with following manure application systems 26,508 17,080 12,190 Average capacity without emptying (months/year) 9.4 9.6 10.3 With cover (number) 7,845 11,042 2,675 Without cover (number) 18,194 5,708 9,234
Puumala and Paasonen (2001) examined the number of concrete slurry tanks and their age distribution. The figures were collected from Employment and Economic Development Centres, concrete product manufacturers, the Confederation of Finnish Construction Industries RT and central agricultural wholesalers. The information was collected for the years 1980–1999 and the tanks were divided into four categories according to the year of construction. The number of slurry tanks built between 1980 and 1999 was estimated at almost 13,000 and 60% of them were estimated to have been built in the 1990s (Table 7). The average capacity of slurry tanks built in the early 1980s was estimated at 300 m3, while the figure for tanks constructed in the late 1980s
was estimated at 500 m3. The capacity of slurry tanks built in the 1990s was estimated
to be larger that that of tanks from the 1980s. The average capacity of slurry tanks built in the early 1990s was estimated at 640 m3 while the figure for tanks built in the
latter half of the decade was 860 m3 (range was 500–1500 m3).
Table 7. Estimated number of slurry tanks by age distribution and the estimated age distribution (%) of slurry tanks which is based on estimates by Employment and Economic Development centres (TE Centres) and sales statistics from manufacturers and machinery dealers. (Puumala and Paasonen 2001).
Construction year Estimated number of slurry tanks Estimated age distribution % TE Centre Sales statistics
1980–1984 2,480 19 17
1985–1989 2,330 21 17
1990–1994 3,550 28 30
1995–1999 4,620 32 36
Puumala and Paasonen (2001) based their assessments of the useful lifetime of the slurry tanks and age-related risks on expert opinions, studies made on concrete structures and the accident statistics compiled by the Farmers’ Social Insurance Institution. The average useful lifetime of slurry tanks was estimated at 15 years. All accidents resulting from structural failures in the tanks had occurred during the construction of the manure storage facility. The study concluded that existing slurry tanks only cause environmental problems in exceptional cases. Only a very small number of tanks was found to have problems with sealings and prefabricated panels that required repairs.
In a study commissioned by the Ministry of Agriculture and Forestry (Ministry of Agriculture and Forestry 1998) the type and number of structural problems occurring in manure storage facilities built as prefabricated structures were studied. A total of 161 farmers participated in the study. In 76% of the farms the manure storage facility was dimensioned for all-year-round use while in 18% it was dimensioned for eight months’ use. Of the facilities intended for all-year-round use, 59% were emptied twice a year and 12% more frequently. A total of 65% of the farms estimated that the facility was too small for the amount of manure generated, even though no consideration was given to the fact that both rainwater and the water coming from the service facilities and the areas in which the animals were kept increased the volume of the water. A total of 77% of the manure storage facilities also received the washing water from the service facilities and/or the areas in which the animals were kept. Some 76% of the manure storage facilities were trouble-free, but 19% had had some kinds of problems. At total of 15% of the manure storage facilities had suffered from structural and construction-related problems, operational difficulties and low temperatures, while 9% had serious damage (leaks, cracks or visible reinforcement). Most of the manure storage facilities with serious damage had been built between 1991 and 1993. In the instructions issued by the Ministry of Agriculture and Forestry (MMM-MRO-C 4) it is recommended that if prefabricated parts are used for the construction of a manure storage facility, only Ministry-approved parts be used. According to the study commissioned by the Ministry of Agriculture and Forestry, a total of 52% of all manure storage facilities had made use of approved prefabricated parts. The problems in manure storage facilities usually appeared during or after construction. In 63% of the facilities, the prefabricated parts had a maximum thickness of 10 cm. Nowadays, prefabricated parts with a thickness of less than 12 cm can only be approved on the basis of a special examination.
In 2002, some 33% of the farms participating in the MYTVAS study had insufficient manure storage capacity. The figure was 35% in 1999 and 59% in 1995. Department of Agriculture in the Ministry of Agriculture and Forestry delivered information about cautions that were made when the regulations of the Government Decree had not been conformed. During the monitoring of the agricultural support 54 cautions were made in 2000 and 158 cautions in 2001. All cautions concerned imperfect manure storaging.
Table 8. Number of manure storage facilities and outdoor yards that have received funding as part of the environmental protection support scheme and in connection with new investment for livestock farms, in 2000–2002. (Information Centre of the Ministry of Agriculture and Forestry 2004).
Type of facility Type of funding Number of funding decisions Total 2000 2001 2002 2000-2002 Slurry tanks EU co-financing 1 236 88 325
National financing 16 229 211 456
Total 17 465 299 781
Shallow manure pits EU co-financing 3 390 140 533 National financing 15 142 144 301
Total 18 532 284 834
Urine tanks EU co-financing 0 68 22 90 National financing 2 54 34 90
Total 2 122 56 180
Outdoor yards EU co-financing 0 21 13 34 National financing 0 19 11 30
Total 0 40 24 64
Total 37 1,159 663 1,859
Recovery of silage effluents
Baling has become a more common method than a silage making method. On the farms participating the MYTVAS study, 30% of silage was baled in 1999 and 60% in 2002. In the same time silage storing in heaps decreased: in 1999 40% and in 2002 10% of silage was stored in heaps. About 30% of silage was stored in silos in 1999 and 2002. On the farms participating in the MYTVAS study, silage effluents were collected in 80–90% of silos and in 50% of heaps in 1999 and 2002. There are no nationwide figures available on the Decree of the recovery of silage effluents. 6. Procedures for land application, including rate and uniformity of
spreading, of both chemical fertilizer and livestock manure, that will maintain nutrient losses to water at an acceptable level
Government Decree, Section 5
Organic fertilizer applied in the autumn must always immediately, and within 24 hours at the latest, be incorporated, or the field must be ploughed. The maximum amounts of manure that can be applied in the autumn are 30 tonnes/ha of solid manure, 20 tonnes/ha of cow slurry, 15 tonnes/ha of pig slurry or 10 tonnes/ha of poultry or fur animal manure. Animal manure may be applied on a field as fertilizer equivalent to up to 170 kg/ha/year of nitrogen, while taking into consideration what is laid down in section 6.
Government Decree, Section 6
The scale of use and application of nitrogen fertilizers is based on average crop yield, cultivation zone and crop rotation with the aim of retaining a balanced nutrient level in the soil. Farms may use the following maximum amounts of nitrogen on fields as fertilizer, contained in both mineral fertilizer and animal manure and organic fertilizers:
1) winter cereals up to 200 kg of nitrogen/ha/year, of which 30 kg of nitrogen/ha in the autumn and 170 kg of nitrogen/ha in the spring, or if slowly dissol-ving nitrogen is used, up to 40 kg of nitrogen/ha in the autumn and 160 kg of nitrogen/ha in the spring;
3) grassland and pasture, silage and horticultural plants 250 kg of nitrogen/ha/year;
4) spring cereals, sugar beet, oilseed crops and other crops up to 170 kg of nitrogen/ha/year.
For very fine sand and coarser mineral soils, 10 kg/ha/year is deducted from the nitrogen amounts laid down in paragraph 2 above. The total amounts of nitrogen presented in paragraph 2 above are reduced by 40 kg/ha in the case of cultivation of cereals or sugar beet on peat soil, and by 20 kg/ha in the operating areas covered by the Lapland, Northern Ostrobothnia and Kainuu Regional Environment Centres. For grasslands, the reduction is 10/ha on peat soil throughout the country. If the amount of permissible nitrogen fertilizer exceeds 170/kg/year, this amount must be split into at least two doses with at least two weeks between applications. Government Decree, Section 7
The fertilizers referred to in section 6 above must be applied on the field evenly and so as to prevent discharges into waters as effectively as possible.
The fertilizing limit of 170 kg/ha/year laid down in section 5 refers to the amount of total nitrogen spread on the field.
Section 6 refers to the maximum amount of soluble nutrients spread on the field. Methods of manure incorporation
Farmers do not need to keep records on the methods of manure incorporation and there are no nationwide figures available on such methods. On farms participating in the MYTVAS study, there were few changes in the methods of manure incorporation between 1999 and 2002. In most of them, both dry manure and slurry were spread and incorporated on the same day. In 20–60% of the fields, dry manure was incorporated within four hours of spreading, while in 30–50% of the fields, slurry was incorporated within four hours of spreading.
Use of nitrogen
Table 9 shows the total amount of nitrogen sold to farms in concentrated fertilizers and the amount per cultivated hectare in different fertilizing years. Since the fertilizing year 2000/01, the figures for the amounts of plant nutrients sold have also included imports. The amount of nitrogen contained in concentrated fertilizers sold has decreased continuously since the fertilizing year 1995/96. The reduction is also evident in the amounts of nitrogen fertilizers sold in different years for each cultivated hectare. The amount of nitrogen sold each year has dropped by 13% between the fertilizing years 1991/92 and 2001/02.
Table 9. Total sales of nitrogen to farms and quantity of nitrogen sold in fertilizers per hectare of cultivated land in fertilizing years (1.7.–30.6.) (Yearbook of Farm Statistics 2003).
1991/92 1993/94 1995/96 1997/98 1999/00 2000/01 2001/02 Total sales of nitrogen
(1000 kg) 163,229 169,138 179,529 169,928 167,276 165,621 160,403 Quantity of nitrogen kg/ha 92.8 94.1 92.3 85.0 84.2 83.2 80.5
from about 20kg/ha to an average of 15 kg/ha. In 2000-2002, average nitrogen fertilization levels were the same as in the late 1990s. Average phosphorus fertilization was at the same or slightly lower level than in the previous FAEP period.
The number of animal units and total nitrogen contained in the manure produced by animals per total area under cultivation in Finland are given in Table 10. The number of animal units and total nitrogen contained in the manure produced by animals per cultivated area and areas of uncultivated pasture belonging to livestock farms are given separately for farms committed to agri-environmental support and for farms outside the system (Table 10) for the years 1999 and 2002. Most of the changes in the amounts of manure spread per unit area have occurred on farms not committed to agri-environmental support. The number of livestock farms outside the system has increased substantially in proportion to the area belonging to them. The total number of livestock farms outside the agri-environmental support scheme has, however, dropped between 1999 and 2002. The farms that have joined the agri-environmental support scheme are those with the lowest number of livestock per unit area, while most of the farms staying outside the system are farms with a large number of livestock in proportion to their area (Ministry of Agriculture and Forestry 2004).
Table 10. Animal units and nitrogen contained in manure was counted for arable land under cultivation and natural pasture (does not include fallow). Same information was counted also for domestic animal production farms that have committed to agri-environmental support scheme and farms outside the system. (Ministry of Agriculture and Forestry 2004).
Land under cultivation Farms committed to the Farms not committed to the agri-environmental support agri- environmental support Year Animal N Animal N Animal N
units/ha kg/ha units/ha kg/ha units/ha kg/ha 1999 0.48 44.5 0.73 68.0 0.98 92.4 2002 0.45 41.8 0.73 68.1 1.42 133.6
In the farms participating the MYTVAS study (Pyykkönen et al. 2004) the total amount of cattle manure spread decreased during 1994–1999 but remained at 1999 levels in the period 2000–2002. Compared with the results of the 1999 interviews, an increasing proportion of the manure was spread in the spring. Both the proportion of manure spread in autumn and amounts used per hectare also decreased. The area on which cattle manure was spread in the autumn was only a fraction of the total area studied and the total area belonging to the farms participating in the study. All farms adhered limits to the Governments Decree on the permitted amounts of manure and kept to its restrictions applying to different animal species and different types of manure.
Table 11 shows the amount of municipal wastewater sludge spread on the fields and the amount of nitrogen it contained in 1994, 1998 and 2000. The amount of sludge used in agriculture has dropped by more than 60% since 1994 and 17% in the period 1998–2000. The nitrogen content of the sludge was calculated on the basis that normally about 20% of the wastewater nitrogen is bound to the sludge during treatment. Often the sludge is also treated anaerobically so that nitrogen is released from it, but this has not been taken into account in the calculations.
Table 11. Agricultural use of municipal wastewater sludge and the nitrogen contained in it, in 1994, 1998 and 2002 (Sokka 2004).
Year Sludge (tonnes) Nitrogen (tonnes)
The municipal wastewater sludge spread on fields must meet the quality requirements laid down in the Government Decision on the use of sewage sludge in agriculture (282/1994). The sludge spread on fields must be stabilized. On farms receiving agri-environmental support, the soluble nitrogen content of the nutrient values coming from the treatment plant and 75% of the total phosphorus must be taken into account when the amount of nutrients in the wastewater sludge is calculated. The Government Decree on treating domestic wastewater in areas outside sewer networks entered into force January 1, 2004. According to the Decree the wastewaters of the milk store at the dairy farms have to be treated in small wastewater treatment plants or in subsurface disposal systems of wastewaters. Farmers are allowed to use the wastewater sludge in their own fields. The amount of sludge used in the fields will probably increase as the amount of small wastewater treatment plants increase.
B) Voluntary issues
7. Land-use management, including the use of crop rotation systems and the proportion of the land area devoted to permanent crops relative to annual tillage crops
Cropping plan and crop rotation
There is no reference to cropping plans or crop rotation in the Government Decree. However, farms committed to agri-environmental support must have a cropping plan. Ensuring that cropping plans are drawn up is part of the process of monitoring the spending of the support money carried out by the Employment and Economic Development Centres. In good agricultural practices (Ministry of Agriculture and Forestry 2001), crop rotation is mentioned in the recommendations on plant protection but only as a voluntary measure. On organic farms, crop rotation is an essential part of cultivation practices. In 2002, a total of 5,438 farms covering 138,582.88 hectares had entered into a contract on organic farming or were in a transition to organic farming. This was 6.33% of the total area committed to agri-environmental support (Ministry of Agriculture and Forestry 2004).
Perennial plants
Table 12. Area used for the cultivation of perennial plants and area under green fallow and their percentages of all cultivated area in 1995, 1999 and 2002. Farms committed to agri-environmental support scheme. (Ministry of Agriculture and Forestry 2004).
1995 1999 2002
ha % ha % ha %
Perennial plants 645,486 34.4 615,517 30.0 594,701 27.8 Green fallow 134,073 7.1 111,678 5.4 121,528 5.7
The area used for the cultivation of perennial grass increased by 5,100 hectares and the area used for the cultivation of annual grass decreased by 43,800 hectares between 1998 and 2002 (Table 13). At the same time, the area used for cereals cultivation increased by 38,600 hectares.
Table 13. Grasslands and total cereal area in Finland years 1998–2002 (1000 ha). (Yearbook of Farm Statistics 2003). 1998 1999 2000 2001 2002 Grasslands at least 5 years (ha) 21.6 21.0 25.7 25.3 26.7 Grasslands under 5 years (ha) 681.6 671.4 686.9 664.4 637.8 Cereals (ha) 1157.0 1134.0 1172.9 1161.0 1195.6
8. The maintenance of a minimum quantity of vegetation cover during (rainy) periods that will take up the nitrogen from the soil that could otherwise cause nitrate pollution of water
The Government Decree does not contain regulations on minimum vegetation cover or catch crop. Agri-environmental support scheme includes some measures concerning vegetation cover.
9. Establishing fertilizer plans on a farm-by-farm basis and keeping records on fertilizer use
Government Decree, Section 8
Farmers must keep a record of crop yields and the amount of nitrogen fertilizers used on their fields.
Farms committed to agri-environmental support must have a cropping plan and keep parcel-specific records. Ensuring that cropping plans are drawn up is part of the process of monitoring the spending of support money carried out by the Employment and Economic Development Centres.
Some 50% of the farms participating in the MYTVAS study (Pyykkönen et al. 2004) kept parcel-specific records in 1995, and in 1999 the figure had risen to 90%. Some 91% of the information collected in the 2002 interviews was from parcel-specific records. In this context, hand-written parcel cards and records entered in computers were considered parcel-specific records. This means that the proportion of farms adhering to the recording requirements of the agri-environmental support scheme has remained more or less unchanged.
10. Prevention of water pollution from run-off and the downward water movement beyond the reach of crop roots in irrigation systems
The Government decree does not contain any provisions on irrigation systems. Provisions on the matter are contained in the Finnish Water Act.
1.2.2 Council Directive, Annex III: Measures to be included in
action programmes as referred to in Article 5 (4) (a)
1. Periods when application of certain types of fertilizer is prohibited
Government Decree, Section 5
Nitrogen fertilizers must not be applied on snow-covered, frozen or water-saturated ground. Animal manure must not be applied between October 15 and April 15. Manure may be applied in the autumn up to November 15, and application may be started in the spring no earlier than April 1, provided the ground is not frozen and is sufficiently dry to avoid runoff into watercourses and any danger of subsoil compaction. Manure may not be applied on grassland after September 15.
This item has already been examined above in chapter 1.2.1, scene 1.
2. The capacity of storage vessels for livestock manure; this capacity must exceed that required for storage throughout the longest period during which land application in the vulnerable zone is prohibited, except where it can be demonstrated to the competent authority that any quantity of manure in excess of the actual storage capacity will be disposed of in a manner that will not cause harm to the environment
Government Decree, Section 4
The manure storage for waste products excreted by animals must be sufficiently large for manure accumulated over 12 months, excluding manure remaining on pasture during the same grazing season. In determining the size of the storage, farmers’ joint storage, appropriate small outdoor yards and loose housing sheds with litter bedding are also considered.
This item has already been examined above in chapter 1.2.1, scene 5.
Government Decree, Section 4
Deviation from the required volume for manure storage referred to in paragraph 1 is possible if manure is transferred to another user who can accept it under a permit granted in accordance with section 28 of the Environmental Protection Act, or to another farmer to be stored as specified in this Decree or to be put into immediate reuse, or if the manure is stored in a properly made and covered manure heap provided the storage follows the procedure described in Annex 1 and releases into waters can be prevented. Any deviation must be reported well in advance to the municipal environmental protection authority, which can issue the necessary regulations pursuant to section 84 of the Environmental Act. The municipal environmental protection authority must make an annual report on any such deviation reported to the Regional Environment Centre.
Manure heaps must not be sited in areas that may become flooded or in groundwater areas.
3. Limitation of the land application of fertilizers, consistent with good agricultural practices and taking into account the characteristics of the vulnerable zone concerned in particular
a) soil conditions, soil type and slope
b) climatic conditions, rainfall and irrigation
c) land use and agricultural practices, including crop rotation
systems; and to be based on a balance between; (i) the foreseeable nitrogen requirements of the crops, and (ii) the nitrogen supply to the crops from the soil and from fertilization corresponding to:
- the amount of nitrogen present in the soil at the moment when the crop starts to use it to a significant decree (outstanding amounts at the end of winter)
- the supply of nitrogen through the net mineralization of the reserves of organic nitrogen in the soil
- additions of nitrogen compounds from livestock manure - additions of nitrogen compounds from chemical and other
fertilizers
a) Government Decree, Section 5
Use of nitrogen fertilizers is prohibited on areas closer than five metres to a watercourse. Along the width of the next five metres, surface application of nitrogen fertilizers is prohibited if the field slope exceeds 2%. Surface application of animal manure is always prohibited on fields with an average slope of more than 10%.
This item has already been examined above in chapter 1.2.1, scene 2.
b) Government Decree, Section 5
Nitrogen fertilizers must not be applied on snow-covered, frozen or water-saturated ground. Animal manure must not be applied between October 15 and April 15. Manure may be applied in the autumn up to November 15, and application may be started in the spring no earlier than April 1, provided the ground is not frozen and is sufficiently dry to avoid runoff into watercourses and any danger of subsoil compaction. Manure may not be applied on grassland after September 15. Organic fertilizer applied in the autumn must always immediately, and within 24 hours at the latest, be incorporated, or the field must be ploughed. The maximum amounts of manure that can be applied in the autumn are 30 tonnes/ha of solid manure, 20 tonnes/ha of cow slurry, 15 tonnes/ha of pig slurry or 10 tonnes/ha of poultry or fur animal manure.
This item has already been examined above in chapter 1.2.1, scenes 1, 3, 6.
c) Government Decree, Sections 6 and 8 Section 6
The scale of use and application of nitrogen fertilizers is based on average crop yield, cultivation and crop rotation with the aim of retaining a balanced nutrient level in the soil. Farms may use the following maximum amounts of nitrogen on fields as fertilizer, contained in both mineral fertilizer and animal manure and organic fertilizers:
1) winter cereals up to 200 kg of nitrogen/ha/year, of which 30 kg of nitrogen/ha in the autumn and 170 kg of nitrogen/ha in the spring, or if slowly dissolving nitrogen is used, up to 40 kg of nitrogen/ha in the autumn and 160 kg of nitrogen/ ha in the spring;
3) grassland and pasture, silage and horticultural plants 250 kg of nitrogen/ha/ year;
4) spring cereals, sugar beet, oilseed crops and other crops up to 170 kg of nitrogen/ ha/year.
For very fine sand and coarser mineral soils, 10 kg/ha/year is deducted from the nitrogen amounts laid down in paragraph 2 above. The total amounts of nitrogen presented in paragraph 2 above are reduced by 40 kg/ha in the case of cultivation of cereals or sugar beet on peat soil, and by 20 kg/ha in the operating areas covered by the Lapland, Northern Ostrobothnia and Kainuu Regional Environment Centres. For grasslands, the reduction is 10/ha on peat soil throughout the country. If the amount of permissible nitrogen fertilizer exceeds 170/kg/year, this amount must be split into at least two doses with at least two weeks between applications. Section 8
Manure nitrogen analysis must be conducted at five-year intervals after the analysis that had to be made in 1998 at the latest. Farmers must keep a record of the amount of nitrogen fertilizers used on their fields and of crop yields.
The keeping of parcel-specific records has already been examined above in chapter 1.2.1, scene 9.
Soil samples
The Government Decree does not contain any regulations on measuring soil nitrate concentrations or regulations on estimating the potentially mineralizing organic nitrogen amounts in soil. There are also no regulations on estimating the nitrogen uptake by the plants.
The cultivated fields of a farm receiving agri-environmental support must be subjected to a soil analysis at least every five years so that the content of the easily soluble phosphorus in the soil (mg/l) can be determined. Nitrogen content must not be analysed. In gardens, one of the additional agri-environmental support measures is a more careful nutrient follow-up in which the farmer must carry out a soil analysis every three years on specific parcels on which horticultural plants are grown. Another additional measure related to soil samples for gardens is more accurate nitrogen fertilization by means of measuring soluble nitrogen. The purpose of the measurements is to determine the amount of soluble ammonia and nitrate nitrogen in the soil. There are plans to make the measuring of soluble nitrogen an additional agri-environmental measure for crop production but it is not yet part of the support requirements in 2004.
Nutrient balance
years with poor harvests (1998 and 1999) the balance was high and the amount of nitrogen remaining in the fields amounted to as much as 60–80 kg/ha, depending on the crop plant and area studied. In 2000–2002 the harvests were fairly good. When the nutrient balance of different plant species was examined it was found out that oats make the most efficient use of nutrients during all years and that the nitrogen surplus was usually about 20 kg/ha.
Manure analysis
Of the 154 livestock farms participating in the MYTVAS study (Pyykkönen et al. 2004) 88% had carried out the manure analysis, and on 11% of them the analysis was more than five years old. This means that 77% of the farms had carried out the analysis in accordance with the Decree. After carrying out the manure analysis, 72% of the farms planned cattle manure fertilization on the basis of the nutrient content values produced by the analysis, while 14% of the farms carrying out the analysis carried out the fertilization on the basis of average national values. The remaining 14% of the farms used both the manure analysis and average national values, as applicable.
1.3 Environmental permits for agriculture
The Environmental Protection Act and Decree that came into force in 2000 determine the activities that may pose a risk of pollution and for which an environmental permit must be sought. Agricultural activities that are subject to environmental permits are animal sheds and manure storage facilities. The environmental permits contain provisions on such matters as the scope of the activities, and emissions and cuts in them. The permit can only be granted if the activities do not cause any health risks, substantial environmental pollution or a risk of pollution. A permit is always required when new activities are planned or when there are material alterations to existing activities. The activities subject to the permit may not be started before the permit is granted. All farms with more than 30 dairy cows, 80 fattening cattle, 60 sows, 210 finishing pigs, 60 horses or ponies, 160 ewes or goats, 2,700 egg-laying hens, 10,000 chickens or other poultry, 250 breeding female mink or 50 breeding female foxes/raccoon dogs, had to register into the environmental protection database in 2001 or 2002. The question of whether they must have environmental permits has been considered on a farm-by-farm basis. Registration is also a condition for the payment of investment aid. The environmental permit is granted by the municipal environmental protection committee or the Regional Environment Centre. The Regional Environment Centre acts as the permit authority when the farm has more than 75 dairy cows, 200 fattening cattle, 250 sows, 1,000 finishing pigs, 30,000 egg-laying hens, 50,000 chickens or other poultry, 2,000 breeding female mink or 600 breeding female foxes/raccoon dogs. The municipal environmental protection committee is the permit authority when the farm is smaller than preceding. The municipalities make notably more environmental permit decisions than the Regional Environmental Centres.
The largest number of environmental permit decisions were made in the West Finland Regional Environment Centre, but the Southwest Finland Regional Environment Centre and the North Ostrobothnia Regional Environment Centre were not far behind. These regions accounted for 73% of all environmental permit decisions made by the Regional Environment Centres and they also had the largest number of environmental permit applications pending, which gives a good picture of how livestock farming in Finland is concentrated. When individual production sectors are examined, dairy and beef production accounted for 34%, pig farming for 26%, fur farming for 13% and poultry for 11% of all permit applications.
Table 14. The number of agricultural environmental permits granted by Regional Environment Centres in 2000–2002 and the number of environmental permits pending on May 10, 2004 (VAHTI, 2004).
Regional Environment Centres 2000 2001 2002 Pending Total
Uusimaa - 5 4 7 16
Southwest Finland 5 21 31 54 111
Häme - - - 5 5
Pirkanmaa - 6 4 0 10
Southeast Finland - 6 4 4 14
South Savo - 2 7 - 9
North Savo 1 16 20 1 38
North Karelia 3 4 9 3 19
Central Finland - 3 1 1 5
West Finland 9 35 50 67 161 North Ostrobothnia 6 13 17 29 65
Kainuu - 3 2 1 6
Lapland 2 4 4 - 10
Total 26 118 153 172 469
1.4 Contraventions of the Decree and summaries on
the manure heap notifications required under the
Government Decree
Of the 13 Regional Environment Centres, eight provided information about contraventions of the Government Decree and most of the information was about the nature of the contraventions. Investigations of possible contraventions are usually initiated as a result of complaints, denunciations and checks made by Employment and Economic Development Centres and other authorities. There are still differences between Regional Environment Centres concerning the statement procedure even though attempts have been made to harmonize it. The Employment and Economic Development Centres request the Regional Environment Centres or municipal environmental protection committees to submit statements on the nature and severity of the contravention.
manure storage facility, manure spreading, establishment of manure heaps, outdoor yards, arrangements concerning the recovery of silage effluents and the lack of manure analysis and parcel-specific records.
The number of contraventions of the Government Decree reported to the police by the Regional Environment Centres numbered one (by one Regional Environment Centre). Contraventions were also reported to the police by municipal environmental protection committees and individual citizens that have suffered inconvenience as a result of the contraventions. The Regional Environment Centres were unable to provide any information about their number or severity.
A total of nine Regional Environment Centres gave the number of additional provisions and requests for additional information concerning deviation notifications required under section 84 of the Environmental Protection Act. Additional provisions and requests for additional information in the regions coming under the environmental centres submitting answers totalled 321 in 2001, 173 in 2002 and 95 in 2003.
Table 15 shows the number of notifications on deviations to the provisions on manure and urine storage contained in the Government Decree and notifications concerning other types of remote manure storage as submitted by Regional Environment Centres, by type of deviation. The number of deviation notifications, both as a whole and by type of deviation, decreased between 2001 and 2002. The number of manure heap notifications decreased in the areas of the all Regional Environment Centres during 2001–2002. Most of all manure heap notifications were done in the area of Southwest Finland and West Finland Environment Centres.
Table 15. Number of announcements about deviation from the required volume for manure storage 2001–2003. Announcements were received from 9 Regional Environment Centres.
Year Number of deviation means
User accepted in section 28 of Another farmer Immediate reuse Manure heaps Total Environmental Protection Act
2001 62 186 82 4,294 4,624
2002 45 150 41 3,326 3,562
2003 41 121 32 2,856 3,050
Table 16. Number of manure heaps and volume of manure in 2001–2003 in the area of the Regional Environment Centres. Regional Environment Centres Manure heaps
2001 2002 2003
heaps no. manure m3 heaps no. manure m3 heaps no. manure m3
Uusimaa 333 36,095 244 32,867 275 31,049 Southwest Finland 1,388 109,982 1,147 108,275 853 82,521 Häme 628 34,278 553 50,404 458 46,292 Pirkanmaa 1,097 67,720 1,010 57,723 619 52,162 Southeast Finland * * * 64,471 318 *
South Savo 521 * 344 * 356 *
North Savo * * * * * *
North Karelia 564 35,056 600 41,448 439 30,714 Central Finland 700 44,670 502 36,700 451 36,330 West Finland * * * * 761 90,147 North Ostrobothnia 620 46,834 686 50,396 553 41,069 Kainuu 160 11,232 147 11,232 98 8,357 Lapland 116 6,455 100 7,965 117 7,280 Total 6,127 392,322 5,333 461,481 5,298 425.921 * information not available
The reasons for using manure heaps include the insufficient size or absence of the manure storage facilities, technical considerations or reasons related to manure hygiene. A total of 10 Regional Environment Centres specified the reasons for the use of manure heaps in 2001–2003. Substantially fewer farmers used heaps because of the insufficient size or absence of manure storage facilities in 2003 than in 2000 (Table 17). Many of the farms in question are planning to give up livestock farming within the next few years. During the last few years, technical considerations have been given as the most important reason for having manure heaps.
Table 17. Reasons for using heaps for storing manure in 2001–2003 (% of farms using manure heaps). Manure storage Technical Hygienic Other reason
2001 44 44 1 11
2002 40 47 2 11
Surface water quality
Agriculture involves manipulation of soil, water and other natural resources and therefore has significant effects on the environment. In Finland the average percentage of agricultural land is 9%, but in the large drainage basins of southwestern Finland it can exceed 30% (Ekholm et al. 1999). In these areas of intensive agriculture, non–point loading is the most significant source of eutrophication. Phosphorus and nitrogen losses from agricultural land are high, exceeding those of industrial and municipal loads added together. Particularly during recent decades, the proportion of agriculture as a source of phosphorus has increased, whereas the loads from point sources have decreased. Decreasing point loads are due to more effective purification of both municipal and industrial wastewaters.
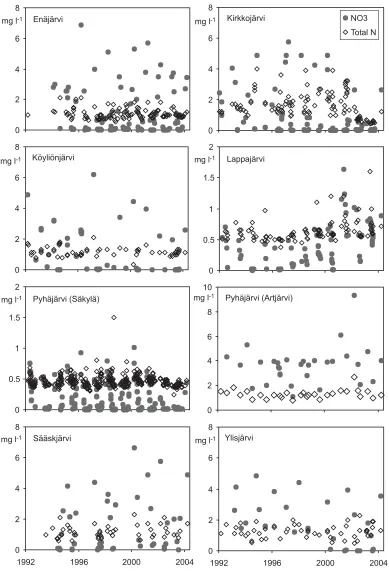
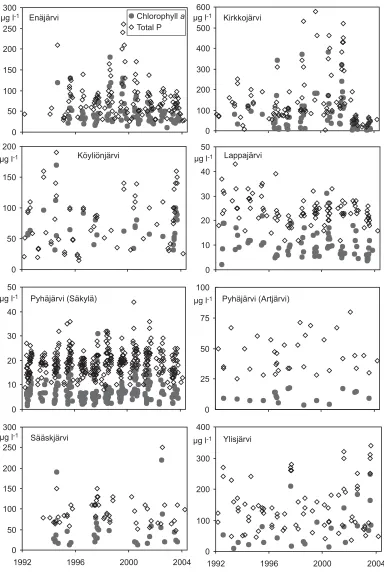
The whole country has been evaluated as a nitrate vulnerable area. In this report, NO3 concentrations and concentrations of other variables indicating eutrophication (total P, total N and chlorophyll a) were first studied in all Finnish surface waters during the last reporting period 2000–2002 (Chap. 2.2–2.3). Then seasonal and yearly changes in these 4 variables are described in 20 lakes, 23 rivers and 19 estuaries, which all receive nutrients primarily from agricultural sources. Investigation period covers mainly the years 1992–2002 (Chap. 2.4).
Long-term changes in agricultural nitrogen leaching were studied in detail in three agricultural catchments for the period 1981–2003 (Chap. 2.5).
2.1 Data collection
All data on surface waters used in this report were extracted from the National Water Quality database maintained by the Finnish Environment Institute (SYKE). The data originate from water quality monitoring and control programmes coordinated and carried out at national, regional and local levels (Niemi and Heinonen 2003). Sampling frequency varies by programmes.
The national monitoring programme covers 253 lake sites and 195 river sites – the Finnish Eurowaternet (Niemi et al. 2001a; 2002b) – and 100 sites in coastal waters. Some lakes, rivers and estuaries loaded mainly by agriculture are included in this national programme and presented in more detail in chapters 2.4.1–2.4.3. The Regional Environmental Centres carry out regular monitoring in regionally significant or otherwise interesting waters with varying frequency or as control samples on a non-frequent basis. In agricultural areas, some rivers and lakes are selected to present a typical situation and monitoring has been directed at them. Local monitoring is used here to mean monitoring of receiving waters of municipal waste water treatment plants, industry and others causing point-source loading. Supervised laboratories carry out the local monitoring.
Agricultural loading is mainly quantified on the basis of areal coefficients derived from measurements in small agricultural catchments (Rekolainen 1993; Rekolainen et al. 1995; Vuorenmaa et al. 2002). Long-term changes in agricultural nitrogen leaching in three of these small catchments are presented in Chap. 2.5. ○ ○ ○ ○ ○ ○ ○ ○ ○ ○ ○ ○ ○ ○ ○ ○ ○ ○ ○ ○ ○ ○ ○ ○ ○ ○ ○ ○ ○ ○ ○ ○ ○ ○ ○ ○ ○ ○ ○ ○ ○ ○ ○ ○ ○ ○ ○ ○ ○ ○ ○ ○ ○ ○ ○
These catchments are covered by the monitoring programme of the Finnish network of small representative catchments being also a part of the Finnish Eurowaternet monitoring network.
Nitrate data on all the surface waters stored in the national database were extracted to find NO3 concentrations in Finnish surface waters in 2000–2002. For rivers, data from all sampling depths for each river site were used, but for lakes and coastal areas only data from the surface layer were included, for lakes data from 0–2 m and coastal waters data from 0–5 m (either grab or composite samples). Altogether, there were 7,041 sampling sites in lakes, ponds, rivers, ditches, streams and coastal waters. Those sites where nitrate concentrations exceeded 20 mg l-1 (130 sites) were
examined carefully to exclude sites just below a point-source loading. There were left only 35 sites affected by agriculture and with nitrogen concentration >20 mg l-1 (Table
18). The number of sites with concentrations below 20 mg l-1 NO
3 was 6,911. From
these sites, the following were excluded: – all lakes with an area below 0.5 km2
– sites with strong influence from point-source loading such as municipalities, mines or dumping places
– small ditches between field areas used to measure non-point-source loading. – all sites with only 1–4 results in 2000–2002.
This resulted in a total of 2,376 sites shown in Fig. 1. Concentrations of total phosphorus (total P), total nitrogen (total N) and chlorophyll a from these same 2,376 sites are presented in Figs. 3–4.
In the previous report for the period 1996–1998, data from some 1,150 sites were used (Antikainen and Kangas 2000). Thus the number of sites had doubled for the reason that more nitrogen data were available for period 2000–2002 and more strict criteria for data were used last time: only sites with two or more results in every three reporting years 1996–1998 were accepted.
Analytical methods
For total N, total P and NO3-N, only data from unfiltered samples were used. These nutrients and chlorophyll a were analysed according to Finnish standard methods (see References). Laboratories have participated in proficiency testing (including inter-calibrations) carried out by SYKE.
NO2-N is readily oxidized to NO3-N in water, so separate analysis is difficult and the result is often expressed as a sum of NO3-N and NO2-N. The Nitrates Directive has settled a limit value of 25 mg l-1 for nitrogen, so in this report values
for nitrate nitrogen NO3-N were converted into nitrate (NO3) by multiplying NO3 -N data by 4.427. In Finland -NO3-N is normally used in reporting on water quality and eutrophication.
2.2 Nitrate concentrations in 2000–2002
In Finland’s surface waters, the average level of nitrateis generally low, <10 mg l-1