The Influence of AC and DC Voltages on Electrical Treeing in Low Density
Polyethylene
Hualong Zheng
a,*, George Chen
b, Simon M. Rowland
aaThe University of Manchester, School of Electrical and Electronic Engineering, Manchester, M13 9PL, UK bUniversity of Southampton, School of Electronics and Computer Science, Southampton, SO17 1BJ, UK
ABSTRACT
Electrical tree growth is a well-documented process leading to failure of high voltage polymeric insulation under AC stresses. However, tree growth in HVDC insulation failure is not well understood. This work considers electrical tree degradation in polymeric insulation subjected to combined AC and DC voltages. Tests in LDPE samples of needle-plane geometry yield three types of electrical trees, which grow depending on the magnitude of the AC components, irrespective of the DC voltages. In tests with an AC component of 10 kV (peak amplitude), 12 kV and 15 kV trees are distinguished by both the conductivity of tree channels and the tree shape, and are referred to as either conducting trees, non-conducting branch trees or non-conducting bush trees respectively. With 10 kV AC, tree initiation was significantly accelerated by superimposing -20 kV DC. With +20 kV DC, the incepted trees had more bifurcations, but there was no major change to tree initiation time. Space charge measurements on thin LDPE films provide a basis for understanding the difference between tree initiation with +DC and –DC voltages. The subsequent propagation of conducting trees were not influenced by biasing the 10 kV AC. With 12 kV AC and 15 kV AC, the growths of non-conducting branch and bush trees were both accelerated by positive biasing. A retardation was observed in bush tree growth with -15 kV DC. The effects of DC voltage polarity on tree morphology are different for branch and bush trees. Different relationships between PD magnitudes and tree growth were also found between branch and bush trees. The tree length determined PD magnitudes in branch trees and the evolution of PD in bush trees suggest that the additional DC stress has no impact to PD magnitudes. Nevertheless, DC bias effects on the symmetry between positive and negative discharges have been evidenced through PD analysis for bush trees. Moreover, the modifications on the shape of bush trees are believed to be associated with the changes in PD asymmetry. This work has illustrated the importance of AC ripples in the failure mechanisms in HVDC insulation.
Key words — Electrical tree, DC power quality, partial discharge, polarity dependence.
1 INTRODUCTION
The development of power electronics has enabled growth of DC power transmission systems globally. Over the last few decades, many offshore and onshore DC links have been developed with increasingly mature techniques and growing power ratings [1]. Accordingly, new challenges have emerged concerning the reliability of HVDC insulation systems. In network operating conditions, the insulation in an HVDC system is likely to be stressed under a combination of AC and DC stress, rather than a ‘pure’ DC voltage, for example including the harmonic voltages from power converters [2-3]. It is not yet clear how the combined stress (or the DC power quality) influences ageing and degradation of HVDC insulation.
As a major degradation process in solid polymeric insulation, electrical tree growth has formed an extensive literature. However this is mainly in the context of AC voltages; treeing under DC is considered in relatively few publications. Nevertheless, the conditions and mechanisms of electrical tree
initiation and growth under DC voltages have been established as significantly different to those under AC voltages. For example, the authors have previously reported that the voltage for electrical tree growth in an epoxy resin specimen has been measured at 60 kV – 70 kV under DC voltages, which compares to ~15 kV under 50 Hz AC [4]. Moreover, under DC stress, the initiation and growth of electrical trees were found to be polarity dependent [5-9].
and is believed to be the reason for polarity dependence [5-9]. The impact of space charge can also be revealed though the growth of trees under conditions such as those created by short-circuits, polarity reversal and voltage impulses. Trees grown under the influence of fast transients in DC circuits, must be regarded as distinct from those grown under true steady state DC conditions.
Depending on conditions, electrical trees can be of different shapes, commonly described as branch, bush or pine-needle types [10] depending on their fractal dimension [13]. The growth of electrical trees can also be characterised by distinct partial discharge behaviour [14] which is related to the concepts of conducting and non-conducting electrical trees introduced by Champion and Dodd [15]. A conducting tree is one in which the tree channels have a high enough conductivity to suppress PDs from occurring within them, so that only small discharges may then occur at tree tips (at newly grown tree segments). Therefore, discharges are of small magnitude, for example 0.01 – 0.3 pC [16]. On the other hand in non-conducting trees, discharges (which are 2 – 3 orders of magnitude larger) can propagate along the tree channels. It has been reported in cross-linked polyethylene (XLPE) that the formation of a graphitic deposit can gradually increase tree conductivity, turning a non-conducting tree into a conducting tree [17]. The subsequent breakdown process can be different depending on the type of electrical tree grown across the insulation. A ‘runaway’ to breakdown normally occurs following the propagation of a non-conducting tree [10]. However, the dielectric integrity of a sample may remain after a filamentary (conducting) tree penetrates the insulation, and the eventual breakdown is triggered by the subsequent growth of reverse (non-conducting) tree [18].
The authors have previous investigated electrical tree growth in a glassy epoxy resin under AC and DC combined waveforms [19]. The additional DC stresses were not found to accelerate the growth of a type of electrical tree known as a filamentary tree, beyond the rate seen under purely AC stress [18]. However the filamentary tree is a special form of electrical tree which differs from the well-known PD-driven (non-conducting) trees [14, 20]. Therefore, it is of interest to further investigate the influence of DC biased AC voltages on PD-driven tree growth. Since different tree structures are found to grow under different AC voltage magnitudes [21], this work is designed to provide a comprehensive view on how a DC voltage may influence the AC treeing process. This is a first step to determining the influence of voltage ripples on the reliability of DC polymeric insulation. In addition the influence of DC voltages on PD characteristics in different tree structures is examined.
2 EXPERIMENTAL
2.1 ELECTRICAL TREEING TEST
Samples were of needle-plane geometries. A 30 mm × 3.15 mm × 25 mm LDPE block was first heated up to 120 °C in a mould within an oven. This enabled the gradual insertion of a needle electrode, pushed by a weighted (190 g) needle holder. The mould provided samples with 2.27 mm ± 0.08 mm (mean ± standard deviation for all 34 samples tested) needle-plane separation. Following the insertion of the needle, the mould and
sample were kept at 120 °C for 1 – 2 hours to alleviate internal strain. Afterwards, they cooled to room temperature within the closed oven at a rate of ~26°C/h. The needle, sourced from Ogura®, had a tip radius of 3 μm, a tip taper angle of 30° and a shank diameter of 1 mm.
The experimental setup is shown in Figure 1. During a test, each sample was clamped onto a brass ground electrode. Voltage profiles were applied to the needle electrode from an HV amplifier (Trek®) whose input came from a 16-Bit waveform generator (NI PCI-5421). The breakdown current was limited by a 10 MΩ resistor. The voltage applied was monitored and recorded through a voltage divider. PD measurement was by an OMICRON MPD 600 system with a balanced circuit for the suppression of common-mode noise. The apparent discharge magnitudes QIEC was measured according to IEC 60270. Raw PD data, containing the apparent magnitude (pC) of each individual discharge pulse as a function of instantaneous time and voltage (amplitude and phase) was also captured. QIEC(t) were calculated every 300 ms. In this paper, a moving average over 9 s is applied for all QIEC data for clarity of display.
During testing, each sample was immersed in a silicone oil bath at room temperature together with the dummy sample (as a part of the balanced circuit) to prevent corona noise and flashover across sample surfaces. The development of tree structures was monitored by a CCD camera and back-lighting. In addition, the camera was used to measure the light emission (LE) due to PDs within the electrical trees by taking images with a long exposure time (20 s – 30 s) in the dark environment (i.e. the back-lighting was off). The experiment was terminated once the sample broke down or had been stressed for more than 430 minutes.
Tree images were processed using a Matlab based program to parameterise the tree growth. The first step was to calibrate the tree image recorded by the CCD camera to show the real dimension of the tree structure, and from which the tree length L can be determined as shown in Figure 2a. For the calculation of fractal dimension and tree area, the tree image is first binarized. This is realised in the Matlab program after image optimizations such as removing the background, as shown in Figure 2b. From the binarized tree image as exemplified in Figure 2c, the fractal dimension of the tree structure can be calculated based on the box counting method [22]. Moreover, the pixels representing the tree
area as a function of radial distance R from the needle tip can be determined as shown in Figure 2d. In Figure 2d, W, the half-height width of the tree area curve, is specifically collected for characterizing the bush tree growth.
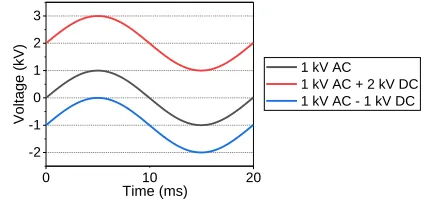
For the sake of convenience, AC voltages are referred by their peak amplitude throughout this work: for example ‘10 kV AC’ means a 50 Hz AC voltage of 20 kV peak-to-peak voltage. Positive and negative DC voltages are symbolised as ‘+DC’ and ‘−DC’. The waveforms are illustrated in Figure 3. Five samples were tested under each of the three 10 kV AC based test voltages: 10 kV AC, 10 kV AC + 20 kV DC and 10 kV AC – 20 kV DC. In the 12 kV AC test group, one result is given in each case superimposed on DC bias voltages of ±12 kV, ±15 kV and ±18 kV. For the 15 kV AC based test group, four tests were performed for each of the AC and ±15 kV DC conditions. It is worth noting that ±20 kV DC only (i.e. with no AC voltage) did not initiate an electrical tree within 450 minutes.
2.2 SPACE CHARGE MEASUREMENT
Thin LDPE films of ~180 µm thickness were fabricated by compressing the LDPE blocks in a plane (mirror-finished) steel mold at ~135ºC. Space charge measurements were performed using the pulsed electroacoustic (PEAs) method [23]. During
measurements, films were sandwiched by a semiconducting electrode and an aluminium electrode. Negative DC voltages were applied to the semicon-electrode to establish electrical fields of 21 kV/mm, 60 kV/mm and 72 kV/mm in three samples. Measurements were taken for a maximum of 260 minutes if quasi-equilibrium in space charge responses were not achieved. The analysis of space charge dynamics were performed based on the ratio of two interfacial charges as introduced in [24].
3 PURE AC TREE GROWTH
[image:3.612.305.561.63.157.2]Before exploring the impact of DC biasing, a group of benchmark tests were first performed to establish treeing features under different AC voltages. Three types of trees were observed to grow under AC voltage magnitudes of 10 kV, 12 kV and 15 kV. Tree shapes are compared in Figure 4 while the apparent discharges QIEC measured during tree growth are given in Figure 5. Branch and bush trees developed with increasing PD magnitudes under 12 kV and 15 kV respectively. At 10 kV, short dense channels of a pine-needle shape were observed to grow out of the main tree channels and the discharge magnitudes were, after 25 minutes, much smaller than that of the other two tests. From both the tree morphologies and discharge magnitudes, it can be speculated that the electrical tree grown at 10 kV AC was initially non-conducting but developed into a conducting type between 20 and 25 minutes of testing, while the branch and bush trees grown under 12 and 15 kV were of the non-conducting type.
Figure 2.(a)Tree length L measurement on the tree image (this image with a poor background is purposely selected as an example to show the ability of imaging processing over noisy images). (b) Digitally processed images for the binarization of tree structure as the result shown in (c). (d) shows the area of binarized tree structure as a function of the radial distance from the needle tip.
R
0 400 800
0 500 1000 1500 2000 2500
R (
m)
Tree Area (m2)
(a)
(b) (c) (d)
L
W
Figure 3.Nomenclature of voltage waveforms. 10
0 20
-2 -1 0 1 2 3
Voltag
e (kV) 1 kV AC 1 kV AC + 2 kV DC
1 kV AC - 1 kV DC
Time (ms)
[image:3.612.84.259.64.281.2]
Figure 4.Electrical trees developed at: (a) 10 kV after 175 minutes, (b) 12 kV and (c) 15 kV after breakdown at 163 and 87 minutes respectively.
Figure 5. PD magnitude as a function of treeing time from inception. For clarity, the smaller discharge magnitudes of the 10 kV test (the black line) are plotted on a secondary y-axis on the right.
0 30 60 90 120 150 180
0 100 200 300 400 500 600
12kV AC 15kV AC 10kV AC
Time (min) QIE
C
(pC
)
0 20 40 60
QIE
C
(pC
[image:3.612.327.510.202.311.2] [image:3.612.61.278.350.450.2]4 TREE INITIATION AND CONDUCTING
TREE GROWTH
(10 KV AC ± 20 KV DC)
4.1 TREEING PROCESS
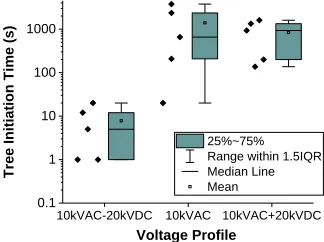
Figure 6 compares the tree initiation time between trees grown under 10 kV AC with and without ±20 kV DC. Despite the expected variations between the five samples in each group, a significant reduction in tree initiation time, by 1 ~ 2 orders of magnitude, can be found in 10 kV AC - 20 kV DC tests. The tests with negative DC having an average of 8 s, as opposed to 1400 s and 840 s for the AC and AC+DC cases respectively.
The subsequent tree growths in the needle-axis direction, known as the tree length L, are shown in Figure 7, in which the tree length (L) is normalised to the proportion of the dielectric crossed (LN). The growth of all trees featured a period of initial rapid extension from tree initiation for typically 10 – 20 minutes, followed by a period of stagnation of tens of minutes, after which a reasonably linear growth rate normally followed as the tree developed across the sample. The tree lengths at the stagnation stage are relatively consistent in AC and –DC biased tests at about 15% to 20% of LN, whereas the tree lengths are more diverse in tests with +DC. Such an observation is further
illustrated in Figure 8, which compares the tree lengths at 20 minutes after inception, when most of the trees had reached their stagnation stage. The two-sample t-test (at 5% significance level) supports the assertion that the mean tree length of –DC biased tests is smaller than the other two test groups.
In addition to the rate of inception and growth in length, another potential major difference between the trees is their shape. Images of stagnated trees after 20 minutes of tree growth are exhibited in Figure 9a – 9c. The tree grown under +DC biased voltage consist of a greater number of long tree branches, while the trees in AC and –DC biased tests propagated along the needle axis direction and had less bifurcation (i.e. the tree was narrower in the latter cases). However, the tree shape at the stagnation stage seems to have little impact on the shapes of trees developed subsequently as illustrated in Figure 9d – 9f which are all quite similar.
[image:4.612.325.484.61.184.2]Trees fully crossing the insulation may not lead to immediate breakdown. The two consequences of tests are distinguished in Figure 10 by using solid circles to show the time to breakdown and hollow circles to indicate the time of tree reaching the planar electrode if no breakdown followed. None of the samples broke down in AC tests and all samples had a runway process to breakdown in +DC tests. Overall, based on t-tests of 95% confidence, there is no statistical difference in the time taken for a tree to cross the insulation after initiation among the three test groups in Figure 10. The main distinguishing features between the three groups are that the +DC group have: a slightly lower mean value of treeing time, a longer tree at the stagnation period and, runaway breakdown could be trigged at a smaller tree length of about 70% ~ 80% LN as seen in Figure 7.
(a) (b) (c)
360 µm
Figure 6. Tree initiation time under different voltage conditions, with the box-whisker presentation.
10kVAC-20kVDC 10kVAC 10kVAC+20kVDC 0.1
1 10 100 1000
Voltage Profile
Tree I
niti
ati
on Time
(s)
25%~75% Range within 1.5IQR Median Line Mean
(a) 10 kV AC (b) 10 kV AC + 20 kV DC
(c) 10 kV AC - 20 kV DC Figure 7. Normalized tree growth from tree initiation.
0 50 100 150 200 250 300 0.0
0.2 0.4 0.6 0.8 1.0
Tree Len
gth L
N
Time (min)
T0-1 T0-2 T0-3 T0-4 T0-5
0 50 100 150 200 250 300 0.0
0.2 0.4 0.6 0.8 1.0
Tree Len
gth L
N
Time (min)
T1-1 T1-2 T1-3 T1-4 T1-5
0 50 100 150 200 250 300 350 400 450 0.0
0.2 0.4 0.6 0.8 1.0
Normalised Tree
Length
Time (min)
T2-1 T2-2 T2-3 T2-4 T2-5
Figure 8. Tree length at 20 minutes after tree initiation. 10kVAC-20kVDC 10kVAC 10kVAC+20kVDC 200
300 400 500 600 700 800
Tr
ee Le
ng
th
(
m
)
25%~75% Range within 1.5IQR Median Line Mean
[image:4.612.58.220.334.455.2] [image:4.612.54.294.493.716.2] [image:4.612.318.560.564.662.2](d) (e) (f)
Figure 9. Typical shapes of electrical trees at 25 minutes after tree initiation with (a) 10 kV AC – 20 kV DC, (b) 10 kV AC and (c) 10 kV AC + 20 kV DC, and the corresponding tree structures (d), (e) and (f) respectively immediately before breakdown, or by the time of tree had crossed the insulation if breakdown did not occur.
4.2 PARTIAL DISCHARGE
The magnitude of PDs during tree growth under the three voltage conditions are compared in Figure 11a using representative examples from each group (whose tree shapes have been illustrated in Figure 9). For convenience, the corresponding tree growth curves are given in Figure 11b. In general, the PD magnitudes are larger in +DC tests. Even with DC voltages, high discharge magnitudes were only detected during the initial tree growth of around 20 min to 30 min. Afterwards, PD magnitudes dropped to only a few pC at the end of the stagnation period and thereafter maintained a low PD level during the majority of tree growth. Considerable increase in PD magnitudes can be found
before the runway to breakdown in +DC tests.
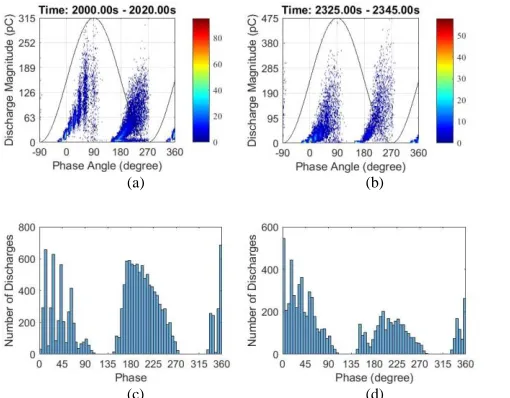
As outlined in section 3, the implication of the measurements on PD magnitude is that the trees are initially insulating, and those subsequently grown (after stagnation stages) are conductive in their nature. Such a distinction can be verified by light emission (LE) measurements that reveal the location of PDs within the tree structure. An example of LE measurements during a treeing process (in sample T1-4) is given in Figure 12. As shown in Figure 12a and 12b, PDs occurred in the skeleton of the tree before stagnation. Referring to the tree growth in Figure 7b, L was again growing at 7150 s (~119 min), at which time light emission was observed at the tree tips only, as shown in Figure 12c and 12d. The associated PD patterns for these two periods of LE are provided in Figure 13. As anticipated, the phase-resolved PD patterns are distinct between the conducting and non-conducting trees. When LE was seen in the body of the electrical tree, PD magnitudes increased with the rising part of the applied voltage waveform, resulting in a wing-shape pattern (Figure 13a) [25]. When LE was seen at tree tips only, PD patterns formed into a turtle-shape (Figure 13b).
500 µm
(a) 1440 s (b) 1470 s – 1490 s
[image:5.612.56.228.225.354.2](c) 7150 s (d) 7120 s – 7140 s
Figure 12. Light emission measurements in T1-4 in two 20 s periods in (b) and (d) with back-lit images in (a) and (c) showing the projections of tree structures at the times adjacent to the light emission measurements. Locations of light emission are highlight with red in (a) and (c) to assist the reader. All images are to the same scale. The red highlighted regions at the needle edge in (c) were due to light reflections at the needle surface.
500 µm
Figure 10. Time for trees to cross the insulation. Hollow circles indicate that breakdown did not subsequently occur; otherwise solid points are used to show the time to breakdown.
10kVAC-20kVDC 10kVAC 10kVAC+20kVDC 50
100 150 200 250 300 350 400 450 500
Voltage Conditions
Treeing Tim
e (
mi
n)
25%~75% Range within 1.5IQR Median Line Mean
(a) 1470-1490 s (b) 7120-7140 s
Figure 13. Phase-resolved PD patterns measured in T1-4 at two time periods of 20 s before and after the end of the stagnation period. A threshold of 0.5 pC was applied to remove noise.
(a) (b)
Figure 11. (a) Typical PD measurement in QIEC values for tree growth under the three voltage conditions given in the captions, and (b) the associated tree growth taken from Figure 7. Images of the trees are given in Figure 9.
0 40 80 120 160 200
0 5 10 15 20 25 30 35 40
QIEC
(pC)
Time (min)
T0-1 (10kV AC) T2-3 (10kV AC - 20kV AC) T1-3 (10kV AC + 20kV AC)
0 40 80 120 160 200 0.0
0.2 0.4 0.6 0.8 1.0 1.2
Tree Length L
N
Time (min)
[image:5.612.322.561.322.420.2]5 NON-CONDUCTING TREE GROWTH
5.1 BRANCH TREES GROWN UNDER 12 kV AC ± DC
Samples were tested under the combined voltages of 12 kV AC and a range of biased DC levels: ± 12 kV, ± 15 kV and ± 18 kV. In each case, the growth of tree length LN is plotted in Figure 14a and 14b for +DC and −DC biased tests. The times for the trees to initiate from voltage application are compared in Figure 14c. Time to tree initiation reduced linearly with −DC amplitude. However, no consistent variation in tree initiation can be found with the increase of +DC voltages. Comparing Figure 14a and 14b, it is observed that +DC has a more significant influence on tree propagation than −DC. With −DC voltages, although the times to breakdown were reduced compared to the AC-only situation, there is no clear variation with DC voltage magnitude. PD magnitude is seen to be dependent on tree length, but not on DC voltage component in Figure 15.
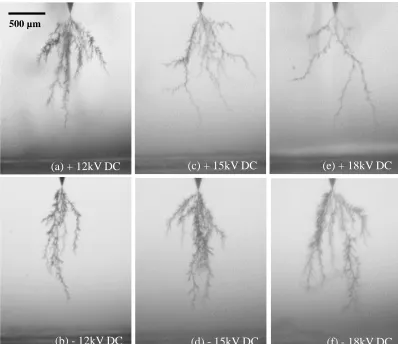
To evaluate the influence of DC component on tree morphology, tree structures with a length of LN ≈ 80% (~ 1.8 mm) and their fractal dimensions are compared in Figures 16 and 17. With higher +DC component, fewer tree branches develop. −DC has no measurable impact on the tree morphology.
(a) (b)
[image:6.612.324.523.53.225.2](c)
Figure 14.Tree growth from the time of initiation under 12 kV AC with: (a) +DC, (b) –DC. (c) Tree initiation time from the same tests.
(a) (b)
[image:6.612.330.478.256.366.2]Figure 15. Apparent discharge QIEC as trees developed under a variety of voltage forms (12 kV AC ± DC). A moving average over 9 s has been applied.
Figure 16.Images of electrical trees when the tree length L reached ~80% of
[image:6.612.49.293.335.539.2]insulation thickness (LN ≈ 80%).
Figure 17.Fractal dimension of the tree structures in Figure 16.
5.2 BUSH TREE (15 kV AC ± 15 kV DC)
With an AC component of 15 kV, all samples had tree initiation within 50 s of voltage application. Therefore, considering the small variation between the three 15 kV AC based test groups, tree initiation analysis is not considered further here.
When 15 kV AC was biased by ± 15 kV DC, a clear polarity effect on the tree growth was observed. The times to breakdown are compared in Figure 18, which demonstrates a shorter failure time of samples being stressed with +DC, and longer for those with –DC respectively. All samples immediately broke down when trees bridged the dielectric. Thus with the rapid inception times, the breakdown times reflect tree growth rates across the insulation.
Typical tree structures under the three voltage conditions are compared in Figure 19a – 19c. The fractal dimension of a bush
0 20 40 60 80 100 120 140 160 180 0.0
0.2 0.4 0.6 0.8 1.0
Tree Leng
th L
N
Time (min) 12kV AC +12kV DC +15kV DC +18kV DC
0 20 40 60 80 100 120 140 160 180 0.0
0.2 0.4 0.6 0.8 1.0
Tree Leng
th L
N
Time (min) 12kV AC -12kV DC -15kV DC -18kV DC
-20 -15 -10 -5 0 5 10 15 20 1
10 100
Tree Initiati
on
Time (s)
DC component (kV)
0 20 40 60 80 100 120 140 160 180 0
100 200 300 400 500
QIEC
(pC)
Time (min)
12kV AC 12kV AC + 12kV DC 12kV AC + 15kV DC 12kV AC + 18kV DC
0 20 40 60 80 100 120 140 160 180 0
100 200 300 400 500
QIEC
(pC)
Time (min)
12kV AC 12kV AC - 12kV DC 12kV AC - 15kV DC 12kV AC - 18kV DC
(a) + 12kV DC
(b) - 12kV DC
(c) + 15kV DC
(d) - 15kV DC
(e) + 18kV DC
(f) - 18kV DC
500 µm
(a) + 12kV DC
-18 -15 -12 0 12 15 18
1.1 1.2 1.3 1.4 1.5 1.6 1.7
Fractal Dimension
Biased DC Voltage (kV)
Figure 18.Time to breakdown for 15 kV AC based tests.
15kVAC-15kVDC 15kV AC 15kVAC+15kVDC 0
50 100 150 200 250
Tim
e to Brea
kdown (min)
25%~75% Range within 1.5IQR Median Line Mean
[image:6.612.48.284.574.674.2] [image:6.612.329.521.606.720.2]tree could not be estimated properly based on its 2-D projection [26]. In all samples, tree branches developed out of the bushy region, and the first branch reaching the planar electrode would form the breakdown channel. The areas of dense bushy trees were smaller in +DC tests and were larger in –DC tests, principally because the +DC tests required a shorter tree before runaway resulted in breakdown. Such an observation is further quantified in Figure 19d, which compares the distributions of tree structures as a function of radial distance to the needle tip for the three trees in Figure 19a – 19c. Figure 19d confirms that when a single tree channel penetrated the insulation, the region
of bush trees (alternatively called bushy region) was smaller for the positively biased case and larger when the AC was negatively biased.
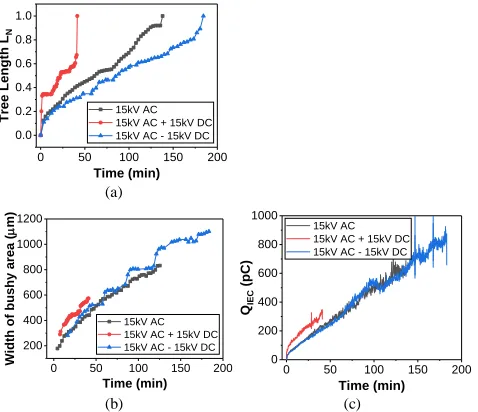
The growth of the three trees in Figure 19a – 19c are characterized in terms of tree length L and the width of bushy region W in Figure 20a and 20b respectively. Moreover, the PD magnitudes along with tree growths are given in Figure 20c. The growth curve for the +DC case indicates that the growth of the branches outside the bushy region was rapid. A slightly accelerated tree growth when LN exceeded ~0.5 can be seen in 3 of the 4 AC tests. This is seen after 80 min in Figure 20a. No such consistent treeing stages could be found among the –DC tests. QIEC almost increased linearly with time for all 15 kV AC based tests after the initial rapid tree extension of a few minutes. When compared to the pure AC tests the finial QIEC values are generally larger in –DC tests and smaller in +DC tests, as shown in Figure 20c. Comparing Figure 20c with Figure 20a and 20b respectively, it indicates that the PD magnitude correlated with the bushy tree region rather than the overall tree length.
6 PD CHARACTERISTICS
6.1 ASYMMETRIC PD PATTERN
PDs were commonly found to be asymmetric between positive and negative voltage phases in all the electrical treeing tests. To give a quantitative description on the asymmetry in PD activities, an example of PD analysis is given in Figure 21 using the unbiased 12 kV AC test as an example. Statistical parameters used for analysis in Figure 21 are: the number of discharges per cycle N, the sum of the discharge magnitudes in a voltage cycle Qsum, the mean discharge magnitude Qavg and the peak discharge magnitude Qpk. All parameters were acquired for 300 ms periods (15 cycles) for positive and negative discharges separately, but N and Qsum were further normalized to every 20 ms. Polarity-dependent PD activity can
(a) 11024 s (b) 8231 s (c) 2480 s
(d)
Figure 19.Typical tree shapes. (a) and (b) are tree images after breakdown in a 15 kV AC – 15kV DC test and a 15kV AC test respectively. (c) is the last tree image before breakdown under 15 kV AC + 15 kV DC. The breakdown channel is not given in (c) due to the catastrophic failure occurred in that sample prevented the observation on other tree channels. (d) areas of tree damage as function of radial distance from the needle tip.
(a)
[image:7.612.57.297.65.277.2](b) (c)
Figure 20. (a) Normalised tree growth, (b) development of bushy area and (c)
QIEC discharge magnitudes for three typical treeing tests under 15 kV AC and
that with ± 15kV DC. The ultimate tree images for these three tests have been
shown in Figure 19. A moving average over 9s was applied to all QIEC curves.
0 500 1000 1500 2000 2500 0 500 1000 1500 2000 2500 3000 Tree Area ( m 2)
Radial Distance from the Needle tip (m)
15kV AC 15kV AC + 15kV DC 15kV AC - 15kV DC
0 50 100 150 200 0.0 0.2 0.4 0.6 0.8 1.0 Tree Len gth L N Time (min) 15kV AC 15kV AC + 15kV DC 15kV AC - 15kV DC
0 50 100 150 200 200 400 600 800 1000 1200
Width of bushy
area ( m ) Time (min) 15kV AC 15kV AC + 15kV DC 15kV AC - 15kV DC
0 50 100 150 200 0 200 400 600 800 1000 QIEC (pC) Time (min) 15kV AC 15kV AC + 15kV DC 15kV AC - 15kV DC
Figure 21.Analysis of positive and negative discharges during tree growth at
12 kV AC. (a) N, the number of discharges per 20 ms cycle, (b) Qsum the sum
of PD magnitudes per cycle, (c) Qavg the average discharge magnitude every
300 ms, and (d) Qmax the maximum PD magnitude in each 300 ms period. For
clarity of display, a moving average over 9 s has been applied in all cases.
0 50 100 150
0 2 4 6 8 10 (b) +q -q Num be r o f Dis ch ar ge s (a)
0 50 100 150
0 200 400 600 +q -q To ta l Disch ar ge (p C)
0 50 100 150
0 50 100 +q -q Me an Disch ar ge (p C) Time (min) (c) (d)
0 50 100 150
[image:7.612.57.296.350.556.2]be seen in Figure 21a, 21c and 21d, an exception being the sum of discharge magnitudes seen in 21b. These parameters suggest that positive discharges are more stable than negative discharges in discharge frequency and magnitudes. Positive and negative discharges have the same Qsum at any given time, negative discharges occur with greater frequency, but are smaller on average.
In the example of the 12 kV AC test, N(+q) increased to a relatively stable level (~5) in about 10 minutes after tree initiation. However, there were large variations in N(-q) for short periods of time. Moreover, the frequency and duration of the drops in N(-q) seems to reduce over time as only a few periods of N(-q) dropped to below N(+q) after ~ 40 minutes (when LN ~40%) in Figure 21a. Based on the relationship between N(+q) and N(-q), there are two kinds of asymmetry in PD activities. For the convenience, they are referred to as stable PD and transient PD hereafter:
Stable PD: N(-q) > N(+q), Qpk (-q) < Qpk (+q) Transient PD: N(-q) ≤ N(+q), Qpk (-q) ≥ Qpk (+q)
Examples of the two types of PD states are illustrated in Figure 22 using PRPD patterns and histograms of N: (a) and (c) represent stable PD, (b) and (d) are transient PD type. According to the PRPD patterns, PD magnitudes generally increase with the point-on-wave voltage, resulting in the two wing-like shapes of the distributions. Figure 22 c and d illustrate the changes in PD occurrences between the two PD states.
6.2 NUMBER OF DISCHARGES
Polarity dependent PD patterns were also found in tests with 15 kV AC components. Although the PD patterns fall into the same two categories as the 12 kV AC based tests, the transient periods of PDs occurred more frequently. Figure 23 gives examples of the variation in N over time for each voltage profile with 15 kV AC. DC polarity does not have a clear influence upon the relative magnitudes of N(+q) and N(-q) at a given time. Unlike in the 12 kV AC based tests, N did not stabilize to a certain level
but kept increasing with a decreased rate over the entire treeing time.
The average numbers of discharges per cycle over the entire treeing processes for all 15 kV AC based tests are given in Figure 24. The effect of DC polarity appears in two aspects. Firstly, both N(+q) and N(-q) are reduced in +DC tests, and increased in –DC tests. Secondly, the difference between N(+q) and N(-q) was reduced in +DC tests, but increased in –DC tests.
6.3 LIGHT EMISSION
Figure 25 gives four examples of LE measurements on samples being tested under different AC voltages and DC
(a) (b)
[image:8.612.46.301.53.252.2](c) (d)
Figure 22. Two types of PD activities at two time points for a period of 20 s in the 12 kV AC treeing test. (a) and (b) are phase-resolved PD patterns. (c) and (d) gives the distribution of discharges over voltage phase angle in histograms. (a) and (c) represent stable PD and (b) and (d) the unstable states of PD.
(a)
(b)
[image:8.612.335.521.53.369.2](c)
Figure 23. Number of discharges per cycle in (a) a 15 kV AC test, (b) 15 kV AC +15 kV DC test and (c) a 15 kV AC -15 kV DC test. A moving average over 3 s was applied for all curves, and the time scales are different in each case.
Figure 24. Mean number of positive (depicted in red) and negative (blue) discharges over the entire treeing tests for 15 kV AC, and 15 kV AC ± 15 kV DC
-15 kV DC 15kV AC +15 kV DC
4 6 8
-q
Mean
Num
ber
of
Discha
rg
es
per
Cycle
Voltage Conditions
[image:8.612.342.520.422.542.2]polarities, with the corresponding tree images on the left side. The LE measurements evidence that the trees are the non-conducting type in which PDs originate from the needle tip and propagate along the tree channels. This is in contrast to the conducting tree shown in Figure 12b and 12d. Secondly, no polarity dependent changes can be found through the LE measurements. Last but not the least, LE measurements also show that there are more active tree channels hosting PD events in bush trees (Figure 25c and 25d) than in branch trees (Figure 25a and 25b). Moreover, the different brightness between active tree channels indicate that PDs occur intermittently in a tree channel and there are preferred tree channels for PD events at any given time.
7 SPACE CHARGE MEASUREMENTS ON
THIN FILMS
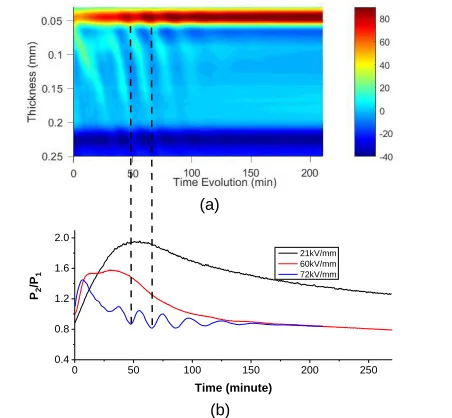
Space charge measurements on LDPE thin films show field dependent movements of slow space charge packages. Figure 26 shows the space charge profiles during the first charge package movements under 72 kV/mm. The corresponding space charge profiles for the full scale of measurements are shown in Figure 27a. In Figure 27b, the charge movements for two field levels, 60kV/mm and 72 kV/mm, are characterised by the ratios of interfacial charges, P2/P1. As indicated by the dash lines in Figure 27, a cycle of the ratio change reflects the charge packages moving through the insulation.
Figure 27b suggests that the charge package propagation was slower under 60 kV/mm than under 72 kV/mm. Moreover, there was only one broad package movement at 60 kV/mm, while there were 5 clear charge packages being observed in the 72 kV/mm test. For both field conditions, P2/P1 approached a
stable value smaller than 1, meaning more negative charges (P2 is at the cathode) had been injected into the insulation than positive.
8 DISCUSSION
8.1 TREE INITIATION
A. Effect of polarity
The polarity dependence of tree initiation has been reported in literature [5, 9], establishing that the voltage required for tree initiation is higher for –DC than for +DC. However, the present work has demonstrated (as shown in Figure 6) that when an AC component is superimposed on ± DC voltages, tree initiation time is greatly reduced under negatively biased voltage. The reduced tree initiation time reflects a lower voltage threshold for tree initiation under negative voltages (AC – DC) than positive voltages (AC + DC), which is therefore the opposite situation to the tree initiations under ramped DC voltages. Nevertheless, such a polarity effect can also be found in the initiation of DC grounding/earthing trees as reported in [6]. This work provides another perspective for interpreting polarity effects: such that the superimposed –DC voltage can accelerate the degradation mechanisms that dominate tree initiation under an AC stress, and
[image:9.612.371.520.57.156.2]Figure 26. Space charge measurements during the first charge package movements under 72 kV/mm.
Figure 27. (a) Space charge profiles in LDPE film under 72 kV/mm. (b)
The ratio of two interfacial charges. P1 is at the anode and P2 is at the cathode.
0 50 100 150 200 250 0.4
0.8 1.2 1.6 2.0
(b)
P2 /P1
Time (minute)
21kV/mm 60kV/mm 72kV/mm
[image:9.612.101.259.60.309.2](a)
[image:9.612.335.561.192.401.2]no such an impact results with +DC.
The polarity effect on the initiated tree shape (as shown in Figure 9a – 9c) are consistent with the DC treeing tests, as reported in [8]. However, it can be seen that the initial tree shapes for both 10 kV AC tests and 10 kV AC – 20 kV DC tests are similar, although tree initiation was quicker for the latter. On the other hand, although positively biasing the 10 kV AC did not accelerate the tree initiation, the incepted trees containing more bifurcations resemble that observed in pure DC tree initiations [8].
B. The AC + Negative DC case
The difference in tree initiation under different voltage polarities is believed to be related to the polarity-dependent space charge behavior around the needle tip. The authors have previously investigated DC tree growth from small (< 100 µm) tree-type defects pre-initiated at needle tips [4]. The minimum length of a tree-defect required for subsequent DC tree growth was shown to be longer under -DC, leading the authors to suggest that a large zone of negative space charge formed around the needle tip. This hypothesis is supported by the accelerated tree initiation with -DC biased voltages reported in this work. Due to the superimposed -20 kV DC component, negative charges envelop the electrode as illustrated in Figure 28a, now modulated by the AC voltage. Although a homocharge distribution may reduce the maximum electrical field in the dielectric compared to a pure ac voltage case, it will enhance the charge extraction during each cycle. As proposed in [27] and [28], tree initiation is related to a backflow of trapped electrons, i.e. positive discharges in PD measurements. In this case, trees might be initiated by a similar mechanism to that during grounding/short-circuit DC polarisation, but with a repeated effect each half cycle [28]. Consequently, the superimposed DC voltage makes tree initiation possible when the AC stress alone could not. Positively biasing the AC voltage does not lead to an equivalent space charge injection magnitude, and so does not lead to such an accelerated tree initiation.
C. The AC + Positive DC case
A direct measurement on the space charge distribution in a highly divergent field is not yet a mature technique. Here, as a
compromise, thin films made from the same LDPD material were used to provide a quantitative understanding that may indicate the space charge dynamics at needle tips. In the treeing samples, if we assume a 20 kV potential difference (V in Equation 1) between the needle (of a tip radius of r = 3 µm) and plane electrode which are separated by D = 2.27 mm, the Laplacian field E would drop below 100 kV/mm at a distance of d = ~24 µm from the needle tip, as can be calculated from the equation in [29]:
𝐸(𝑑) = 2𝑉
(𝑟+2𝑑−𝑑2/𝐷)𝑙𝑛(1+4𝐷/𝑟) (1)
In reality, due to a likely homocharge distribution, the electrical field should be even lower than the calculated Laplacian field. Therefore, the measured space charge behavior in thin films under a field range from 21 kV/mm to 72 kV/mm is likely to be applicable to the needle-plane samples.
The measured space charge packages show a field-dependent speed of transport. In the divergent field around a needle tip, positive charge packages should propagate away from the needle with a rapidly decreasing speed and therefore accumulate at some distance away from the tip. The assumed (schematically simplified) space charge distribution is illustrated in Figure 28b. With such a distribution, the enhancement of charge extraction from the needle during half of an AC cycle is weaker than that of negative space charge charges (in Figure 28a). This explains why an accelerated tree initiation only occurred with AC – DC tests.
8.2 TREE GROWTH
A. Conducting trees
PDs within the tree continuously occur along the wall of tree channels during the stagnation period as confirmed through both the PD and LE measurements in section 4.2. Ageing processes on the channel walls consequently lead to the growth of conducting trees, as reported in [30]. The PD patterns in Figure 13 for the two types of electrical trees, before and after the stagnation period are consistent with that simulated in [16]. PD characteristics associated with the physical change from a non-conducting tree to a conducting tree has been reported elsewhere [31].
Comparing the growth of trees in Figure 7, the additional DC stress does not accelerate the tree growth rate. As it is the conducting state of the tree that propagated through the majority of insulation, the samples had a similar failure time in Figure 10. The similar rates of tree growth suggests that the conducting tree growth is primarily determined by the AC component of the applied voltage. As interpreted in [15] and been visually shown in Figure 12d, the growth of a conducting tree is determined by PDs at the tree tips where the newly developing tree segments are not conductive. Therefore it can be speculated that the increased point on wave voltage at tree tips, due to the superimposed ±20 kV DC, has a minor influence on the localised PDs. This is in contrast to the impact of DC on PDs propagating from the metallic needle tips in non-conducting trees as will be discussed in the next sub-sections. Therefore, it is concluded that the DC component plays different roles in tree initiation and growth, even when the tree channels were considered to be relatively conductive. The
[image:10.612.88.254.69.197.2](a) (b)
acceleration in tree initiation with –DC biasing was not matched by the development of new tree segments from the existing tree channels, nor did the trees become more branchy with +DC biasing.
Due to the nature of a conducting tree, the additional DC voltage did influence the final sample breakdown. A thermal breakdown did not immediately incur following a conducting tree bridging between two electrodes under 10 kV AC. However, runaway to breakdown was more likely to occur with the additional DC stress as the results shown in Figure 10. This is attributed to a large peak voltage across the whole sample being more able to breakdown a conducting tree which has propagated across the dielectric.
B. Non-conducting trees
Unlike the conducting tree tests, significant acceleration in tree growths were observed in positively biased 12 kV AC tests and the 15 kV AC + 15 kV DC tests. More importantly, a clear delay in breakdown was found in 15 kV AC – 15 kV DC tests. However, based on the scope of this work, the evidence is not yet strong enough to conclude how –DC affects tree growth in branch trees with 12 kV AC components, though a small reduction in treeing time can be found with increasing –DC levels in Figure 14b.
The changes in treeing time reflect the modifications to tree morphologies. For 12 kV AC based branch trees, there is a reduction in fractal dimension (from 1.55 to 1.25) with the increase of +DC voltage levels. However, it is crucial to clarify that the reduced fractal dimension is not just due to the trees having fewer branches, which is the main difference between branch and bush trees. Comparing the tree images in Figure 16, the most significant change is not the number of long tree branches, but is the growth of short pines (or ‘tree buds’) on the long tree branches. The generation of the pine-trees is a consequence of PD continuously eroding the tree branches [31]. In +DC tests, the accelerated tree propagation leads to breakdown before the generation of pine-trees. Consequently, the major influence of +DC is the acceleration in tree growth rather than the changes to tree morphology.
Obvious changes to tree shapes were observed among the bush
trees in 15 kV AC based tests. However, as shown in Figure 20b the sizes of bush trees developed before breakdown are at given time are essentially independent of DC bias. This suggests that the growth of bush tree, or to be more specific the bushy region of the tree, was not affected by DC voltages. The shorter breakdown time for +DC tests, as shown in Figure 18, resulted from a few branches growing out of the bushy region as shown in Figure 19c. Such an acceleration is similar to what happened among branch trees and was suspected to be an effect of the DC component. Moreover the opposite effect, i.e. a reduction in trees branching out, was also observed in the –DC tests which consequently have a longer treeing time and a larger bushy tree region.
8.3 RELATIONSHIP BETWEEN PD AND NON-CONDUCTING TREE GROWTH
A. Initial tree grown in 10 kV AC based tests
As shown in Figure 7, once initiated, trees quickly grew to a length between 300 µm and 500 µm within the first 10 min to 20 min. PD magnitudes increased with the growth of the trees as the examples show in Figure 11a, indicating the tree structure has an insulating nature. Figure 11a shows that discharge magnitudes are higher with +DC biasing for equivalent tree lengths. To evaluate whether the superimposed DC voltage has any influence on PD activity in the initially grown non-conducting trees, the sum of PD magnitude over the first 20 min is plotted against the tree length for each test in Figure 29. A nearly linear relationship as revealed in Figure 29 suggests that PD magnitude is primarily determined by tree length and AC voltage, but is not directly influenced by the superimposed DC voltages. The similar conclusions can also be drawn from the pure non-conducting treeing in 12 kV and 15 kV AC based test as the following.
B. 12 kV and 15 kV AC based tests
[image:11.612.51.255.545.688.2]The relationship between tree growth and PDs has been widely reported in literature, for example [28, 32-33]. It has been established that PDs increase with the development of length of non-conducting trees. To compare the PD magnitudes between trees of different growing time, QIEC values are related to tree length LN in Figure 30 based on the results presented in Figure 14, 15 and 20. In Figure 30a and 30b, PD magnitudes are seen to increase almost linearly with tree length. The very similar PD magnitudes for a given tree length indicate the additional DC stresses have no major impact to PD magnitude. Furthermore, the similar increase in PD magnitude for a given increment in tree length implies that the acceleration in tree growth (in time) is not due to increased PDs. A slightly lower increase can be found in 12 kV AC + 18 kV DC. However, the differences between the QIEC (LN) curves in 12 kV AC based tests are minor comparing to that
Figure 29.Sum of discharge magnitudes (in pC) over the first 20 minutes of
tree growth plotted against the tree length at 20th minute of tree initiation for
in 15 kV AC based tests.
In Figure 30c, at the same tree length, PD magnitudes are increased by -DC biasing, but are reduced by +DC biasing. However, it is important to note that the changes to PD magnitudes among bush trees are not a direct consequence of applying DC stresses. Unlike the branch trees, applying DC voltages changed the physical tree density distribution in bush trees (Figure 19d) and thus changed the scope of tree channels available for PD occurrences as illustrated in Figure 25. Therefore, a positive correlation between the size of bushy tree region W and the PD magnitude can be seen between Figure 20b and 20c.
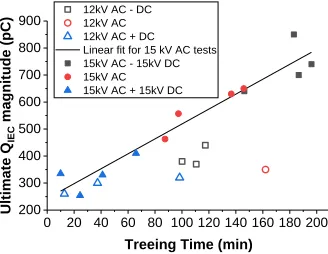
In addition to the three example tests, the QIEC values immediately prior to failure are plotted against the breakdown times in Figure 31 for all non-conducting tree tests. Unlike in the case of branch trees, there is a clear proportional relationship between the treeing time and QIEC magnitudes in bush trees. With regarding to the different tree density distributions, the PD magnitude appear to be more correlated with the volume of treeing
damage rather than the tree length alone.
The superimposed DC stresses have more impact on non-conducting tree growth than on non-conducting trees. Considering that the fundamental difference between conducting and non-conducting trees lies in the PD mechanism, it seems to be reasonable to link the cause of the DC effects on tree growth to the influence of DC on PD activities. However, the discussion above has shown that the superimposed DC voltage did not directly alter the PD magnitude.
8.4 INFLUENCE OF DC ON PD ASSYMMETRY
[image:12.612.54.296.74.294.2]PDs are dependent on the polarity of the half cycle in which they occur under AC voltages. Depending on the relative magnitudes of discharge numbers N or magnitudes Qpk between positive and negative discharges, this work classified two types of PD pattern, i.e. ‘Stable PD’ and ‘Transient PD’. Changes to discharge number N have been shown with application of DC bias in Figures 23 and 24 for bush trees. This indicates DC biasing could affect the asymmetric nature of PDs in, at least, bush trees. Furthermore, the percentage of the Stable PD (which is the fraction of the voltage cycles featuring Stable PD over the overall voltage cycles) are linked to the treeing time in Figure 32 for both branch and bush tree. Firstly, if only considering the data distributions on the x-axis between different voltage conditions (different colors in Figure 32), no change is found among 12 kV AC based tests, whereas clear shifts in the percentage of Stable PD can be found among the 15 kV AC based tests. The shifts in Figure 32b correspond to the differences in Figure 23. Secondly, the percentage of Stable PD in
Figure 31. QIEC magnitudes and time immediately prior to breakdown for 12 kV and 15 kV AC based tests.
0 20 40 60 80 100 120 140 160 180 200
200 300 400 500 600 700 800
900 12kV AC - DC 12kV AC 12kV AC + DC Linear fit for 15 kV AC tests 15kV AC - 15kV DC 15kV AC 15kV AC + 15kV DC
Ultim ate Q IEC mag nit ud e (p C)
Treeing Time (min)
(a) (b)
[image:12.612.319.560.431.534.2](c)
Figure 30. QIEC magnitude as function of tree length in (a) positively biased 12 kV AC tests, (b) negatively biased 12 kV AC tests and (c) 3 examples from the 15 kV AC based test groups.
0.0 0.2 0.4 0.6 0.8 1.0 0 100 200 300 400 500 600 QIEC (pC)
Tree Length LN
12kV AC +12kV DC +15kV DC +18kV DC
0.0 0.2 0.4 0.6 0.8 1.0 0 100 200 300 400 500 600 QIEC (pC)
Tree Length LN
12kV AC -12kV DC -15kV DC -18kV DC
0.0 0.2 0.4 0.6 0.8 1.0 0 200 400 600 800 1000 QIEC (pC)
Tree Length LN
15kV AC 15kV AC + 15kV DC 15kV AC - 15kV DC
[image:12.612.93.257.575.702.2](a) (b)
Figure 32. Relationship between the fraction of Stable PD occurrence and the treeing time for (a) 12 kV AC based branch trees and (b) 15 kV AC based bush trees. Bias voltages (blue dots negative, and red positive) are adjacent to each experimental data point.
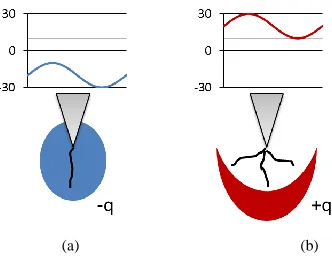
(a) (b) (c) Figure 33. Schematic on the polarity dependent DC effects on PD asymmetry. Hollow circles refer to a neutralized region.
0.3 0.4 0.5 0.6 0.7 0.8 0.9 1.0 0 50 100 150 200 -18 -15 -12 0 12 15 18
Treeing Time (min)
Fraction of Stable PD
0.3 0.4 0.5 0.6 0.7 0.8 0.9 1.0 0 50 100 150 200 -15 -15 -15 -15 0 0 0 0 15 15 1515
Treeing Time (min)
Fraction of Stable PD
[image:12.612.318.562.588.703.2]bush trees increases almost proportionally with treeing time. Moreover, the +DC tests have a different trend to the other two voltage conditions as the trending lines show in Figure 32b.
A deterministic model for electrical treeing [34] [35] revealed the relationship between tree shape and discharge activity. Based on this model, the changes to the shapes of bush trees under different DC biasing conditions can be explained along with the variations in PD asymmetry. Under pure AC conditions, a negative discharge under a negative voltage half cycle injects electrons from the needle tip into the tree structure and thus accumulates negative space charge around tree tips. On the subsequent positive voltage half cycle, only a small fraction of negative charges are required to supply seed electrons for a back avalanche, i.e. a positive discharge and thus an accumulation of negative space charges is left at the tree front, as illustrated by the schematic in Figure 33a. The experimentally observed higher fraction (> 0.5) of stable-type PDs for the 15 kV AC tests, shown in Figure 32b, may result because, in the unbiased case, de-trapping of a seed electron from tree tips (as indicated by the hollow circule in Figure 33a) is less likely than finding a seed electron at the metallic needle tip. With negative DC biasing, extra negative space charge will be accumulated at the tree tips as described in Figure 33b, increasing the likelihood of an free electron being available to seed avalanche inception. In contrast positive biasing reduces the likelihood of electrons being available for seeding discharge as they are removed from the polymer around the tree tip (generating positive space charge). This explains the common trend line for AC and AC-DC cases in Figure 32b, while the +DC biased tests had a change in behaviour and lower percentages of Stable PD on average. The additionally deposited negative charges in the negative biased case make positive discharges (back-avalanche) possible due to the field reversal during the reduction of applied voltage. More importantly, such a space charge distribution will inhibit avalanches occurred in the previous discharged channels, but favour discharging in previously undischarged regions and therefore act to develop a bushy structure, with higher fractal dimension [34, 36]. In the positively biased case, less positive space charge is expected to accumulate, as shown in Figure 33c, than that in the –DC biased case and therefore negative discharges due to a field reversal will become less frequent. Such positive space charge distribution will also inhibit positive discharges and consequently make the positive and negative discharge becoming more balance. Nevertheless, the reduced effect of space charge will not encourage tree branch as in the presence of negative space charge, so positive bias will lead to a lower fractal dimension (branch tree) [34, 36] and favour the development of a runaway tree channel.
9 CONCLUSIONS
This work provides a comprehensive view on electrical tree growth under AC and DC combined voltages in LDPE. Based on visual inspections and PD measurements on three types of electrical trees grown under different AC components, the influence of DC biasing on tree initiation, tree growth and PD characteristics are resolved as follows.
1. The superimposed -20 kV DC reduced the time for tree initiation under 10 kV AC by 1-2 orders of magnitude. In
contrast, no such acceleration in tree initiation occurred with +20 kV DC.
2. With an AC component of 10 kV, the non-conducting tree that initially grew for a few hundred micrometers gradually developed into a conducting tree. This transition is not affected by the applied ± 20 kV DC. Moreover, the growth of conducting trees, in terms of treeing time and tree shape, was not found to be affected by DC voltages.
3. Trees initiated quicker with -20 kV DC, but initially grew with more bifurcations with +20 kV DC. This is explained by considering polarity-dependent space charge injection from the needle tip.
4. Classical non-conducting branch trees and bush trees were found in tests with 12 kV and 15 kV AC components. Unlike with conducting trees, DC voltages had a profound impact on the growth of non-conducting trees. Applying +DC accelerated tree growth, resulting in a reduced fractal dimension of branch trees and fewer branches growing out of the bushy region in bush trees. On the country, for bush trees grown under -DC biased AC voltage, the time to breakdown was extended and the bushy tree region grew to a larger area than in either the AC or +DC biased cases. Nevertheless, such opposite effects were not found in branch trees.
5. Additional DC voltage on the AC does not directly influence the PD magnitudes. For branch trees, PD magnitude is a function of tree length. For bush trees, PD magnitude is proportional to the size of bushy region.
6. PD patterns are asymmetric between the positive and negative voltage phases. In bush trees, PD patterns became more balanced in +DC tests than in AC only tests, but applying –DC increased asymmetry. The changes to PD symmetry are attributed to the polarity-dependent space charge effects and believed to promote the growth of bushy trees.
The results above suggest that when AC ripples exist on an operating HVDC insulation, the likelihood of tree initiation is higher at the cathode than at the anode. Moreover, the propagation of non-conducting electrical trees (i.e. PD-driven trees) would be more harmful than conducting trees, as the propagation of non-conducting trees can be accelerated by the DC component, leading to more rapid degradation. This has important implication for managing DC power quality in power networks. In addition, for asset management, the reported PD characteristics under the combined voltage conditions suggest these may be used in assessing the degree of treeing degradation.
ACKNOWLEDGMENT
The authors are grateful to the EPSRC for support of this work through the project 'Towards Enhanced HVDC Cable Systems', EP/L021560/1.
REFERENCES
[1] Okba MH, Saied MH, Mostafa MZ, Abdel- Moneim TM. High voltage direct current transmission - A review, part I. IEEE Energytech, Energytech 2012, p. 1–7.
doi:10.1109/EnergyTech.2012.6304650.
[3] Duan R, Cui K, Wen J, Li R, Yan H, Zhao X. Harmonic suppressing control strategy for MMC–HVDC. J Eng; 2017:1035–9. doi:10.1049/joe.2017.0486.
[4] Iddrissu I, Zheng H, Rowland SM. DC electrical tree growth in epoxy resin and the influence of the size of inceptive AC trees. IEEE Trans Dielectr Electr Insul 2017;24:1965–72. doi:10.1109/TDEI.2017.006544.
[5] Ieda M, Nawata M. DC treeing breakdown associated with space charge formation in polyethylene. IEEE Trans Electr Insul 1977;EI-12:19–25. doi:10.1109/TEI.1977.298002. [6] Saito Y, Fukuzawa M, Nakamura H. On the mechanism of
tree initiation. IEEE Trans Electr Insul 1977;EI-12:31–4. doi:10.1109/TEI.1977.298004.
[7] Kitani I, Arii K. DC tree associated with space charge in PMMA. IEEE Trans Electr Insul 1987;EI-22:303–7. doi:10.1109/TEI.1987.298994.
[8] Fujii M, Watanabe M, Kitani I, Arii K, Yoshino K. Fractal character of DC trees in polymethylmethacrylate. IEEE Trans Electr Insul 1991;26:1159–62.
doi:10.1109/14.108154.
[9] Sekii Y, Kawanami H, Saito M, Sugi K, Komatsu I. DC tree and grounded DC tree in XLPE. IEEE Conf. Electr. Insul. Dielectr. Phenom., 2005, p. 523–6.
doi:10.1109/CEIDP.2005.1560735.
[10] Dissado LA, Fothergill JC. Electrical Degradation and Breakdown in Polymers. IET; 1992.
doi:10.1049/PBED009E.
[11] Jarvid EM, Johansson AB, Blennow JHM, Andersson MR, Gubanski SM. Evaluation of the performance of several object types for electrical treeing experiments. IEEE Trans Dielectr Electr Insul 2013;20:1712–9.
doi:10.1109/TDEI.2013.6633701.
[12] Tanaka T, Greenwood A. Effects of charge injection and extraction on tree initiation in polyethylene. IEEE Trans Power Appar Syst 1978;PAS-97:1749–59.
doi:10.1109/TPAS.1978.354668.
[13] Niemeyer L, Pietronero L, Wiesmann HJ. Fractal dimension of dielectric breakdown. Phys Rev Lett 1984;52:1033–6. doi:10.1103/PhysRevLett.52.1033.
[14] Zheng H, Rowland SM. Electrical treeing in a glassy epoxy resin — The filamentary tree and the PD tree. IEEE Conf. Electr. Insul. Dielectr. Phenom., 2017, p. 765–8.
doi:10.1109/CEIDP.2017.8257517.
[15] Champion J V, Dodd SJ. Simulation of partial discharges in conducting and non-conducting electrical tree structures. J Phys D Appl Phys 2001;34:1235–42. doi:10.1088/0022-3727/34/8/314.
[16] Dodd SJ, Chalashkanov NM, Fothergill JC. Partial discharge patterns in conducting and non-conducting electrical trees. IEEE Int. Conf. Solid Dielectr., 2010, p. 1– 4. doi:10.1109/ICSD.2010.5568217.
[17] Chen X, Xu Y, Cao X, Dodd SJ, Dissado LA. Effect of tree channel conductivity on electrical tree shape and breakdown in XLPE cable insulation samples. IEEE Trans Dielectr Electr Insul 2011;18:847–60.
doi:10.1109/TDEI.2011.5931074.
[18] Zheng H, Rowland SM, Iddrissu I, Lv Z. Electrical treeing and reverse tree growth in an epoxy resin. IEEE Trans Dielectr Electr Insul 2017;24:3966–73.
doi:10.1109/TDEI.2017.006729.
[19] Iddrissu I, Rowland SM, Zheng H, Lv Z, Schurch R. Electrical tree growth and partial discharge in epoxy resin
under combined AC and DC voltage waveforms. IEEE Trans Dielectr Electr Insul 2018;25:2183–90.
doi:10.1109/TDEI.2018.007310.
[20] Zheng H, Rowland SM, Jiang N. Influence of electrode separation on electrical treeing in a glassy epoxy resin. IEEE Conf. Electr. Insul. Dielectr. Phenom., 2017, p. 769– 72. doi:10.1109/CEIDP.2017.8257519.
[21] Chen X, Xu Y, Cao X, Gubanski SM. On the conducting and non-conducting electrical trees in XLPE cable insulation specimens. IEEE Trans Dielectr Electr Insul 2016;23:95–103. doi:10.1109/TDEI.2015.005416. [22] Kudo K. Fractal analysis of electrical trees. IEEE Trans
Dielectr Electr Insul 1998;5:713–27. doi:10.1109/94.729694.
[23] Li Y, Yasuda M, Takada T. Pulsed electroacoustic method for measurement of charge accumulation in solid dielectrics. IEEE Trans Dielectr Electr Insul 1994;1:188–95.
doi:10.1109/94.300251.
[24] Zheng H, Dodd SJ, Dissado LA, Holé S, Allais A, Kebbabi L. Space charge monitoring in cables at low DC electrical field. IEEE Conf. Electr. Insul. Dielectr. Phenom., 2015, p. 51–4. doi:10.1109/CEIDP.2015.7352024.
[25] Suwarno, Ichikawa H, Suzuoki Y, Mizutani T, Uchida K. Partial discharge patterns of electrical treeing in
polyethylene. Proc. 4th Int. Conf. Prop. Appl. Dielectr. Mater., 1994, p. 379–82. doi:10.1109/icpadm.1994.414019. [26] Schurch R, Ardila-Rey J, Montana J, Angulo A, Rowland
SM, Iddrissu I, et al. 3D characterization of electrical tree structures. IEEE Trans Dielectr Electr Insul 2019;26:220–8. doi:10.1109/TDEI.2018.007486.
[27] Hozumi N, Okamoto T, Fukagawa H. Simultaneous measurement of microscopic image and discharge pulses at the moment of electrical tree initiation. Jpn J Appl Phys 1988;27:572–6. doi:10.1143/JJAP.27.572.
[28] Mammeri M, Laurent C, Salon J. Influence of space charge buildup on the transition to electrical treeing in PE under AC voltage. IEEE Trans Dielectr Electr Insul 1995;2:27–35. doi:10.1109/94.368676.
[29] Bamji SS, Bulinski AT, Prasad KM. Electric field
calculations with the boundary element method. IEEE Trans Electr Insul 1993;28:420–4. doi:10.1109/14.236204. [30] Wu K, Suzuoki Y, Mizutani T, Xie H. Model for partial
discharges associated with treeing breakdown: III. PD extinction and re-growth of tree. J Phys D Appl Phys 2000;33:1209–18. doi:10.1088/0022-3727/33/10/312. [31] Zheng H, Rowland S. Partial discharge characteristics
during electrical tree growth in LDPE. IEEE 2nd Int. Conf. Dielectr. ICD 2018, p.1–4. doi:10.1109/ICD.2018.8468495. [32] Laurent C, Mayoux C. Analysis of the propagation of
electrical treeing using optical and electrical methods. IEEE Trans Electr Insul 1980;EI-15:33–42.
doi:10.1109/TEI.1980.298294.
[33] Laurent C, Mayoux C. From initiation to propagation in electric treeing. Int. Conf. Partial Disch., 1993, p. 7–8. [34] Dissado LA, Fothergill JC, Wise N, Cooper J. A
deterministic model for branched structures in the electrical breakdown of solid polymeric dielectrics. J Phys D Appl Phys 2000;33:L109--L112.
doi:10.1088/0022-3727/33/19/103.
IEEE Conf. Electr. Insul. Dielectr. Phenom., 1997, p. 304– 7. doi:10.1109/CEIDP.1997.634619.