A Dissertation on
STUDY OF PULMONARY FUNCTION TESTS IN PATIENTS
WITH HYPOTHYROIDISM.
Dissertation Submitted to
THE TAMILNADU Dr.M.G.R. MEDICAL UNIVERSITY CHENNAI - 600 032
With partial fulfillment of the regulations for the award of the degree of
M.D. GENERAL MEDICINE
BRANCH-I
COIMBATORE MEDICAL COLLEGE,
COIMBATORE
CERTIFICATE
Certified that this is the bonafide dissertation done by Dr. MANOJKUMAR.V and submitted in partial fulfillment of the requirements
for the Degree of M.D., General Medicine, Branch I of The Tamilnadu Dr. M.G.R. Medical University, Chennai.
Date: Guide, Professor & Head
Department of Medicine
Date: Dean
CERTIFICATE – II
This is to certify that this dissertation work titled Study of Pulmonary Function tests in patients with Hypothyroidism of the candidate DR.MANOJKUMAR.V with registration Number 201511304 for the award of M.D in the branch of General Medicine I personally verified the urkund.com website for the purpose of plagiarism Check. I found that the uploaded thesis file contains from introduction to conclusion pages and result shows 3% (Three percentage) percentage of plagiarism in the dissertation.
DECLARATION
I solemnly declare that the dissertation titled “STUDY OF PULMONARY
FUNCTION TESTS IN PATIENTS WITH HYPOTHYROIDISM” was done by me from JULY 2016 to JUNE 2017 under the guidance and supervision of Professor Dr. KUMAR NATARAJAN. M.D.,
This dissertation is submitted to The Tamilnadu Dr.M.G.R. Medical University towards the partial fulfilment of the requirement for the award of MD Degree in General Medicine(Branch I).
Place: Coimbatore Dr. MANOJKUMAR.V
ACKNOWLEDGEMENT
I wish to express my sincere thanks to our respected DEAN Dr.B.ASOKAN M.S., Mch and DME Dr.EDWINJOE M.D, B.L
(FORMER DEAN CMCH) for having allowed me to conduct this study in our hospital.
I express my heartfelt thanks and deep gratitude to the Head of the Department of Medicine Prof. Dr.KUMAR NATARAJAN, M.D. for his generous help and guidance in the course of the study.
I sincerely thank all professors and Asst. Professors-
Dr.P.VISHNURAM M.D., DR. N. KARUPPUSAMY M.D., Dr.A.AKILA,
M.D, for their guidance and kind help.
My sincere thanks to Dr. KEERTHIVASAN M.D, Professor & HOD, Department of Thoracic Medicine for his help.
My sincere thanks to my parents, all my friends and post-graduate colleagues for their whole hearted support and companionship during my studies.
I thank all my PATIENTS, who formed the backbone of this study without whom this study would not have been possible.
Lastly, I am ever grateful to the ALMIGHTY GOD for always showering His blessings on me and my family
LIST OF ABBREVIATIONS USED
T3 - Triiodothyronine
T4 - Thyroxine
TSH - Thyroid stimulating hormone
TRH - Thyrotropin releasing hormone
mIU /L - milli international units/liter
ng/dL - nano grams/ deciliter
ug/dL - micrograms/deciliter
PFT - pulmonary function tests
FVC - Forced Vital capacity
FEV1 - Forced Expiratory Volume in One second
FEV3 - Forced Expiratory Volume in Three seconds
PEFR - Peak Expiratory Flow rate
FEF - Forced Expiratory Flow
MVV - Maximal Voluntary Ventilation
VC - Vital Capacity
RC - Residual capacity
TLC - Total Lung Capacity
P value - Probability value
SR - Serum
CONTENTS
SL.NO TITLE PAGE
NO
1 INTRODUCTION 1
2 AIM AND OBJECTIVES 3
3 REVIEW OF LITERATURE 4
4 MATERIALS AND METHODS 35
5 RESULTS 38
6 DISCUSSION 87
7 SUMMARY 88
8 CONCLUSION 89
9 BIBLIOGRAPHY 90
10
ANNEXURES
A1 - PROFORMA
A2 - CONSENT FORM
A3 - MASTER CHART
LIST OF TABLES
Sl.No TABLE PAGE
NO
1 MAJOR ACTIONS OF THYROID HORMONE 13
2 CAUSES OF HYPOTHYROIDISM 18
3 AGE DISTRIBUTION OF SUBJECTS IN THE
PRESENT STUDY 38
4 SEX DISTRIBUTION 39
5 BMI DISTRIBUTION 40
6 DURATION OF DISEASE 41
7 FOLLOW UP OF PATIENTS 42
8 SERUM T3 LEVELS IN THE STUDY
POPULATION 43
9 SERUM T4 LEVELS IN THE STUDY
POPULATION 44
10 SERUM TSH LEVELS IN THE STUDY
POPULATION 45
11 FVC VALUES IN THE STUDY POPULATION 46
12 FEV VALUES IN THE STUDY POPULATION 47
13 PEFR VALUES IN THE STUDY POPULATION 48
14 FEF 25%-75% IN THE STUDY POPULATION 49
15 FEV1/FVC VALUES IN THE STUDY
POPULATION 50
16 GRADE OF RESTRICTIVE PATTERN 51
17 PFT IN STUDY POPULATION 52
18 ASSOCIATION BETWEEN SERUM T3 AND
RESTRICTION 53
19 ASSOCIATION BETWEEN SERUM T4 AND
20 ASSOCIATION BETWEEN SERUM TSH AND
RESTRICTION 55
21 SERUM T3 VS GRADE OF RESTRICTION 56
22 SERUM T4 VS GRADE OF RESTRICTION 57
23 SERUM TSH VS GRADE OF RESTRICTION 58
24 ASSOCIATION BETWEEN FOLLOWUP AND
RESTRICTION 59
25 ASSOCIATION BETWEEN DURATION OF
DISEASE AND RESTRICTION 60
26 ASSOCIATION BETWEEN SEX AND
RESTRICTION 61
27 SERUM T3 AND PFT 62
28 SERUM T4 AND PFT 63
29 SERUM TSH AND PFT 64
30 RELATION BETWEEN PFT AND SERUM T3 65
31 RELATION BETWEEN PFT AND SERUM T4 66
32 RELATION BETWEEN PFT AND SERUM TSH 67
33 PFT AND FOLLOWUP 68
34 PFT AND DURATION OF DISEASE 69
35 PFT AND SEX DISTRIBUTION 70
36 FVC AND SERUM T3 71
37 FEV AND SERUM T3 72
38 FEV/FVC AND SERUM T3 73
39 PEFR AND SERUM T3 74
40 FEF 25%-75% AND SERUM T3 75
41 FVC AND SERUM T4 76
43 FEV/FVC AND SERUM T4 78
44 PEFR AND SERUM T4 79
45 FEF 25%-75% AND SERUM T4 80
46 FVC AND SERUM TSH 81
47 FEV AND SERUM TSH 82
48 FEV/FVC AND SERUM TSH 83
49 PEFR AND SERUM TSH 84
50 FEF 25%-75% AND SERUM TSH 85
51 CORE RELATION BETWEEN VARIOUS
LIST OF CHARTS
Sl.No DIAGRAMS PAGE
NO
1 AGE DISTRIBUTION 38
2 SEX DISTRIBUTION 39
3 BODY MASS INDEX 40
4 DURATION OF DISEASE 41
5 FOLLOW UP 42
6 SERUM T3 LEVELS 43
7 SERUM T4 LEVELS 44
8 SERUM TSH LEVELS 45
9 FVC VALUES 46
10 FEV VALUES 47
11 PEFR VALUES 48
12 FEF 25-75% VALUES 49
13 FEV1/FVC VALUES 50
14 GRADE OF RESTRICTION 51
15 PFT 52
16 GRADE OF RESTRICTION VS SERUM T3 53
17 GRADE OF RESTRICTION VS SERUM T4 54
18 GRADE OF RESTRICTION VS SERUM TSH 55
19 SERUM T3 VS RESTRICTION 56
20 SERUM T4 VS RESTRICTION 57
22 GRADE VS FOLLOW UP 59
23 DURATION OF DISEASE VS GRADE 60
24 SEX VS GRADE 61
25 PFT VS SERUM T3 62
26 PFT VS SERUM T4 63
27 PFT VS SERUM TSH 64
28 SR.T3 AND RESTRICTION 65
29 SR.T4 AND RESTRICTION 66
30 SR.TSH AND RESTRICTION 67
31 PFT VS FOLLOW UP 68
32 DURATION OF DISEASE AND PFT 69
33 SEX VS PFT 70
34 MEAN FVC% VS T3 71
35 MEAN FEV% VS T3 72
36 MEAN FEV/FVC VS T3 73
37 MEAN PEFR VS T3 74
38 MEAN FEF 25-75% VS T3 75
39 FVC AND SR T4 76
40 FEV1 AND SR T4 77
41 MEAN FEV1/FVC VS T4 78
42 MEAN PEFR VS T4 79
43 FEF 25-75% AND SRT4 80
45 MEAN FEV% VS TSH 82
46 MEAN FEV/FVC VS TSH 83
47 MEAN PEFR VS TSH 84
LIST OF FIGURES
Sl.No DIAGRAMS PAGE NO
1 GROSS ANATOMY OF THE THYROID GLAND 6
2 SLIDE SHOWING THYROID HISTOLOGY 7
3 SCHEMATIC SHOWING STEPS IN THYROID
HORMONE SYNTESIS
11
4 SCHEMATIC OF MECHANISM OF
THYROXINE ACTION
14
5 THE THYROID REGULATORY LOOP 16
6 SCHEMATIC OF HYPOTHYROIDISM
CLINICAL FEATURES
19
7 SPIROMETER 22
8 FEV1/FVC RATIO 30
9 PFT NORMAL VALUES 31
10 FLOW-VOLUME LOOPS 33
1
INTRODUCTION
Hypothyroidism is a relatively common disease worldwide. It is defined as a clinical state resulting from insufficient secretion of thyroid hormone from thyroid gland due to some structural and/or functional impairment of thyroid hormone production1,2. Hypothyroidism affects all organ systems and the clinical findings include fatigue, dryness of skin, cold intolerance, weight gain without loss of apetite, constipation, swelling of extremities, dyspnea, and hoarseness of voice, menorrhagia, hair loss, bradycardia and multiple neurological symptoms2.
Respiratory system like other body systems and organs is affected by hypothyroidism though respiratory manifestations are seldom the major compaints in hypothyroidism3. The spectrum of diseases involvement can range from mild dyspnea to more severe and life threatening respiratory failure4,5. Lung volumes are usually normal but few studies have shown findings suggestive of restrictive pattern of impairment. This has been attributed to decrease in both expiratory and inspiratory muscle strength, alveolar hypoventilation due to depression of hypoxic and hypercapnic ventilator drives and decrease in maximal breathing capacity and diffusion capacity in patients with hypothyroidism6,7,8.
2
fatigue10. So, assessment of pulmonary function with spirometry in patients with thyroid disorders are particularly important. Thereby, in the present study, pulmonary function tests were done on hypothyroid patients to show whether there was any impairment in lung function parameters.
3
AIM AND
OBJECTIVES
AIM
1. To determine any functional lung impairment amongst patients diagnosed with Hypothyroidism by Spirometry.
OBJECTIVES
1. To study clinical and investigative profile of patients with Hypothyroidism.
4
REVIEW
OF
LITERATURE
THYROID GLAND: HISTORY
The name „thyroid‟ (Greek thyreos- shield, and eidos-form) was coined by Wharton in 1656; however, its endocrine function was noticed only about two centuries later.11,12
EMBRYOLOGY
The thyroid gland originates from the embryologic endoderm. It develops from the floor of the primitive pharynx in the third week of gestation whereupon it migrates from the foramen caecum (located at the base of tongue),along the thyroglossal duct to reach its final location in the neck. This explains the rare occurrence of ectopic thyroid tissue (called lingual thyroid) at the base of the tongue; it also explains the occurrence of developmental thyroglossal cysts in the neck.
Thyroid follicles appear in the second month of gestation and thyroid hormone production begins at 11 weeks.13
Thyroid follicles composed of follicular cells surround a proteinaceous substance called colloid. Colloid is rich in thyroglobulin from which thyroid hormones are ultimately generated.
Research has revealed that the expression of transcription factors (paired box, PAX& NKK2 homeobox) is needed for proper development of the
5
Parafollicular cells (also called C-Cells) which are the source of the calcium regulating hormone calcitonin develop from the ectoderm of the neural crest, subsequently migrating into the ultimobranchial body and getting integrated into the thyroid gland.16
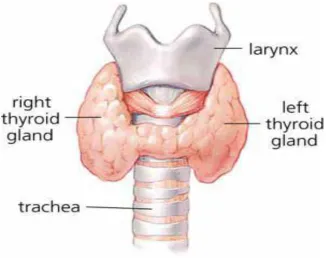
GROSS ANATOMY
The normal thyroid gland is accessible to inspection as well as palpation as it lies superficially in the neck overlying the second to the fourth or fifth tracheal rings. The gland is made up of two lobes and a connecting isthmus. The normal gland weighs in at around 20 grams making it one of the largest endocrine organs of the human body. Each of the lobes measures around 2x1x1 inch and the isthmus is around ½ an inch in height.17
CAPSULE
6
Figure 1: Gross anatomy of the thyroid gland
PARATHYROID GLANDS
There are four parathyroid glands, two on each side, located at the posterior aspect of the lobes of thyroid gland and responsible for the production of the parathyroid hormone, a key regulator of serum calcium levels.18
VASCULATURE, LYMPHATICS AND INNERVATION17
The thyroid gland derives its arterial supply as follows:
1. Superior thyroid artery- branch of the external carotid artery. 2. Inferior thyroid artery-branch of the thyrocervical trunk. 3. Thyroid ima artery- branch of the brachiocephalic trunk 4. Accessory thyroid artery- seen in a few cases.
7
1. Superior thyroid veins- tributaries of the internal jugular vein. 2. Middle thyroid veins
3. Inferior thyroid veins- tributaries of the brachiocephalic vein. Lymph is drained out of the gland into the following lymphatic groups:
1. Lateral deep cervical lymph nodes
2. Pre-tracheal and para-tracheal lymph nodes. Parasympathetic nerves supply the gland via:
1. Superior laryngeal nerve 2. Recurrent laryngeal nerve
Special care is advocated during thyroid surgery to avoid injury to these nerves where they are in close proximity to the borders of the thyroid gland.
HISTOLOGY OF THYROID GLAND
Microscopically, spherical follicles constitute most of the gland. These follicles are the functional part of the gland. About 30 to 40 follicles constitute a thyroid lobule.
8
The follicles are responsible for absorption of iodine from the blood. Colloid, a special proteinaceous component found within the follicular lumen, is the site of storage of thyroid hormones. Thyroid follicles are composed of thyroid epithelial cells, which are also known as follicular cells. These cells are responsible for the secretion of the hormones T3 and T4.19
The presence of abundant colloid, large follicles, and flat follicular cells is indicative of an inactive gland; presence of smaller follicles with scanty colloid and columnar follicular cells indicates an active gland which is secreting lot of thyroid hormones.17
Parafollicular cells are scattered randomly among the follicular cells. These cells are also called C cells and are the source of the calcium regulatory hormone, Calcitonin.
THYROID PHYSIOLOGY 20
The thyroid gland has the following main physiological functions: 1. Synthetis and release of the thyroid hormones T3 and T4 2. Production of calcitonin
THYROID HORMONES
9
c Of the total mass of thyroid hormone secreted, 90% is T4 and 10% is T3. Of the circulating T4, approximately 4/5th is converted in the periphery to T3. T4 to T3 monodeiodination takes place mainly in the liver, spleen and kidneys but also in all other cells in the body. T3 is approximately five times more active than T4.21
SYNTHESIS OF THYROID HORMONES
Thyrocytes (thyroid follicular cells) serve to concentrate iodine in the blood against a concentration gradient as iodine is essential for the synthesis of the thyroid hormones.22
Thyrocytes are equipped with a special sodium iodide symporter also called NIS which, working by way of complex ATP dependent process,transports iodide into thyrocyte alongside Sodium ion tansport happening naturally against a concentration gradient. The Sodium iodide symporter is located at the basolateral membrane (which abuts the arteriolar endothelium) of the thyroid follicular cell. The iodine concentration within the thyrocyte and blood is about 30 times that in the circulation.
IODINE TRAP AND THE SYNTHESIS OF THYROID HORMONES
The „iodine trap‟ is a special mechanism existing to help the thyrocyte
10
1. Tyrosine residues within the colloid are iodinated continuously by thyroid peroxidase.23,24
2. This creates a relative iodine deficiency within the thyrocyte in spite of the actual thyroid concentration being much greater than that of the blood.
3. This prevents the cell becoming saturated with iodine and keeps creating space for more iodine to enter the cell.
4. Iodine trap has also been labeled as „iodine pump‟ by some authors.22 5. Following iodine trapping and binding to tyrosine, a unique „coupling
reaction‟ occurs within the colloid wherein the molecules of DIT
(diiodinated tyrosine) condense to form T4. Similarly,T3 is formed by condensation of a molecule of DIT with a molecule of MIT(monoiodinated tyrosine).
11
Figure 3: Schematic showing steps in thyroid hormone synthesis
The following points are of special interest in thyroid hormone synthesis:
1. Wolff Chaikoff effect-this phenomenon is noted when excessive amounts of iodine suddenly become available to the normal thyroid gland. Paradoxically, this leads to a block of the enzyme thyroid peroxidase and can lead to functional hypothyroidism.
2. Jod Basedow effect- this phenomenon is noted in a similar situation of iodine excess but after a prolonged period of iodine depletion. The thyrocyte responds by increasing the production of thyroid hormone drastically and leads to hyperthyroidism.25
THYROGLOBULIN
12
Thyroglobulin is synthesized by the thyrocytes and secreted into the colloid.T3 and T4 are released by cleavage from thyroglobulin upon stimulation by TSH.
TRANSPORT OF THYROID HORMONE
Protein binding keeps a major part of the thyroid hormones in the circulation. Thyroxine-binding globulin(TBG), albumin and transthyretin (Thyroxine binding prealbumin) are the plasma proteins which bind these Hormones in the order of importance; this means that only a very small fraction of both T3(0.3%) and (0.03%) are freely available in the plasma. Normally, only the free hormone is metabolically active.22
THYROID HORMONE METABOLISM
About 35% of the circulating T4 is converted into T3 in the peripheral tissues by a local tissue 5,-monodeiodinase. About 45% of T4 in circulation is converted to reverse T3 by 5-monodeiodinase, which is metabolically inactive.
T3 and T4 are degraded in the liver and the kidney by microsomal enzymes and sulphureted and glucuronidated byproducts are excreted in the bile from which a proportion is reabsorbed and the rest is excreted.
ACTIONS OF THE THYROID HORMONE
13
This leads to an alteration in both the rate and the quantity of expression of specific genes that are involved in the regulation of cell growth and metabolism.27
The effects of thyroid hormones extend across several organ systems. The following table lists the major actions of thyroid hormones:28
Table 1: Major actions of Thyroid hormones
Cardiovascular system - Increases heart rate and facilitates the effect of catecholamines on heart.
Muscle tissue - Increases Protein catabolism
Adipose tissue - Increases lipolysis
Intestine - Facilitates carbohydrate absorption
Neural tissue - Facilitates growth and mentation
Skeletal system - Facilitates growth and maturation
Lipid metabolism - Increases number of LDL receptors; lower total cholesterol
14
Figure 4: Schematic of Mechanism of thyroxine action
REGULATION OF THE THYROID AXIS
The body has developed a simple yet effective regulatory loop for thyroid hormone homeostasis. It involves an interaction between thyroid stimulating hormone secreted by the anterior pituitary gland, the thyrotropin releasing hormone (TRH) released by the hypothalamus, and the circulating levels of thyroid hormones T3 and T4 in a tightly regulated negative feedback circuit. The components of this thyroid regulatory loop are described in further detail below.
THYROTROPIN / THYROID STIMULATING HORMONE (TSH)
15
actions conferred on TSH, Whereas the alpha subunit is similar in structure to the alpha subunits of other endogenous hormones like Luteinizing hormone (LH) and Follicle stimulating hormone (FSH).29
TSH is produced and secreted by the cells of the anterior pituitary in response to the specific hypothalamic hormone Thyrotropin releasing hormone (TRH).
The half life of secreted TSH in the circulation is about 1 hour. It is secreted normally in a pulsatile manner, peak secretion occurring during 10 PM to 2 AM. TSH is metabolized by microsomal enzymes in the kidney and the liver. The TSH receptor belongs to the seven transmembrane family of G-protein coupled receptors and activates adenylyl cyclase. This leads to increase in the intracellular cyclic AMP levels. TSH also increases phosphatidyl inositol turnover by activating phospholipase C. The normal value of TSH in the circulation is expressed in SI units and varies from 0.4 to 4 milli International Units / Liter (mIU/ L).22,30,31
THE NEGATIVE FEEDBACK LOOP: THE HPT AXIS (The
Hypothalamus Pituitary Thyroid Axis)
16
The below listed points succinctly summarize the complex mechanisms of the HPT axis:
1. TRH, which is released by the hypothalamus, stimulates the anterior pituitary to release TSH.
2. TSH, which in turn increases the production of T3 and T4, is negatively regulated by circulating levels T4.
3. T4 also inhibits the release of TRH from the anterior pituitary, a feedback loop called the „Fekete-Lechan loop‟33. Somatostatin, another
hormone produced by the hypothalamus, acts similarly by reducing the pituitary production of TSH.
17
So, it is seen that the concentration of T3 and T4 in the blood regulates the pituitary release of TSH. This means that low T3 and T4 concentrations ramp up the production of TSH and high T3 and T4 concentrations reduce TSH production and release. This is a classic example of a „negative feedback loop‟.
TSH production is also affected to a certain extent by several stimuli:
STIMULI which increase serum TSH level: 1. Cold exposure
STIMULI which decrease serum TSH level: 1. Somatostatin & dopamine
2. Glucocorticoids
3. Sex hormones (estrogen and testosterone) 4. Stress
CALCITONIN
The C cells (parafollicular cells) of thyroid gland secrete calcitonin. It is a small protein which is involved in calcium homeostatis. It acts by inhibiting bone resorption, producing calciuria and thereby down regulating the serum calcium and phosphate levels. It is not of relevance to the present study and will not be discussed in detail here.
HYPOTHYROIDISM
18
Causes of Hypothyroidism34
Table 2: Causes of Hypothyroidism
Post-Thyroid surgery-commonest cause
Sequela of thyroiditis- commonest cause in the west Nutritional iodine deficiency
Food goitrogens- cabbage,turnips
Drugs-Amiodarone,lithium,interferons,sulfonamides Hypopituitarism-reduced TSH production
Wolff-Chaikoff effect- Iodide induced hypothyroidism Systemic malignancy
Post-radiation therapy
Chemotherapy (Radioiodine,sunitinib)
The important clinical features of hypothyroidism are weight gain, cold intolerance, lethargy, constipation, menorrhagia, hypertension (especially diastolic hypertension), bradycardia, thin hair, peripheral edema, hoarse voice and the woltman‟s sign (delayed deep tendon reflexes).
19
NORMAL THYROID PROFILE-
Serum T3- 0.51 to 1.58 ng/ml Serum T4 – 5.3 to 12.1 ug/dl Serum TSH- 0.44 to 3.45 ulu/ml
20
LUNG FUNCTION TESTS
Lung function tests 35 measure how lungs take in air and exhale and also how efficiently they transfer oxygen into the blood. There are a lot of tests included in Pulmonary function tests. It is a generic term used to indicate a battery of studies or manoeuvres that may be performed using standardized equipment to measure lung function.
It evaluates one or more aspects of the respiratory system -Respiratory mechanics
-Lung parenchymal fuction/ Gas exchange -Cardiopulmonary interaction
Pulmonary function tests can be classified broadly into
MECHANICAL/VENTILATORY FUNCTIONS OF LUNG/CHEST WALL -BEDSIDE PULMONARY FUNCTION TESTS
-STATIC LUNG VOLUMES & CAPACITIES-VC, IC, IRV, ERV, RV, FRC. -DYNAMIC LUNG VOLUMES-FVC, FEV1, FEF25-75%,
-PEFR, MVV, RESP. MUSCLE STRENGTH GAS-EXCHANGE TESTS
ALVEOLAR-ARTERIAL PO2 GRADIENT DIFFUSION CAPACITY
GAS DISTRIBUTION TESTS-
21
GAS DISTRIBUTION TESTS- RADIO Xenon SCINTIGRAM. SPIROMETRY
It was invented by John Hutchinson.
“Spirometry is a medical test that measures the volume of air an individual inhales or exhales as a function of time.”
It cannot measure –FRC, RV, TLC
The main instrument used in pulmonary function testing is the spirometer. It is designed to measure changes in volume and can only measure lung volume in chambers that exchanges gas with the atmosphere. Spirometer with electronic signal outputs (pneumotachs) also measure flow (volume per unit of time).A device is usually always attached to the spirometer which measures the movement of gas in and out of the chest and is referred to as spirograph. Sometimes the spirograph is replaced by a printer like unit. This tracing is called a spirogram. Many computerized systems have complex spirographs or printouts that show the predicted values next to the observed values (the values actually measured).The unit will have in memory all of the prediction tables for males and females across all age groups.
22
size which may have an impact on the lung ction of one individual compared to another.
Figure 7: Spirometer
INDICATIONS FOR SPIROMETRY 38
1. DECTECTING PULMONARY DISEASES History of pulmonary symptoms
Chest pain or orthopnea Cough or phlegm production Dyspnea or wheezing
Physical findings Chest wall deformities Cyanosis
23
Finger clubbing
Abnormal laboratory findings Abnormal blood gas analysis Abnormal chest xray
2. ASSESSING SEVERITY OR PROGRESSION OF DISEASE Pulmonary diseases
Chronic obstructive pulmonary diseases Cystic fibrosis
Interstitial lung diseases Sarcoidosis
Cardiac diseases
Congestive heart failure Congenital heart diseases Pulmonary hypertension Neuromuscular diseases Amyotrophic lateral sclerosis Guillain-Barre syndrome Multiple sclerosis
Myasthenia gravis
3.RISK STRATIFICATION OF PATIENTS FOR SURGERY Thoracic surgeries
24
Pneumonectomy Cardiac surgeries Coronary bypass
Correction of congenital abnormalities Valvular surgery
Organ implantation
General surgical procedures Cholecystectomy
Gastric bypass
4. EVALUATING DISABILITY OR IMPAIRMENT Social security or other compensation programs Legal or insurance evaluations
CONTRAINDICATIONS OF SPIROMETRY
Acute disorders affection test performance (e.g., vomiting, nausea, vertigo) Hemoptysis of unknown origin (FVC maneuver may aggravate underlying condition.)
Pneumothorax
Recent abdominal or thoracic surgery
Recent eye surgery (increases in intraocular pressure during spirometry) Recent myocardial infarction or unstable angina
25
FACTORS AFFECTING SPIROMETRY VALUES 36
AGE:
The natural elasticity of the lungs decreases with age. As age increases lung volume and capacities become smaller and smaller. So it is important to compare the results of a normal person of the same age and gender while interpreting spirometry values.
GENDER:
Usually males have more lung volume and capacities compared to females even when they are matched for height and weight. Because of this difference in lung volumes and capacities, different normal tables must be used for males and females
BODY HEIGHT AND SIZE:
Body size has huge effects on PFT values. The PFT results of a small man will be smaller than a man of the same age who is much larger. Normal tables give predicted PFT data for males or females of a certain age and height by accounting for this variable. As people age they begin to increase their body mass by increasing their body fat to lean body mass ratio.
The abdominal mass prevents the diaphragm from descending as far as if could and the PFT results will be below the expected PFT values –i.e. the
26
RACE:
The PFT values are affected by race also. Blacks, Hispanics and Native Americans have different PFT results compared to Caucasians. Hence while interpreting PFT values of a patient, we should use a race appropriate table to compare the patient‟s measured pulmonary function against the results of the normal table written for that patient‟s racial group.
The degree of effect on PFT is not clearly understood for other factors such as environment factors and altitude but may have effect on PFT.
PREPARING THE PATIENT:
The patients should be confortable and they should be seated since their is a change of faintness or syncope during the procedure. Before doing the test the purpose of the test should be explained to the patient. Ideally the correct technique is demonstrated before asking the patient to use a spirometer for the first time. And ask the patient to have some practice sessions before the readings are taken. Encourage the patient to keep blowing out so that maximal exhalation can be achieved. The total number of times the patient takes for practice and recording is limited to eight or less at each session.
SPIROMETRIC VALUES:
27
volumes and their combinations measure various lung capacities such as functional residual capacity (FRC),inspiratory capacity and VC.37
FVC-Forced Vital Capacity:-
This is the volume of air which can be forcibly and maximally exhaled out of the lungs after a deep inspiration. FVC is usually expressed in units called liters. This PFT value is very significant in the diagnosis of obstructive and restrictive diseases.
FEV1-Forced Expiratory Volume in One Second
This is the amount of air which can be forcibly exhaled from the lungs in the first second of a forced expiratory manoeuvre. It is expressed as liters. This PFT value is very significant in the diagnosis of obstructive and restrictive diseases.
FEV1/FVC –FEV1 Percent (FEV1%)
This measurement is the ratio of FEV1 to FVC –it indicates what percentage of the total FVC was expelled from the lungs during the first second of forced exhalation-this number is called FEV1%,%FEV1 or FEV1/FVC ratio.This value helps in the diagnosis of obstructive and restrictive diseases.
FEV3- Forced Expiratory Volume in Three Seconds
28
since in the normal individual most of the air in the lungs can be exhaled in three seconds.
FEV3/FVC-FEV3%
This number is the ratio of FEV3 to the FVC- it indicates what percentage of the total FVC was expelled during the first three seconds of forced exhalation. This is called % FEV3 or FEV3%.
PEFR- Peak Expiratory Flow Rate
This is maximum flow rate achieved by the patient during the forced vital capacity manoeuvre beginning after full inspiration and starting and ending with maximal expiration-it can either be measured in L/sec or L/min- this is a useful measure to see if the treatment is improving obstructive diseases like bronchoconstriction due to asthma.
FEF-Forced Expiratory Flow
Forced expiratory Flow is a measure of how much air can be expired from the lungs. It is a flow rate measurement. It is measured as liters/second or liters/minute. The FVC expiratory curve is divided into quartiles and therefore there is a FEF that exists for each quartile. The quartiles are expressed as FEF25%, FEF50% and FEF75% of FVC.
FEF25%
29
FEF50%
This measurement describes the amount of air expelled from the lungs during the first half(50%) of the forced vital capacity test. This test is useful when looking for obstructive disease. The amount of air that will have been expired in an obstructed patient is smaller than that measured in a normal patient.
FEF 25%-75%
This measurement describes the amount of air expelled from the lungs during the middle half of the forced vital capacity test. Many physicians like to look at this value because it is an indicator of obstructive disease
MVV- Maximal Voluntary Ventilation:-
This value is determined by having the patient breathe in and out as rapidly and fully as possible for 12-15 seconds-the total volume of air moved during the test. Usually expressed as L/sec or L/min. The value helps to assess the status of the respiratory muscles, compliance of the thorax-lung complex, and airway resistance. Drawback of the test it is effort dependant and therefore can be a poor predictor of true pulmonary strength and compliance.
MEASUREMENT OF FEV1 AND FVC
30
The patient should hold their breath just long enough to seal their lips. The patient should NOT purse their lips as if blowing a trumpet, and ideally should pinch their nose or wear a nose clip. The patient should now blow the breath out, forcibly, as hard and as fast as possible, until there is nothing left to expel.
Figure 8: FEV1/FVC ratio
Patient should be encouraged to keep blowing out. Some spirometers give a beep to confirm the manoeuvre is complete. Now repeat the procedure two times.
Ideally three readings should be obtained of which the best two which are within 100ml, or 5% of each other. Depending on model of Spirometer the results may be displayed or directly printed into strip.
31
FEV1 <80% predicted normal FVC <80% predicted normal FEV1/FVC ratio < 0.7
Obstructive disorder:
FEV1 decreased (<80% predicted normal)
FVC is usually found to be reduced but to a smaller extent than FEV1 FEV1/FVC ratio (<0.7)
Restrictive disorder
FEV1 decreased (<80% predicted normal) FVC decreased (<80% predicted normal) FEV1/FVC ratio normal(>0.7)
32
MEASURING VITAL CAPACITY (VC)
The VC is a non-forced manoeuvre and usually greater than the FVC in COPD. It shows more accurate measurement of lung volume when airways are floppy, as in emphysema. It is usually calculated at the beginning of the procedure to understand the patient with the equipment.
A fresh, new, clean, disposable, one way mouthpiece is attached to the spirometer.
Patient should breathe in as deeply as possible( in full inspiration).
Patient is asked to hold their breath just long enough to seal their lips. The patient should NOT purse their lips as if blowing a trumpet, and ideally should pinch their nose or wear a nose clip.
Breathe out steadily, slowly at a comfortable pace. Continue until expiration is complete.
The measurement of slow VC may allow the assessment of airflow obstruction in patients who are unable to peform a forced measurement to full exhalation.
FLOW-VOLUME MEASUREMENT
33
However, interpretation of the flow-volume curve must take into account the values of FEV1 and FVC ( as a % of predicted normal).
34
Figure 11: Spirometric values
Normal flow-volumes
On exhalation, there is a fast rise to the maximal expiratory flow continued by a steady, uniform decrease until all the air is exhaled.
Obstructive disorder:
In a patient with obstructive airways disease, the expiratory flow (PEF) is decreased and the decline in airflow to complete exhalation follows a distinctive dipping(or concave) curve.
Severe obstructive disorder:
In a severe airflow obstruction, especially with emphysema, the characteristic „steeple pattern‟ is seen in the expiratory flow graph.
Restrictive disorder:
35
MATERIALS AND METHODS
SOURCE OF STUDY: Data consists of primary data collected by the principal investigator directly from the patients who attend Medicine OPD and Patients who get admitted in the Government Medical College and Hospital Coimbatore
DESIGN OF STUDY: Cross Sectional Study.
PERIOD OF STUDY: One year.
SAMPLE SIZE: 50
INCLUSION CRITERIA:
Patients (Both Genders) diagnosed as case of Hypothyroidism at Coimbatore Medical College Hospital clinically and biochemically were included.
Age above 18 yrs.
EXCLUSION CRITERIA:
Patients with Present and past history of Smoking. Diabetes Mellitus patients.
Patients with Systemic Hypertension . Alcoholic and Obese individuals. Patients with Goitre.
Pregnancy and lactation
Patients not capable of giving consent (psychiatric patients).
36
METHODOLOGY
The study is will be undertaken on the patients attending outpatient department and as well as getting admitted in the Coimbatore Medical College and Hospital, Coimbatore during the study period .A total of 50 patientswill be enrolled in the study.
The list of the patients enrolled in the study is appended along with the dissertation. The study excludes minors, pregnant women, mentally-ill and non-volunteering patients, Smokers, Alcoholics, Hypertensivepatients, Diabetes mellitus patients, Obese patients and patients with Goitre.
The study is proposed to be conducted after obtaining informed signed consent from the patients. The duration of the study is one year .The principal investigator, after obtaining informed signed consent from the patients to participate in the study, collects their baseline characteristic details, medical history details and physical examination details.
37
INVESTIGATIONS
1. Thyroid function tests such as Serum T3, Serum T4 by Competitive enzyme immunoassay method. Serum TSH by chemiluminescent immunometric assay method.
2. Pulmonary function tests such as FVC, FEV1, FEV1/FVC, PEFR, FEF(25%-75%) by Med Spiro Pulmo lab III
3. Chest X-ray.
STATISTICS:
38
RESULTS
Table 3: AGE DISTRIBUTION OF SUBJECTS IN THE PRESENT
STUDY
AGE (IN YEARS) NO OF PATIENTS PERCENTAGE
<30 18 36%
31-40 16 32%
41-50 13 26%
>50 3 6%
39
Table 4: SEX DISTRIBUTION
SEX NO OF PATIENTS PERCENTAGE
MALE 18 36%
FEMALE 32 64%
40
Table 5: BMI DISTRIBUTION
BMI NO OF PATIENTS PERCENTAGE
<20 21 42%
>20 29 58%
41
Table 6: DURATION OF DISEASE
DURATION OF DISEASE NO OF PATIENTS PERCENTAGE
MORE THAN 1 YR 37 74%
LESS THAN 1 YR 13 26%
42
Table 7: FOLLOW UP OF PATIENTS
FOLLOW UP NO OF PATIENTS PERCENTAGE
YES 14 28%
NO 36 72%
43
Table 8: Serum T3 levels in the Study Population
SERUM T3 NO OF PATIENTS PERCENTAGE
< 0.3 11 22%
0.3 - 0.4 18 36%
0.4 - 0.5 21 42%
44
Table 9: SERUM T4 LEVELS IN THE STUDY POPULATION
SERUM T4 NO OF PATIENTS PERCENTAGE
< 1 12 24%
1 TO 3 14 28%
3 TO 5 24 48%
45
Table 10: SERUM TSH LEVELS IN THE STUDY POPULATION
SERUM TSH NO OF PATIENTS PERCENTAGE
> 10 24 48%
7 TO 10 14 28%
3 TO 7 12 24%
46
Table 11: FVC VALUES IN THE STUDY POPULATION
FVC NO OF PATIENTS PERCENTAGE
LOW 44 88%
NORMAL 6 12%
47
Table 12: FEV VALUES IN THE STUDY POPULATION
FEV NO OF PATIENTS PERCENTAGE
LOW 44 88%
NORMAL 6 12%
48
Table 13: PEFR VALUES IN THE STUDY POPULATION
PEFR NO OF PATIENTS PERCENTAGE
LOW 22 44%
NORMAL 28 56%
49
Table 14: FEF 25%-75% VALUES IN STUDY POPULATION
FEF 25-75% NO OF PATIENTS PERCENTAGE
LOW 25 50%
NORMAL 25 50%
50
Table 15: FEV1/FVC VALUES IN THE STUDY POPULATION
FEV1/FVC NO OF PATIENTS PERCENTAGE
NORMAL 6 0%
INCREASED 44 100%
CHART 13:
51
Table 16: GRADE OF RESTRICTIVE PATTERN
GRADE OF RESTRICTION NO OF PATIENTS PERCENTAGE
SEVERE 12 24%
MODERATE 15 30%
MILD 17 34%
NORMAL 6 12%
52
Table 17: PFT IN STUDY POPULATION
PFT NO OF PATIENTS PERCENTAGE
RESTRICTIVE PATTERN 44 88%
NORMAL 6 12%
53
Table 18: ASSOCIATION BETWEEN SERUM T3 AND RESTRICTION
SERUM T3
GRADE OF RESTRICTION < 0.3 0.3 TO 0.4 0.4 TO 0.5
SEVERE 9 2 1
MODERATE 1 12 2
MILD 1 4 12
NORMAL 0 0 6
P VALUE - 0.001 SIGNIFICANT KRUSKAL WALLIS TEST
54
Table 19: ASSOCIATION BETWEEN SERUMT4 AND RESTRICTION
SERUM T4
GRADE OF RESTRICTION < 1 1 TO 3 3 TO 5
SEVERE 10 1 1
MODERATE 1 11 3
MILD 1 2 14
NORMAL 0 0 6
P VALUE - 0.001 SIGNIFICANT
KRUSKAL WALLIS TEST
55
Table 20: ASSOCIATION BETWEEN SERUM TSH AND
RESTRICTION
TSH
GRADE OF RESTRICTION > 10 7 TO 10 3 TO 7
SEVERE 10 1 1
MODERATE 1 12 2
MILD 1 1 15
NORMAL 0 0 6
P VALUE - 0.001 SIGNIFICANT KRUSKAL WALLIS TEST
56
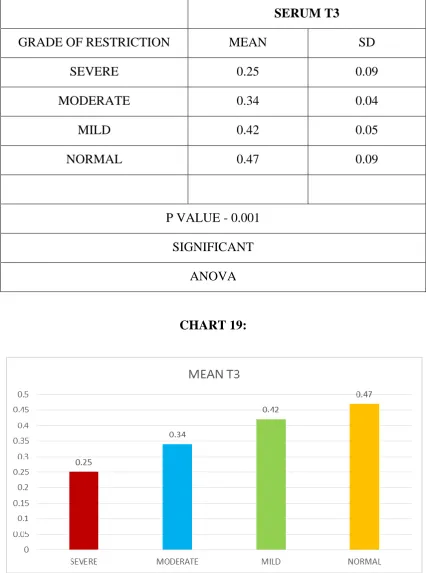
Table 21: SERUM T3 VS GRADE OF RESTRICTION
SERUM T3
GRADE OF RESTRICTION MEAN SD
SEVERE 0.25 0.09
MODERATE 0.34 0.04
MILD 0.42 0.05
NORMAL 0.47 0.09
P VALUE - 0.001 SIGNIFICANT
ANOVA
57
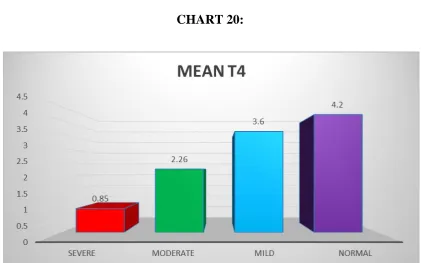
Table 22: SERUM T4 VS GRADE OF RESTRICTION
SERUM T4
GRADE OF RESTRICTION MEAN SD
SEVERE 0.85 0.84
MODERATE 2.26 0.87
MILD 3.6 1.02
NORMAL 4.2 0.42
P VALUE - 0.001 SIGNIFICANT
ANOVA
58
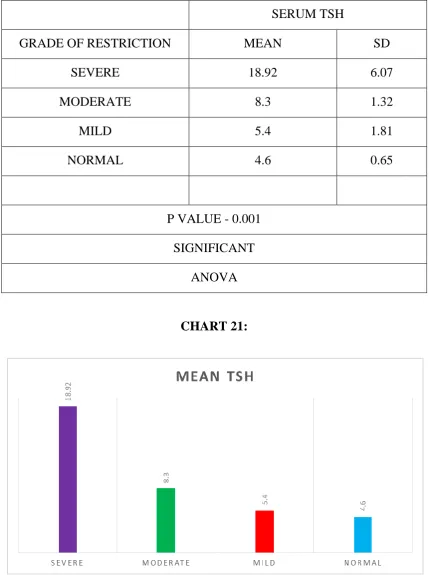
Table 23: SERUM TSH VS GRADE OF RESTRICTION
SERUM TSH
GRADE OF RESTRICTION MEAN SD
SEVERE 18.92 6.07
MODERATE 8.3 1.32
MILD 5.4 1.81
NORMAL 4.6 0.65
P VALUE - 0.001 SIGNIFICANT
ANOVA
59
Table 24: ASSOCIATION BETWEEN FOLLOW UP AND
RESTRICTION
FOLLOW UP
GRADE OF RESTRICTION YES NO
SEVERE 2 10
MODERATE 3 12
MILD 4 13
NORMAL 5 1
P VALUE - 0.015 KRUSKAL WALLIS TEST
SIGNIFICANT
60
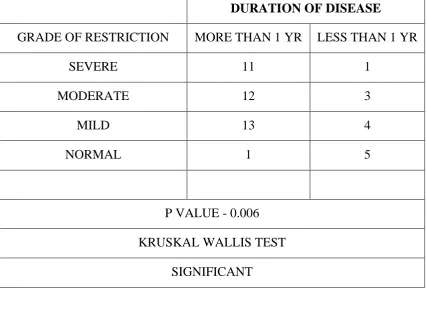
Table 25: ASSOCIATION BETWEEN DURATION OF DISEASE AND
RESTRICTION
DURATION OF DISEASE
GRADE OF RESTRICTION MORE THAN 1 YR LESS THAN 1 YR
SEVERE 11 1
MODERATE 12 3
MILD 13 4
NORMAL 1 5
P VALUE - 0.006 KRUSKAL WALLIS TEST
SIGNIFICANT
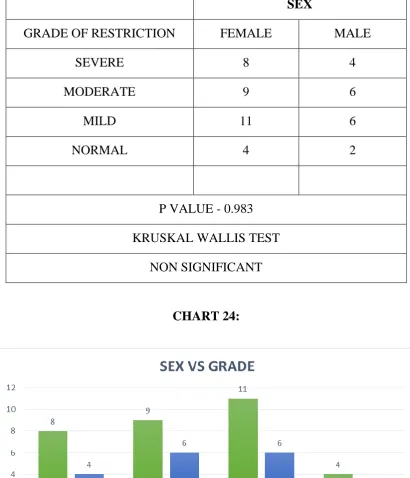
61
Table 26: ASSOCIATION BETWEEN SEX AND RESTRICTION
SEX
GRADE OF RESTRICTION FEMALE MALE
SEVERE 8 4
MODERATE 9 6
MILD 11 6
NORMAL 4 2
P VALUE - 0.983 KRUSKAL WALLIS TEST
NON SIGNIFICANT
62
Table 27: SERUM T3 AND PFT
SERUM T3
PFT < 0.3 0.3 TO 0.4 0.4 TO 0.5
RESTRICTIVE PATTERN 11 18 15
NORMAL 0 0 6
P VALUE - 0.009 SIGNIFICANT KRUSKAL WALLIS TEST
63
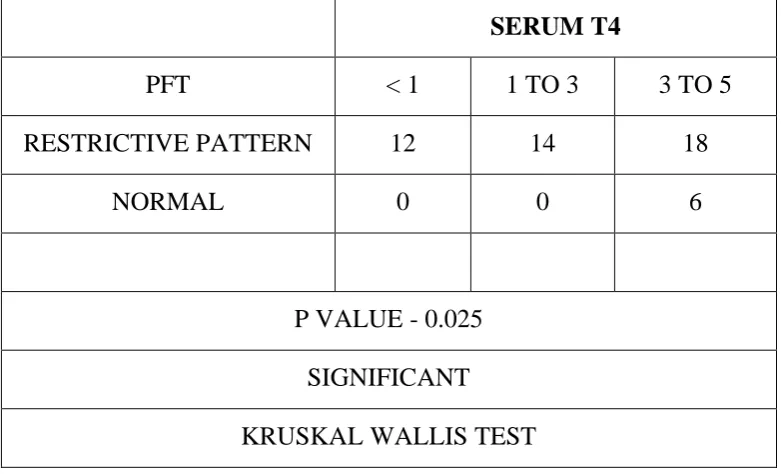
Table 28: SERUM T4 AND PFT
SERUM T4
PFT < 1 1 TO 3 3 TO 5
RESTRICTIVE PATTERN 12 14 18
NORMAL 0 0 6
P VALUE - 0.025 SIGNIFICANT KRUSKAL WALLIS TEST
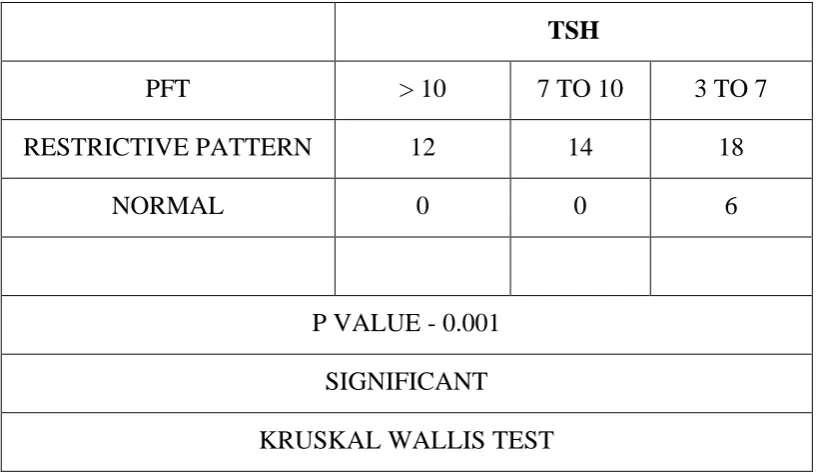
64
Table 29: SERUM TSH AND PFT
TSH
PFT > 10 7 TO 10 3 TO 7
RESTRICTIVE PATTERN 12 14 18
NORMAL 0 0 6
P VALUE - 0.001 SIGNIFICANT KRUSKAL WALLIS TEST
65
Table 30: RELATION BETWEEN PFT AND SERUM T3
SERUM T3
PFT MEAN SD
RESTRICTIVE PATTERN 0.35 0.09
NORMAL 0.47 0.01
P VALUE - 0.004 SIGNIFICANT UNPAIRED T TEST
66
Table 31: RELATION BETWEEN PFT AND SERUM T4
SERUM T4
PFT MEAN SD
RESTRICTIVE PATTERN 2.42 1.46
NORMAL 4.28 0.42
P VALUE - 0.002 SIGNIFICANT UNPAIRED T TEST
67
Table 32: RELATION BETWEEN PFT AND SERUM TSH
SERUM TSH
PFT MEAN SD
RESTRICTIVE PATTERN 10.14 6.7
NORMAL 4.6 0.65
P VALUE - 0.047 SIGNIFICANT UNPAIRED T TEST
68
Table 33: PFT AND FOLLOW UP
FOLLOW UP
PFT YES NO
RESTRICTIVE PATTERN 9 35
NORMAL 5 1
P VALUE - 0.001 CHI SQUARE TEST
SIGNIFICANT
69
Table 34: PFT AND DURATION OF DISEASE
DURATION OF DISEASE
PFT MORE THAN 1 YR LESS THAN 1 YR
RESTRICTIVE PATTERN 36 8
NORMAL 1 5
P VALUE - 0.001 CHI SQUARE TEST
SIGNIFICANT
70
Table 35: PFT AND SEX DISTRIBUTION
SEX
PFT FEMALE MALE
RESTRICTIVE PATTERN 16 28
NORMAL 2 4
P VALUE - 0.885 CHI SQUARE TEST NON SIGNIFICANT
71
Table 36: FVC AND SERUMT3
FVC %
SERUM T3 MEAN SD
< 0.3 59 7.2
0.3 - 0.4 68 6.2
0.4 - 0.5 82 16.7
P VALUE - 0.001 ANOVA SIGNIFICANT
72
[image:102.595.113.520.144.413.2]
Table 37: FEV AND SERUM T3
FEV%
SERUM T3 MEAN SD
< 0.3 68.9 4.3
0.3 - 0.4 66.2 3.6
0.4 - 0.5 70.5 7.6
P VALUE - 0.077 ANOVA NON SIGNIFICANT
73
Table 38: FEV/FVC AND SERUM T3
FEV/FVC
SERUM T3 MEAN SD
< 0.3 117.5 13.6
0.3 - 0.4 96.9 10.6
0.4 - 0.5 86.8 11.05
P VALUE - 0.001 ANOVA SIGNIFICANT
74
Table 39: PEFR AND SERUM T3
PEFR
SERUM T3 MEAN SD
< 0.3 78.91 6.02
0.3 - 0.4 80.11 5.5
0.4 - 0.5 84.43 7.6
P VALUE - 0.097 ANOVA NON SIGNIFICANT
75
Table 40: FEF 25-75% AND SERUM T3
FEF 25-75%
SERUM T3 MEAN SD
< 0.3 59.73 6.3
0.3 - 0.4 61.7 3.9
0.4 - 0.5 63.9 10.5
P VALUE - 0.351 ANOVA NON SIGNIFICANT
76
Table 41: FVC AND SERUM T4
FVC %
SERUM T4 MEAN SD
<1 58.9 6.3
1 TO 3 68.29 5.35
3 TO 7 81.46 16.17
P VALUE - 0.001 ANOVA SIGNIFICANT
77
Table 42: FEV AND SERUM T4
FEV%
SERUM T4 MEAN SD
<1 69.25 4.1
1 TO 3 65.86 3.7
3 TO 7 69.92 7.3
P VALUE - 0.118 ANOVA NON SIGNIFICANT
78
Table 43: FEV/FVC AND SERUM T4
FEV/FVC
SERUM T4 MEAN SD
<1 118.17 13
1 TO 3 96.36 7.4
3 TO 7 87.21 10.9
P VALUE - 0.001 ANOVA SIGNIFICANT
79
Table 44: PEFR AND SERUM T4
PEFR
SERUM T4 MEAN SD
<1 79 5.6
1 TO 3 79.57 6.7
3 TO 7 84.17 9.7
P VALUE - 0.094 ANOVA NON SIGNIFICANT
80
Table 45: FEF 25-75% AND SERUM T4
FEF 25-75%
SERUM T4 MEAN SD
<1 59.67 5.9
1 TO 3 61.43 4.1
3 TO 7 63.96 9.9
P VALUE - 0.279 ANOVA NON SIGNIFICANT
81
Table 46: FVC AND SERUM TSH
FVC %
SERUM TSH MEAN SD
>10 59.17 7.5
7 TO 10 66.29 4.9
3 TO 7 82.5 15.4
P VALUE - 0.001 ANOVA SIGNIFICANT
82
Table 47: FEV AND SERUM TSH
FEV%
SERUM TSH MEAN SD
>10 64.43 4.1
7 TO 10 69.42 2.9
3 TO 7 70.67 6.9
P VALUE - 0.005 ANOVA SIGNIFICANT
83
Table 48: FEV/FVC AND SERUM TSH
FEV/FVC
SERUM TSH MEAN SD
>10 118 13.26
7 TO 10 97 7.8
3 TO 7 86 10.3
P VALUE - 0.001 ANOVA SIGNIFICANT
84
Table 49: PEFR AND SERUM TSH
PEFR
SERUM TSH MEAN SD
>10 76.64 7.8
7 TO 10 78.64 5.9
3 TO 7 84.54 8.8
P VALUE - 0.041 ANOVA SIGNIFICANT
85
Table 50: FEF 25-75% AND SERUM TSH
FEF 25-75%
SERUM TSH MEAN SD
>10 59.2 6.7
7 TO 10 60.1 4.2
3 TO 7 64.25 3.5
P VALUE - 0.088 ANOVA NON SIGNIFICANT
86
Table 51: CORRELATION BETWEEN VARIOUS VARIABLES
CORRELATION FVC FEV1 FEV1/
FVC PEFR
FEF
25-75% Severity PFT
SERUM T3
Pearson
Correlation .687
**
.271 -.713** .386** .325* .779** .423**
Sig.
(2-tailed) .000 .049 .000 .006 .021 .000 .002
SERUM T4
Pearson
Correlation .683
**
.164 -.774** .297* .273 .809** .404**
Sig.
(2-tailed) .000 .256 .000 .036 .055 .000 .004
SERUM TSH
Pearson
Correlation -.628
**
-.055 .811** -.313* -.261 -.781** -.283*
Sig.
(2-tailed) .000 .704 .000 .027 .067 .000 .047
FOLLOW UP
Pearson
Correlation -.354
*
-.251 .245 -.335* -.309* -.332* -.455**
Sig.
(2-tailed) .012 .079 .086 .017 .029 .019 .001
DURATION OF DISEASE
Pearson
Correlation .403
**
.246 -.309* .312* .306* .403** .483**
Sig.
87
DISCUSSION
Hypothyroidism can have numerous effects on the respiratory system. Nevertheless, it does affect the respiratory system including respiratory muscle weakness, alveolar hypoventilation due to decreased hypoxic and hypercapnic ventilator drives, upper airway obstruction, central and obstructive sleep apnoea and even pleural effusion. Lung volumes are usually normal or mildly reduced, but maximal breathing capacity and diffusing capacity are usually reduced.
FVC & FEV1 Values were found to be lower in hypothyroids. But it was significant only for FVC. The FEV1/FVC value is significantly increased among hypothyroid patients.
The degree and duration of thyroid disorders lead to reduced ventilator lung function in patients with hypothyroidism.
88
SUMMARY
1. The present study is a cross sectional study which analyzed the association between hypothyroidism and pulmonary function tests.
2. The study was conducted during a period of one year from July 2016 to June 2017.
3. There were 18 Males and 32 Females.
4. There is a positive correlation between duration of disease and grade of restriction.
5. There is significant difference in lung functions between those subjects not on follow up, treatment and those on Thyroid replacement therapy.
6. There is negative correlation between serum T3 and grade of restriction.
7. There is negative correlation between serumT4 and grade of restriction.
8. There is positive correlation between serum TSH and grade of restriction.
89
CONCLUSION
The presence of impaired pulmonary function tests in hypothyroidism has been already demonstrated in various studies. There is significant reduction in the dynamic lung functions of hypothyroid patients. Respiratory system can be affected in hypothyroidism.
90
BIBLIOGRAPHY
1. Dashe JS & Cunningham FG. Subclinical hypothyroidism. NEngl J Med2001; Dec 20, 345, 25, 1855
2. Kek PC, Ho SC&Khoo DH. Subclinical thyroid disease. Singapore Med J, 2003 ;44, 11 595-600
3. Braverman LE, Utiger RD. Introduction to hypothyroidism. In: Braverman LE, Utiger RD, Werner SC, IngbarSH, editors. The thyroid: Afundamental and clinical text. 9th Ed. Philadelphia: Lippincott Williams and Wilkins; 2005. p.697-9
4. Mcquade C, Skugor M, Brennan DM, Hoar B, Stevenson C,Hoogwerf BJ. Hypothyroidism and moderate subclinical hypothyroidism are associated with increased all-cause mortality independent of coronary heart disease risk factors: A PreCIS Database Study. Thyroid 2011;21(8):837–43
5. Resta O, Pannacciulli N, Di Gioia G, Stefano A, Barbaro MP, DePergola G. High prevalence of previously unknown subclinical hypothyroidism in obese patients referred to a sleep clinic for sleep disordered breathing. Nutr Meta Cardiovasc Dis2004;14:248–53
91
7. Siafakas NM, Salesiotou V, Filaditaki V, Tzanakis N, Thalassinos N, Bouros D. Respiratory muscle strength in hypothyroidism. Chest 1992; 102:189–194.
8. Brent GA, Davies T. Hypothyroidism and Thyroiditis. In: Melmed S, Polonsky KS, Larsen PR, Kronenberg HM, Editors. Williams Text book of Endocrinology. 12th ed. Philadelphia WB. Saunders Co, 2011. p.409
9. Duranti R, Gheri RG, Gorini M, etal. Control of breathing in patients with severe hypothyroidism. Am J Med 1988; 84: 877-883
10.Warren M. Gold M. Pulmonary Function Tests. In: Murray JF, Nadel JA, Editors. Textbook of Respiratory Medicine. 3rd ed. Philadelphia: WB. Saunders Co; 2000. p.781–5.
11.Rolleston, H., The endocrine organs in health and disease. 1936, London: Oxford University Press.
12.King, T., Observations on the thyroid gland. Guy‟s Hosp Rep, 1836. 1:429
13.Jameson JL, Weetman.A.P., Chapter 341. Disorders of the Thyroid Gland, in Harrison‟s Principles of Internal Medicine, 18th Ed. 2012.
14.De Felice M, Di Lauro R. Minireview: Intrinsic and extrinsic factors in thyroid gland development: an update. Endocrinology 2011;152 (8):2948-56.
92
16.Organ GM, Organ CH Jr. Thyroid gland and surgery of the thyroglossal duct: exercise in applied embryology. World J Surg 2000; 24(8):886-90.
17.Thyroid gland. In: Williams PL, Bannister LH, et al. Gray‟s Anatomy. 38th Ed. New York, NY: Churchill Livingstone; 1995:1891-6.
18.Cummings CW, et al. Thyroid anatomy. In: Cummings CW, ed. Otolatyngology – Head and Neck Surgery. 3rd ed. St. Louis, Mo: Mosby; 1998:2445-49.
19.Fawcett, Don; Jensh, Ronald 2002. Bloom & Fawcett‟s Concisse Histology. New York: Arnold Publishers. pp. 257-258.
20.Domenico Salvatore et al. Thyroid Physiology and Diagnostic Evaluation of Patients with Thyroid Disorders. William‟s textbook of
endocrinology 12th edition 2011.
21.Nussey S and Whitehead S. The thyroid gland in Endocrinology: An Integrated Approach 2001. BIOS Scientific Publishers Ltd.
22.Ganong WF. Chapter 18. The thyroid gland in Review of Medical Physiology 20th Ed. 2001
23.Ekholm R, Bjorkman U (1997). “Glutathione peroxidase degrades intracellular hydrogen peroxide and thereby inhibits intracellular protein iodination in thyroid epithelium.” Endocrinology 138 (7): 2871-2878.
93
25.Boron WF, Boulpaep E. “Chapter 48: “synthesis of thyroid hormones”. Medical Physiology: A Cellular And Molecular Approach. 2003.
26.Bianco AC, Salvatore D, Gereben B, Berry MJ, Larsen PR. “Biochemistry, cellular and molecular biology, and physiological roles of the iodothyronine selenodeiodinases”. Endocr Rev 2002; 23 (1):
38-89.
27.Flamant F, Baxter JD, Forrest D, Refetoff S, S0amuels H, Scanlan TS, Vennstrom B, Samarut J. “International Union of Pharmacology0. LIX. The pharmacology and classification of the nuclear receptor superfamily: thyroid hormone receptors”. Pharmacol Rev 2006; 58 (4): 705-11.
28.Harvey CB, Williams GR. “Mechanism of thyroid hormone action”. Thyroid 2002; 12(6):441-6.
29.Farid NR, Szkudlinski MW. “Minireview: structural and functional evolution of the thyrotropin receptor”. Endocrinology 2004; 145 (9):4048-57.
30.American Thyroid Association. ATA hypothyroidism booklet.
94
32.Kim MS, Small CJ, Stanley SA et al. The central melanocortin system affects the hypothalamo-pituitary thyroid axis and may mediate the effect of leptin. Journal of Clinical Investigation 2000: 105: 1005-1011.
33.Lechan, Ronald M.; Fekete, C. “Feedback regulation of thyrotropin-releasing hormone (TRH): mechanisms for the non-thyroidal illness syndrome.” Journal of endocrinological investigation 2004; 27 (6
Suppl): 105-19.
34.McPhee, Papadakis. Current Medical Diagnosis & Treatment 2010. Lange McGraw Hill Publishers.
35.CHUPP GL (ed): Pulmonary function testing. Clin Chest Med 22:599, 2001.
36.PELLEGRINO R et al: Interpretative strategies for lung function tests. Eur Respir J 26:948, 2005.
37.SCHWARTZSTEIN RM, PARKER MJ: Respiratory Physiology: A Clinical Approach. Philadelphia, Lippincott Williams & Wilkins, 2006.
95
ANNEXURE-1
PROFORMA
NAME AGE
OCCUPATION SEX
SOCIO ECONOMIC
STATUS IP NO
ADDRESS
CHIEF COMPLAINTS PRESENT HISTORY
1. HOARSENESS OF VOICE
2. COLD
INTOLERANCE 3. CONSTIPATION 4. SWELLING OF
EXTREMITIES 5. WEIGHT GAIN 6. INFERTILITY 7. COUGH 8. CHEST PAIN 9. WHEEZE 10.DYSPNEA
Yes/no
Duration Other
features PAST HISTORY 1. SHT DM 2. CAD 3. TB 4. EPILEPSY/CVA 5. LIVER DISEASES 6. COPD
Duration Treatment
PERSONAL HISTORY
1. ALCOHOL
CONSUMPTION- 2. SMOKING
3. DIET
4. DRUG INTAKE
96 GENERAL EXAMINATION BP PR SPO2 TEMP RR CONSCIOUS LEVEL- PALLOR ICTERUS- DYSPNEA- PEDAL EDEMA- SYSTEM EXAMINATION CVS RS ABD CNS BASE LINE
INVESTIGATIONS- CBC RFT LFT SPECIAL BLOOD
INVESTIGATIONS
SERUMT3 SERUMT4 SERUM
TSH
RADIOLOGICAL INVESTIGATIONS
CHEST X-RAY
LUNG FUNCTION TESTS FEV1 FVC FEV1/FVC
PEFR FEF25-75%
RESTRICTION GRADE- OTHER FINDINGS FINAL DIAGNOSIS