Faculty of Engineering & Surveying
Spark Ignition Internal Combustion Engine Efficiency
Improvement - a Variable Compression Ratio Option
A thesis submitted by
Ray Malpress
in fulfilment of the requirements of
Doctor of Philosophy
Abstract
Associated Publications
The following publications were produced during the period of candidature:
Malpress, R. and D.R. Buttsworth, ‘Air motor for improved engine brake efficiency: design and preliminary experiments’, in 3rd International Conference on Energy and Environment 2009: Advancement Towards Global Sustainability (ICEE 2009). 2009, IEEE: Malacca, Malaysia.
Malpress, R. and D. Buttsworth. ‘A comparison of two-position variable compression ratio with continuously variable compression ratio using numerical simulation’ in Amer-ican Society of Mechanical Engineers, 2009 Internal Combustion Engine Division, Fall
Technical Conference. 2009. Lucerne, Switzerland: American Society of Mechanical Engineering.
Malpress, R. and D. Buttsworth. ‘Assessment of an eccentric link in the connecting rod of a spark ignition engine intended for variable compression ratio operation’ in6th Australasian Congress on Applied Mechanics, ACAM 6. 2010. Perth, Australia.
Malpress, R. and D. Buttsworth. ‘Internal combustion engines: a role to fill for trans-port in an energy conscious environment’ in 2010 Southern Region Engineering Con-ference (SREC 2010), 2010, Toowoomba, Australia
Certification of Dissertation
I certify that the ideas, designs and experimental work, results, analyses and conclusions set out in this dissertation are entirely my own effort, except where otherwise indicated and acknowledged.
I further certify that the work is original and has not been previously submitted for assessment in any other course or institution, except where specifically stated.
Ray Malpress
0038170152
Signature of Candidate
Date
ENDORSEMENT
Signature of Supervisor/s
Acknowledgments
I acknowledge the contribution of academic and technical staff of the University of Southern Queensland for their contributions to the work resulting in this dissertation.
I would like to especially thank my principle supervisor Professor David Buttsworth for his technical assistance and strategic advice over the duration of my PhD. My Associate supervisor, Dr Selvan Pather made a significant contribution via his grounding advice, especially early in the candidature.
Work colleagues Dr Alexander Kist, Dr Tony Ahfock and Dr Les Bowtell supplied timely technical advice that undoubtedly reduced the time I required to complete several tasks.
Mr Charlie Weeding ofDC Racing contributed technical advice and machining services for the manufacturer of some of the experimental engine components.
Lastly, I would like to thank my partner, Maree Luck, for her proof reading skills and advice for managing difficult situations during my candidature and of course for her encouragement and support.
Ray Malpress
Contents
Abstract i
Associated Publications iii
Acknowledgments v
List of Figures xv
List of Tables xxiii
Acronyms & Abbreviations xxvi
Chapter 1 Introduction 1
1.1 Objectives . . . 2
1.2 Methods . . . 3
1.3 Dissertation Overview . . . 4
1.3.1 Chapter 2, Analysis of Efficiency Improvement Options . . . 5
CONTENTS vii 1.3.3 Chapter 4, VCR technology, Review, Modelling and New Directions 6
1.3.4 Chapter 5, Two-Position CR Compared with Continuously
Vari-able CR . . . 8
1.3.5 Chapter 6, Eccentric Bush for VCR . . . 9
1.3.6 Chapter 7, Transient Loading of Hydraulic Cylinder without Seals 10 1.3.7 Chapter 8, Hydraulic Connecting Rod . . . 10
1.3.8 Chapter 9, Conclusions and Further Work . . . 11
Chapter 2 Analysis of Passenger Vehicle Options Compelling Internal Combustion Engine Efficiency Improvement 12 2.1 Introduction . . . 12
2.2 Internal Combustion Engine Characteristics and Attributes . . . 13
2.3 Personal Transport Options - Consumers Have Extensive Choice . . . . 15
2.3.1 Introduction . . . 15
2.3.2 Role of Life Cycle Assessment . . . 16
2.4 Effect Of Propulsion Type On Vehicle Consumer Appeal . . . 17
2.4.1 Electric vehicle intrinsic drawbacks . . . 17
2.4.2 Alternative electrical storage systems . . . 18
2.4.3 Electric hybrids - a more usable concept . . . 19
2.4.4 Alternative energy storage technologies . . . 20
2.4.6 Conclusion . . . 22
2.5 Direct Energy Conversion Efficiency At The Vehicle . . . 23
2.5.1 Introduction . . . 23
2.5.2 Spark Ignition ICE . . . 23
2.5.3 Compression Ignition ICE . . . 24
2.5.4 Electric hybrid . . . 25
2.5.5 Battery electric vehicles . . . 25
2.5.6 ICE efficiency for on board energy conversion . . . 27
2.5.7 Conclusion . . . 28
2.6 Life Cycle Assessment of ICE Powered Vehicles, HEVs And BEVs . . . 28
2.7 Variable Compression For Fuel Consumption Improvement . . . 29
2.8 Vehicle Energy Sources . . . 31
2.8.1 Introduction . . . 31
2.8.2 Electrical energy sources . . . 31
2.8.3 ICE powered vehicles can directly use renewable/alternative fuels 32 2.9 Conclusions . . . 33
Chapter 3 Induction Air Motor for Improved Engine Brake Efficiency 34 3.1 Introduction - Throttling Losses . . . 34
3.2 Background on Design of Motor . . . 35
CONTENTS ix
3.3 Prototype Design Based on Preliminary Modelling . . . 40
3.4 Simulation for IAM/Engine Combination . . . 47
3.5 IAM Prototype Design and Build . . . 48
3.5.1 Blow-by analysis . . . 49
3.5.2 Material Selection . . . 51
3.5.3 Prototype Refinement . . . 51
3.6 Model of IAM Performance . . . 54
3.7 Experiment and IAM Performance . . . 58
3.7.1 Experimental Results . . . 58
3.8 IAM Experiment and Model Correlation . . . 64
3.9 IAM Performance Explained . . . 72
3.10 Conclusion . . . 73
Chapter 4 VCR Technology: Review, Modelling and New Directions 75 4.1 Introduction . . . 75
4.2 Review of VCR . . . 76
4.3 Use of Engine Simulation Models in VCR Analyses . . . 80
4.4 The Engine Simulation Models . . . 81
4.5 Identifying Attributes for VCR Devices . . . 86
Chapter 5 A Comparison of Two-Position CR with a Continuously
Vari-able CR Using Numerical Simulation 92
5.1 Introduction . . . 92
5.2 Validating the Model . . . 93
5.3 Selecting Model Parameters for the VCR Configuration . . . 95
5.4 Fuel Efficiency Assessed Using Vehicle Driving Cycle . . . 98
5.5 Selection of the LVCR . . . 101
5.6 Defining Load Paths for Use in the Model . . . 102
5.7 Vehicle Loads Determined from Coast-Down Test . . . 103
5.8 The Net Fuel Consumption Simulation . . . 105
5.9 Modelled Vehicle Fuel Consumption for NEDC . . . 106
5.10 Results: Comparison of Two-Position with Continuously VCR . . . 107
5.11 Conclusions . . . 108
Chapter 6 Eccentric Bush for VCR 111 6.1 Introduction . . . 111
6.2 Modelling . . . 112
6.2.1 Background . . . 112
6.2.2 Free Body Analysis . . . 112
6.2.3 Implementing the Model in Matlab . . . 116
CONTENTS xi
6.3 Prototype Experiment . . . 120
6.3.1 Prototype Physical Characteristics . . . 124
6.3.2 Measurement of Eccentric Motion using High Speed Video . . . . 129
6.4 Experimental Results and Comparison with Simulation . . . 131
6.4.1 Simulation Improved by Correlation with Experimental Results . 131 6.4.2 Enhanced Simulation . . . 139
6.5 Simulation for Predicting Prototype Motion . . . 146
6.6 Assessment of the Viability of the Eccentric VCR Device . . . 151
Chapter 7 Transient Energy Storage and Recovery Using Oil Under Impact Loading 154 7.1 Introduction . . . 154
7.2 Apparatus . . . 156
7.3 Experimental Approach . . . 159
7.4 Results of the Experiment . . . 162
7.4.1 Test Results . . . 162
7.4.2 Analysis of Cap Shape . . . 166
7.4.3 Analysis of the Effect of Reduced Oil Volume . . . 167
7.4.4 Energy Transfers During the Rebound Event Estimated from Consecutive Drops Test . . . 167
7.5.1 Overview of Analysis . . . 168
7.5.2 Oil Temperature Rise . . . 169
7.5.3 Oil Leakage, Viscous Friction and Thermal Energy loss . . . 174
7.5.4 Shaft Motion Losses . . . 176
7.5.5 Plastic Deformation of the Steel Weight . . . 178
7.5.6 Summary of Distribution of Energy Transfers for the Rebound Event . . . 180
7.6 Discussion and Validation of Simulations . . . 182
7.6.1 Idealised Model . . . 182
7.6.2 Viscous Friction Between Shaft and End Cap . . . 182
7.6.3 Bulk modulus varies with pressure . . . 183
7.6.4 Viscous Drag on Immersed End of Shaft . . . 184
7.6.5 Validation of Model: Discussion . . . 185
7.6.6 Further Validation of Model Performance . . . 186
7.7 Conclusions . . . 188
Chapter 8 Hydraulic Variable Compression Ratio Connecting Rod 189 8.1 Introduction . . . 189
8.2 Hydraulic Connecting Rod Design . . . 190
8.2.1 Introduction . . . 190
CONTENTS xiii
8.2.3 Fixings Considerations . . . 193
8.2.4 Fabrication Considerations . . . 197
8.2.5 Material Selection . . . 197
8.2.6 Control of the Length of the Hydraulic Rod . . . 198
8.3 Hydraulic Rod Fabrication . . . 201
8.4 Hydraulic Rod Prototype Experiment and Analysis . . . 204
8.4.1 Bench Experiment . . . 204
8.4.2 Prototype Experiment Setup . . . 205
8.4.3 Initial Experiment . . . 210
8.4.4 Experiments without Engine Pressure . . . 212
8.4.5 Analysis of High Speed Camera Images . . . 215
8.4.6 Experiments for the Compressing Engine . . . 217
8.4.7 Reproducibility - Wear, Oil Temperature and Speed Effects . . . 225
8.5 Model to Simulate Rod Length Change . . . 232
8.5.1 Description of Model . . . 232
8.5.2 Model Tuning . . . 235
8.5.3 Oil Shear Stress Contributes to Journal Bearing Temperature . . 242
8.6 Simulation Results and Predicted Motion under Firing Pressure . . . 243
8.7 Discussion and Conclusions . . . 247
9.1 Piston-Rod-Crank Dominance . . . 249
9.2 ICE System Variations to Improve Efficiency . . . 251
9.3 Piston-Rod-Crank Variations to Improve Efficiency . . . 252
9.4 Further Work . . . 253
9.4.1 IAM . . . 253
9.4.2 VCR Hydraulic Rod . . . 253
References 255
Appendix A Definition of LVCR and Associated Factors 265
Appendix B Related VCR Literature 267
Appendix C Derivation of the Eccentric Angular Acceleration 274
Appendix D Derivation of the 2nd Derivative of the Length of the
Hy-draulic Connection Rod 285
List of Figures
2.1 Typical SI engine efficiency map (Adapted from Stone (1999)) . . . 24
2.2 Modelled operating efficiencies for a two position VCR engine . . . 30
3.1 Modelled engine brake power and throttling losses . . . 35
3.2 Solid model of an early design concept for an Induction Air Motor (IAM) 39 3.3 View of the solid model of an early design concept showing the complex-ity design . . . 40
3.4 Solid model of Induction Air Motor (IAM) prototype . . . 41
3.5 Idealised cycle analysis of the IAM. . . 42
3.6 IAM chamber volume diagram . . . 46
3.7 IAM chamber volume diagram for alternative port timing . . . 47
3.8 ESM output showing plots of engine efficiency versus engine BMEP for various parameter inputs . . . 48
3.9 Exploded view of IAM prototype vane assembly . . . 49
3.10 Hub stiffening plates in prototype modification . . . 53
3.12 Installed vane showing offset contact with drum. . . 60
3.13 Raw data from the pressure transducer for one revolution (six chambers) of the prototype IAM . . . 67
3.14 Raw data from the pressure transducer of six consecutive revolutions of the IAM prototype . . . 68
3.15 Filtered Data from the pressure transducer of six consecutive revolutions of the IAM prototype . . . 69
3.16 Filtered data from the pressure transducer of six consecutive revolutions of the IAM prototype showing only the last chamber . . . 70
3.17 Correlation between modelled pressure and experimentally measured pressure for the IAM prototype . . . 71
4.1 Surface map of the ignition timing used in the efficiency map model . . 83
4.2 Surface map of the equivalence ratio used in the efficiency map model . 84
4.3 Comparison of published and modelled effciency map . . . 84
4.4 Engine pressure output from Engine Simulation Model using original parameters . . . 85
4.5 Engine pressure output from Engine Simulation Model for late valve closing and atmospheric induction pressure . . . 85
4.6 Comparison of efficiency map for the reduced induction stroke volume, LVCR= 0.6 and the modelled full induction stroke . . . 86
4.7 Image of a typical VCR device (Source: United States Patent 6779495) 87
LIST OF FIGURES xvii
5.2 Typical SI engine efficiency map . . . 95
5.3 Comparison of efficiency map for LVCR of 0.6 and 0.7 . . . 97
5.4 Modelled comparison of efficiency map for LVCR of 0.7 using different ignition timing and burn rates . . . 98
5.5 Surface plot of CVT efficiency employed in the driving cycle modelling 99 5.6 Vehicle speeds used in the NEDC . . . 100
5.7 Alternative Load paths defined for transition through the reduced com-pression stroke maximum power limit . . . 104
5.8 Engine efficiency versus power for three load paths . . . 104
5.9 Cruise drive force and power derived from coast down test - Toyota Camry (1998) . . . 105
5.10 Optimum efficiency at engine power for continuously variable CR . . . . 107
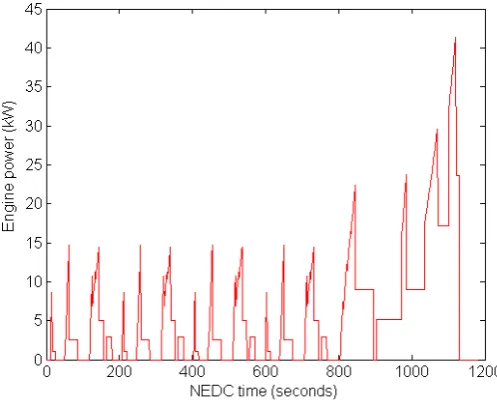
5.11 Modelled engine power over the NEDC . . . 108
6.1 Schematic of crank-eccentric-rod-piston arrangement . . . 113
6.2 Free body diagram of eccentric link for dynamics analysis . . . 115
6.3 Stribeck Diagram . . . 117
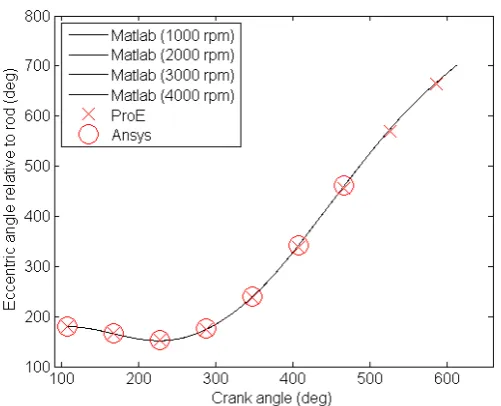
6.4 Eccentric motion plot comparing the model implemented in Matlab with ProE and Ansys . . . 119
6.5 Eccentric motion plot comparing the model implemented in Matlab with ProE using friction . . . 120
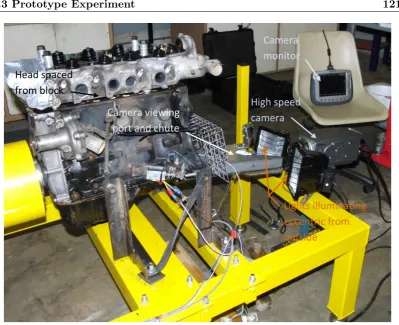
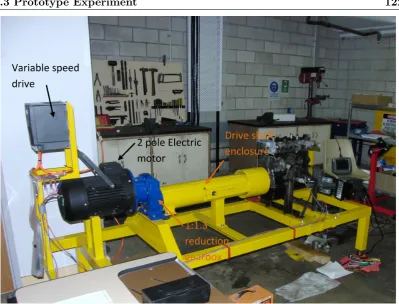
6.6 The prototype eccentric bush experimental setup . . . 121
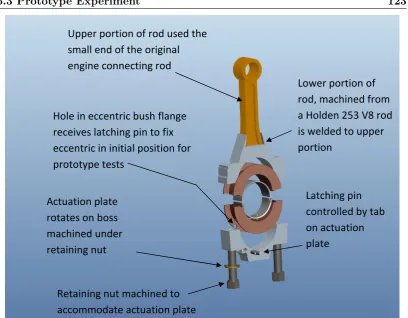
6.8 The prototype eccentric bush and rod assemble - ProE model exploded view . . . 123
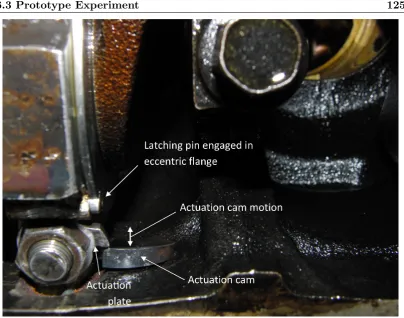
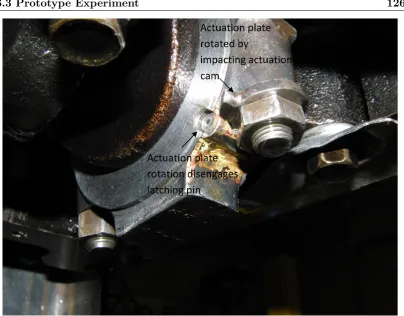
6.9 Photograph of the prototype eccentric release actuation mechanism . . . 125
6.10 Photograph of the prototype eccentric actuation pin - disengaged . . . . 126
6.11 Photograph of the external solenoid activated release mechanism . . . . 126
6.12 Photograph of the prototype eccentric measuring scale . . . 129
6.13 Matlab ‘image’ of prototype eccentric showing measuring technique . . . 130
6.14 Montage of video frames of prototype eccentric showing relative motion of the eccentric . . . 131
6.15 Comparison of experimental results for 500, 1000 and 1500 rpm . . . 132
6.16 Eccentric motion at 500 rpm, experiment and simulation output . . . . 133
6.17 Eccentric motion at 500 rpm, experiment and simulation output, late release investigation . . . 135
6.18 Friction variables, eccentric to crankshaft surfaces at 500 rpm and 60oC 136
6.19 Friction variables, eccentric to connecting rod surfaces at 500 rpm and 60oC . . . 137
6.20 Eccentric motion at 1000 rpm, experiment and simulation basic model parameters . . . 138
6.21 Eccentric motion at 1000 rpm, experiment and simulation basic model parameters - sensitive to temperature . . . 139
6.22 Modified Stribeck diagram . . . 141
LIST OF FIGURES xix 6.24 Eccentric motion at 1000 rpm, Experiment and Simulation output with
modified Stribeck friction . . . 143
6.25 Friction variable eccentric-to-rod bearing surfaces at 1000 rpm and 55oC 143 6.26 Friction variable crank-to-eccentric bearing surfaces, 1000 rpm and 56oC 144 6.27 Eccentric motion at 1500 rpm, experiment and simulation output with modified Stribeck friction . . . 145
6.28 Eccentric motion at 1500 rpm, experiment and simulation output with modified Stribeck friction . . . 146
6.29 Simulated motion for eccentric rod initially long, 1000 rpm . . . 148
6.30 Engine pressure for the VCR switch from high CR to low CR, 2000 rpm 149 6.31 Eccentric motion with and without engine pressure at 2000 rpm . . . 150
6.32 Eccentric motion without engine pressure at 1000 rpm with rod initially short . . . 151
7.1 CAD drawing of the drop guide . . . 157
7.2 Photo (frame from video) of the drop guide . . . 157
7.3 Solid model of hydraulic cylinder . . . 158
7.4 Solid models of hydraulic cylinder caps . . . 160
7.5 Solid model of slide for measuring shaft displacement . . . 161
7.6 Schematic of elements used in heat transfer analysis . . . 171
7.7 CAD drawing of the deformed portion of the weight . . . 179
7.9 Simulated Shaft displacement over time . . . 186
7.10 Variation of maximum shaft displacement with weight drop height: com-parison of experimental data and simulation . . . 187
8.1 Solid model of the hydraulic rod design . . . 194
8.2 Exploded view of the floating bush . . . 195
8.3 Ansys simulation of pressure generated deflection in the rod body . . . . 196
8.4 One way valve detail in the floating bush . . . 199
8.5 Hydraulic rod control lever detail . . . 200
8.6 Photograph of the rod, control lever and control cam installed in the engine . . . 201
8.7 Photograph of control solenoids . . . 202
8.8 Photograph of camera periscope . . . 206
8.9 Image as seen by the periscope . . . 207
8.10 Photographs of lighting and viewing ports for the high speed camera . 208 8.11 Experimental set up for the prototype . . . 209
8.12 photograph of combustion chamber insert to increase engine compression pressure . . . 210
8.13 Photograph of engine decompression device . . . 211
8.14 Plot of oil temperature dependant motion for the hydraulic rod at two speeds . . . 217
LIST OF FIGURES xxi 8.16 Detail of the portion of the rod visible in the high speed video used to
generate the images of the montage . . . 218
8.17 Plot of the number of revolutions required to complete the change in length of the hydraulic rod operating while the engine is compressing . . 221
8.18 Plot of the full pressure data range for test 55 of table 8.6 . . . 222
8.19 Plot of the selected pressure data range for test 35 of table 8.6 used to calculate the ensemble averaged pressure . . . 223
8.20 Ensemble averaged pressure for test 55 of table 8.6 . . . 224
8.21 Pressure trace during the rod length-change from test 55 of Table 8.6 . . 225
8.22 Pressure trace for test 66 of Table 8.6 . . . 226
8.23 Pressure trace for test 20 of Table 8.4 . . . 227
8.24 Pressure trace for stepped reduction in speed for flow through 6 mm intake orifice . . . 231
8.25 Diagram used for analysis of the the motion of the hydraulic rod . . . . 233
8.26 Simulation results using the initial estimates of parameter settings . . . 237
8.27 Simulation results after tuning of damping coefficient . . . 239
8.28 Effective oil temperature in the rod chambers . . . 243
8.29 Simulation results using revised oil temperatures for viscosity . . . 244
8.30 Simulation results for the prototype rod parameters when a motored engine pressure is applied . . . 245
8.32 Simulation results for the prototype rod parameters when a fired engine pressure is applied . . . 247
8.33 Simulation results for the prototype rod parameters when a fired engine pressure is applied, reduced clearance between rod and floating bush . . 248
List of Tables
3.1 Initial model analysis results for IAM thermodynamic cycle analysis . . 45
3.2 Original design material selection. . . 51
3.3 Manufacturing constrained material selection changes. . . 52
3.4 Data set 1: IAM experimental data for the late intake port opening configuration . . . 61
3.5 Data set 1: IAM experimental data for the late intake port opening configuration. . . 62
3.6 Data set 2: IAM experimental data for the late intake port opening configuration. . . 63
3.7 Data set 3: IAM experimental data for the early intake port opening configuration. . . 63
3.8 Early Inlet Port Configuration: model calculated indicated torque. . . . 65
3.9 Early Inlet Port Configuration: model calculated indicated torque. . . . 65
3.10 Early Inlet Port Configuration: model calculated indicated torque. . . . 69
5.1 Modified parameters for LVCR configurations . . . 97
6.1 Eccentric rod component materials . . . 128
6.2 Eccentric rod part’s mass properties . . . 128
7.1 Long plain cap results for drop heights of 2, 1.5 and 1 m . . . 163
7.2 Short plain cap results for drop heights of 2 m . . . 164
7.3 Long gland cap results for drop heights of 2 m . . . 164
7.4 Short gland cap results for drop heights of 2 m . . . 165
7.5 Short plain cap results for drop heights of 2 m with reduced cylinder oil volume . . . 165
7.6 Short plain cap results for 300 consecutive drop from a height of 2 m . . 166
7.7 Heat transfer model parameters which reproduced the experiment’s mea-sured temperatures . . . 174
7.8 Energy transfers for each impact event . . . 181
8.1 Measured sizes of hydraulic chamber slots and bosses . . . 203
8.2 Experimentally determined speeds to shift to HCR without engine pres-sure applying . . . 213
8.3 Experimentally determined speeds to shift to LCR without engine pres-sure applying . . . 214
LIST OF TABLES xxv 8.5 Experimentally determined number of revolutions required to shift to
HCR without engine pressure for varying engine oil temperature at 2000 rpm . . . 216
8.6 Experimentally determined number of revolutions required to shift to HCR with engine pressure at 1600 and 2200 rpm . . . 220
8.7 Reproducibility tests with engine pressure at 1600 and 2200 rpm . . . . 226
8.8 Repeat of rod length-change experiments to identify changes over the duration of tests to the time . . . 228
8.9 Rod length-change at elevated oil temperature with engine pressure . . 229
Acronyms & Abbreviations
ATDC After Top Dead Centre BDC Bottom Dead centre
BEV Battery-powered Electric Vehicle
BICERI British Internal Combustion Engine Research Institute BMEP Brake Mean Effective Pressure
BTDC Before Top Dead Centre CI Compression Ignition CO2 Carbon Dioxide CR Compression Ratio
CSHEV Charge-Sustaining Hybrid Electric vehicle CVT Continuously Variable Transmission ESM Engine Simulation Model
ESP Engine Simulation Program FEA Finite Element Analysis
GCR Geometric Compression Ratio (GCR) GDI Gasoline Direct Injection
HC Hydro-Carbons
HEV Hybrid Electric Vehicle HV Heating Value
LIST OF TABLES xxvii
ICE Internal Combustion Engine LCA Life Cycle Assessment LIVC Late Intake Valve Closing
LVCR Late Valve Closing Ratio (defined in Appendix A) MEP Mean Effective Pressure
NEDC New European Driving Cycle NOx Nitrous Oxides
ODE Ordinary Differential Equation PHEV Plug-in Hybrid Electric Vehicles ProE ProEngineer
(Parametric Technology Corporation (PTC) solid modelling) RHC Rockwell Hardness, C
rpm revolutions per minute SI Spark Ignition
SIDI Spark Ignition Direct Injection TDC Top Dead Centre
Introduction
The work reported in this dissertation is focussed on passenger vehicle engines for three major reasons,
1. They are by far the largest consumers of oil-based energy (Detailed Energy Statis-tics, Australia, 2001-02 2004) and consequently were identified as a major con-tributor to fuel consumption and emissions.
2. In spite of decades of concern about the sustainability of fuel reserves and environ-mental concerns about emissions (CO2 and other pollutants), the use of private passenger vehicles has not abated. This applies generally in the western world and especially in Australia.
3. Economic development in India and China will increase the number and use of private motor vehicles.
1.1 Objectives 2 (1993 Ford Falcon) suggested that efficiencies achieved from ICEs for general motoring are substantially lower than the optimum that the vehicle would achieve if the engine operated at its peak efficiency. At highway cruise speed (100 km/hr), engine efficiency is typically below 25%. For cruise at 60 km/hr, efficiency as a percentage is even lower, generally in the mid teens. These figures apply to homogeneous charge SI engines where low power is achieved by reducing the intake manifold pressure through throttling.
1.1
Objectives
Heat transfer, combustion chamber shape and friction are major influences on the per-formance of engines. Many texts present the study of internal combustion engines as the practical application of theoretical work, applying it to conventional engine arrange-ments. Authors such as Stone (1999), Ferguson & Kirkpatrick (2001) and Van Basshuy-sen & Sch¨afer (2004) approach the analysis by describing the fundamentals of the science through to the physical characteristics of engine components. Although each text emphasises different aspects, little is allocated to configuration options that could influence efficiency.
Any number of conceivable mechanisms can be employed as internal combustion en-gines, the essential requirements being a configuration that can compress air, contain the pressure of combustion at an appropriate point and extract work from expanding gas. The practical experience of the work by Malpress & Buttsworth (2007) confirmed heat transfer, combustion chamber shape and in particular, friction as major influences on the performance of alternative engine configurations. While contemplating options, some fundamental questions came to mind. Formulating solutions to these questions constitutes the objectives for this work.
1. Why is the reciprocating piston, connecting rod and crank the overwhelmingly dominant configuration employed today for ICEs?
2. If the piston-rod-crank arrangement is the optimal mechanism, what variations could improve efficiency?
that achieves any identified efficiency gains?
An SI engine does pumping work in inducting air at lower than atmospheric pressure for reduced power operation. The reduced intake manifold pressure is achieved by flow past a throttle plate. The pumping work done by the engine to reduce the intake pressure is one substantial contributor to reduced efficiency at low load. Another contributor to lower efficiency at low load is the friction associated with engine component motion which becomes a larger fraction of brake power at low load.
The presence of the pumping losses at low load also inspired thought as to options which could achieve a reduced manifold pressure without losses. If the engine is doing pumping work to reduce pressure, why can’t that work be used to produce useful output. This question, although not necessarily specifically connected to engine configuration considerations was also contemplated as a means to net engine efficiency improvement.
1.2
Methods
To answer the questions raised, a modelling technique was required that could simulate the performance of any engine configuration. Matlab was seen as a good environment for simulation because of the ability to control all aspects of the modelling, whereas spe-cific simulation applications would require in-built features which allowed for variation to parameters for unique engine configurations. It was considered more productive to build a Matlab based simulation model with the required capacity, rather than search for, assess and learn the function of alternative applications.
1.3 Dissertation Overview 4 Heywood (1988). The model was calibrated by configuring it in a program that used a range of input manifold pressures and engine speeds to output a map of net efficiency for comparison with a published engine efficiency map (Stone 1999). The model proved sufficiently robust, manageable and accurate throughout the research. Details of the ESM features are presented in Chapters 4 and 5.
Reduction of the intake manifold pressure is not required by engine configurations that ingest a full pressure air charge at all loads and control the power by the amount of fuel burnt. This is the prime arrangement employed in diesel engines and in recent technological gains, the concept of stratified charge spark ignition engines have allowed for power control without throttling for spark ignition engines. Diesel engine powered vehicles have gained appeal in the market place for passenger vehicles, but in general are more expensive to purchase and have some negative characteristics - engine noise, vibration and a sluggish engine response - that limit their appeal. Gasoline Direct Injection (GDI) using the stratified charge technique for SI engines has appeared in several marques over recent times, including the Holden Commodore from 2009 (SIDI - Holden Commodore 2010). Other technologies that improve efficiency by reducing thottling have been used by vehicle manufacturers; cylinder de-activation is one such technology and was employed by Honda in recent years. Overall, it became evident that none of these technologies are so conclusively advantageous that they have been universally employed by manufacturers. One could speculate about the cause, but a review of the literature shows it is likely to be the consequence of the balance between cost, service life, effectiveness and the associated market acceptance.
1.3
Dissertation Overview
1.3.1 Chapter 2, Analysis of Efficiency Improvement Options
Early in the project, research was undertaken to justify pursuing efficiency gains for SI engines by a comparing the potential of competing automotive technologies. The work includes comparing alternative automotive power plants based on energy source, fuel efficiency, cost and market appeal. The conclusions drawn indicate that SI ICE powered vehicles dominate the current market, and are likely to dominate the market for considerable time to come, because IC engines possess some very significant advan-tages for application as motor vehicle power-plants. Based on current technology and energy transfer infrastructure, ICE powered vehicles are very effective personal trans-port vehicles on a Life Cycle Assessment (LCA) basis and on a net cost per kilometer basis.
1.3.2 Chapter 3, Air Motor
Work reported in Chapter 2 suggests that efficiency improvements are certainly possible for SI ICEs. The conclusion that the piston-rod-crank arrangement has advantages that warrant its retention and that throttling losses contribute a significant reduction in efficiency at low load, inspired some thought as to what device could be used to improve efficiency by reducing throttling losses. Expansion of a gas through a motor produces work and reduces the pressure and temperature of the gas. In the case of a throttled engine, if the atmospheric air was expanded through a motor in the intake stream, it would reduce the air pressure and consequently the power produced by the engine, but concurrently produce some work which could be used to assist the output of the engine and consequently improve the efficiency.
1.3 Dissertation Overview 6 is linked to the work done by the IAM, it was recognised that the engine could take advantage of the lower inducted air temperature for efficiency gains via a higher com-pression ratio (CR). This CR would need to be changed to accommodate the ambient temperature air inducted for full power. That led to research about variable compres-sion ratio (VCR) and revealed that it is a well studied field. It is generally accepted that VCR provides andvantages for efficiency at low load in SI ICEs. Because VCR is not standard technology in production engines, further work centered on exploring VCR.
1.3.3 Chapter 4, VCR technology, Review, Modelling and New Di-rections
VCR technology is a widely studied area. The literature review identified that the benefits of VCR warrant significant efforts to produce viable VCR mechanisms. Com-ments on relevant reviewed work are given in Appendix B. Major manufacturers have attempted VCR engines in the past with Saab (Crosse 2000) the example frequently cited, yet VCR is not employed by current manufacturers. Chapter 4 reviews past work and identifies that the main barriers to the use of VCR in production motor vehicles have been durability concerns, cost, complexity and weight.
Work proceeded to identify appropriate VCR mechanisms that could achieve the re-quired performance under the criteria established thus far; that is, a device that can achieve VCR, can be adapted to conventionally configured piston-rod-crank engine and is relatively simple in construction. Three notions came to mind,
1. An eccentric bush in either the big-end or small end of the connecting rod,
2. A hydraulic component in the connecting rod, and
3. a hydraulic chamber in a two part piston.
Extensive work has been carried out on a hydraulic chamber in the piston. BICERI (British Internal Combustion Engine Research Institute) developed such components in the second half of the 20th century. Further study on this concept was not considered appropriate as described in Section 4.2.
A patent search revealed that eccentric bushes have been identified by others as a VCR mechanism, (Kume, Shiraishi, Matsuda & Okada 1992). Hydraulic means for VCR have been patented, (Yadegar 2002), but technological analysis of the notion was lacking. No academic assessment of the performance of an eccentric bush in the big-end of the connecting rod was found. However, work by Wittek & Tiemann (2009) studied the application of an eccentric bush in the small end of the rod. No literature indicating the performance of a hydraulic mechanism altering the length of the connecting rod was discovered. Hydraulic means to control the latching device for eccentric mechanisms altering the length of the connecting rod have been patented, (Kume et al. 1992).
As a result, three avenues of study were pursued.
1. A numerical simulation study was carried out into what advantage a continuously variable compression ratio has over a VCR technology that switches between two defined CRs. This identified that a significant proportion of optimum VCR efficiency gain can be achieved with a step between two CRs.
1.3 Dissertation Overview 8 3. The connecting rod loads in an ICE suggest that oil in a hydraulic cylinder act-ing as a connectact-ing rod would be subject to pressure much higher than in typical hydraulic applications. Consequently, information about the characteristics of oil under high pressure and high impact rate loading was determined from experi-mentation on a hydraulic cylinder impacted with a falling mass.
1.3.4 Chapter 5, Two-Position CR Compared with Continuously
Vari-able CR
One aspect of mechanisms identified by the literature review for VCR was that the com-plexity of the devices potentially reduced their effectiveness through increased friction and the associated high expense of production could reduce their market appeal. The complexity of a VCR mechanism might be reduced if the device was not required to support engine pressure over the range of CRs sought. The advantage of continuously variable compression ratio over a stepped variable compression ratio using two discrete CRs was consequently assessed by simulating the net fuel consumption over a stan-dard driving cycle based on experimentally determined vehicle power requirements and modelled fuel consumption. The New European Driving Cycle (NEDC) was used as a representative demand for vehicle performance. Coast down tests on a medium sized sedan identified vehicle power requirements over the speed range. The simulated engine configuration uses late intake valve closing (LIVC) and throttling. In the continuously variable CR simulation, the CR is altered in direct response to the engine power demand from full load to a predetermined maximum geometric CR at part load, maintaining a constant effective compression ratio. For lower loads, throttling was employed. In comparison, the stepped CR used throttling to reduce load below WOT using the low geometric CR until the required power matched the engine performance at the high geometric CR using LIVC and WOT. For lower loads throttling was again employed. Net fuel consumption was based on the modelled engine fuel efficiency modified by transmission efficiency.
determined as significant. No difference in fuel consumption between the continuously variable and stepped CR configurations resulted because the maximum power demand did not exceed the maximum power available from the LIVC, high compression ratio configuration, therefore no use was made of a continuously variable CR in the NEDC for the vehicle/engine combination studied.
This result encouraged study of stepped VCR devices, one of which is an eccentric bush in the big end of the connecting rod.
1.3.5 Chapter 6, Eccentric Bush for VCR
1.3 Dissertation Overview 10 1.3.6 Chapter 7, Transient Loading of Hydraulic Cylinder without
Seals
The specifications of an experiment to investigate the performance of a hydraulic cylin-der in the connecting rod of an ICE required consicylin-deration of the maximum load en-countered and the rate at which that load changed. In a worst case scenario, the full combustion pressure when applied over the piston area would act to compress the con-necting rod. In reality, the piston is always being accelerated away from the combustion chamber by a force supplied by the con-rod in the part of the cycle where the cylinder pressure is high. Consequently, the actual compressive load in the con-rod in an oper-ating engine will be lower than the load produced by the combustion pressure acting on the piston. The modelling associated with the general ESM can return the loads in the con-rod, but for a general case the experiment was carried out considering that the pressure in the hydraulic cylinder acting as the con-rod would be approximated by the ratio of the engine piston area divided by the hydraulic piston area multiplied by the engine combustion pressure. For an engine piston diameter of 80 mm and a hydraulic piston diameter of 20 mm, the pressure resulting in the hydraulic oil would not exceed 80 MPa. An experiment and modelling was conducted which indicated that engine oil was capable of operating at pressures of that magnitude. At the viscosity at 25oC, the oil flow in the annular gap between the piston and cylinder cap was low enough to indicate that a hydraulic cylinder operating without seals, as a conrod in an engine, would not change length by a significant amount due to leakage over the duration of one combustion event. Significantly, the experiment was also arranged to deduce whether the oil could absorb impact and return the energy efficiently. This was to investigate a notion that such a hydraulic con-rod arrangement would have the added benefit of absorbing knock loads.
1.3.7 Chapter 8, Hydraulic Connecting Rod
gave some insight into potential features for the hydraulic cylinder in the con-rod. Di-mensional constraints led to a design for the hydraulic chamber which was not circular in section. To keep the peak pressure in the hydraulic chamber at levels that the hy-draulic cylinder impact experiment suggests could be sustained, the chamber area needs to be higher than what can be arranged for a circular cylinder. To provide sufficient wall thickness to accommodate the pressure and allow the device to be installed without significant alteration to engine configuration, the hydraulic chamber was designed to encapsulate a floating bush at the big-end. A semi-circular ended slot forms the cham-ber. A functional control valve was designed to switch the sense of a one-way valve allowing oil to port between two chambers, above and below the floating bush. On first operation, a prototype of the rod showed significant promise for VCR. The dynamics of piston and connecting rod motion ‘pumped’ the rod to the opposite limit of length change within 0.5 seconds for the engine motored without engine pressure operating. Extensive tests confirmed that further development of the concept is warranted.
1.3.8 Chapter 9, Conclusions and Further Work
Chapter 2
Analysis of Passenger Vehicle
Options Compelling Internal
Combustion Engine Efficiency
Improvement
2.1
Introduction
today because problems associated with electric storage have not been resolved. One significant driver for replacement of ICE powered vehicles in the 1970’s was air pol-lution in cities. That problem has alleviated to some degree as a result of improved ICE emission control. In the period since 1970, other problems have caused a fluctu-ating demand for viable electric vehicles. Sustainable ICE fuel sources and in recent times global warming associated with GHG emissions have re-ignited the debate about electric vehicles.
Other propulsion technologies have emerged over time, with attention from consumers coinciding with rises in oil-based fuel prices. Compressed air, liquid nitrogen and a myriad of alternative internal combustion engine configurations have been proposed in efforts to resolve the problems of high cost oil-based fuels. Some of these alternatives are assessed and consideration is given to a wider range of attributes of passenger vehicles that influence consumer choice. Life cycle assessment (LCA) is employed to quantify cost and compare alternatives. Overall, the role of ICEs for vehicle propulsion is entrenched and for a variety of reasons, the alternatives do not provide cost effective, functional substitutes and the use of ICEs and the associate consumption of oil-based fuel will continue. Efficiency improvement in ICEs is identified as feasible and necessary.
2.2
Internal Combustion Engine Characteristics and
At-tributes
2.2 Internal Combustion Engine Characteristics and Attributes 14 to low efficiency from losses at the required operating clearances.
The dominant configuration for passenger vehicles has been spark ignition 4-stroke engines, although recent technological advances in diesel injection and pre-induction compression (turbo and super-charging) have increased the proportion of passenger ve-hicles operating diesel engines. Increasing concern about the effect on greenhouse gases and the general environmental impact of emissions have initiated legislated emission standards, primarily instigated in Europe, to reduce CO2 and N OX. In part, diesel
engines were favoured for development in Europe because of their prior better efficiency and emission performance and governments in general have facilitated the demand for diesel powered vehicles with significantly higher tax on petrol. The longevity of such high pressure diesel engines is yet to be fully proven, but the added cost of their pro-duction is evident in vehicle prices.
Several technologies have been explored for improved efficiency in spark ignition en-gines. Based on the theoretical ideal cycle, spark ignition engines (Otto cycle) have bet-ter efficiency than diesel engines (Diesel cycle) at the same compression ratio (C’engel & Boles 2006). Because SI engine are constrained by fuel characteristics to operate at a lower compression ratio than diesel engines, together with throttling losses at reduced load, SI engine efficiency relative to diesel engines is compromised.
Direct injection, Variable Valve Timing (VVT) and pre-induction compression are tech-niques currently used in production spark ignition engine powered vehicles to improve efficiency. Direct injection allows for induction without throttling. At low load, an ignitable charge is concentrated in the proximity of the spark plug and the majority of the cylinder has only air without mixed fuel. Efficiency improvements over homogenous charge SI engines result from the reduced or eliminated throttling losses (Stone 1999). VVT has wide spread application with performance, emission and efficiency benefits (Van Basshuysen & Sch¨afer 2004). Pre-induction compression such as super-charging and turbocharging give engine efficiency benefits through downsizing (Wong, Stewart, Lundholm & Hoglund 1998),(Clenci, Descombes, Podevin & Hara 2007).
a spark ignition (SI) engine produces net efficiencies in the order of 22% for highway cycle and less than 12% for city cycle operation (Malpress & Buttsworth 2009). These efficiencies are with respect to propulsion energy compared to the heat energy available in petrol and are for a normally aspirated fixed valve timing SI engine. The thermody-namic limit of efficiency for a spark ignition internal combustion engine (ICE), based on its idealised cycle (Otto cycle) shows that its efficiency is dependent on compression ratio (r),ηthermal,Otto= 1−rk1−1, wherekis the ratio of specific heats. For realistic
com-pression ratios, the ideal efficiency is above 60%. That efficiency can never be achieved in realty due to losses associated with engine friction and heat transfer inefficiency, but values approaching 50% are realistic. The US Government Energy Department, (Energy Efficiency and Renewable Energy Vehicle Technologies Program2010) has iden-tified goals of achieving 45% efficient IC engines by 2015. Therefore some scope exists to improve the performance of internal combustion engines with respect to efficiency, but limits exist at efficiencies approximately twice values typically achieved today in conventional homogeneous charge SI engine powered vehicles.
2.3
Personal Transport Options - Consumers Have
Ex-tensive Choice
2.3.1 Introduction
2.3 Personal Transport Options - Consumers Have Extensive Choice 16 appealing. With rapidly increasing living standards in China and India generating the associating increase in ownership of personal motor cars, the impact of motor ve-hicles on the natural environment is an issue with escalating significance (Dargay & Gately 1999).
When convenience and comfort are taken into account, alternatives to the personal motor vehicle are difficult to sustain unless external effects are operating. Those effects could be policy driven by government authorities for the purpose of influencing an externality such as demand for oil based fuels. In other scenarios, effects such as traffic congestion could have a direct impact on the vehicle owner’s choice. Thebest transport option for individuals is therefore a very challenging concept to investigate. In spite of the magnitude of any forces compelling people to choose one form of transport over another, the environmental impact (natural and otherwise) of the choices will be lessened by improving the efficiency of energy transfer achieved by the technology employed.
2.3.2 Role of Life Cycle Assessment
The realistic limits for vehicle configuration for personal transport are extremely broad. In general, it is common for one end of the spectrum to be large 4WD vehicles and the other end human-powered vehicles, typically bicycles. The ongoing operating cost of a vehicle is not the primary criteria used to inform a consumer’s decision on what type of vehicle to use, primarily, because those costs are currently low. This makes defining the suitability of vehicle choice difficult. A Life Cycle Assessment (LCA) can identify a natural environmental cost for a vehicle, but unless some value is concurrently assigned to personal considerations such as convenience, trip times, and safety for example, a LCA cannot inform decisions about the appropriateness of vehicle type for personal transport. Also, if the externalities identified by a LCA are attributed a cost via a mechanism such as carbon pricing, a LCA could help quantify vehicle operating costs in the future.
of the same capability, a LCA becomes a good decision making tool for consumers con-cerned about the natural environment. This has to be considered in isolation from the appropriateness of the vehicle, but can and should influence the decision about vehicle ownership (Environmentally Conscious Transport 2008). Importantly, for the direct comparison of vehicle configuration types which can achieve the vehicle performance requirements, an LCA will identify the total environmental impact of the vehicle when all externalities are considered.
2.4
Effect Of Propulsion Type On Vehicle Consumer
Ap-peal
2.4.1 Electric vehicle intrinsic drawbacks
A full electric vehicle or battery-powered electric vehicle (BEV) is frequently referred to as a plug-in; meaning that all energy used by the vehicle is acquired through an electric recharge. Several major vehicle manufacturers have marketed versions of the plug-in. Mitsubishi recently released a full electric vehicle, the MiEV, in Australia (Mitsubishi 2010). In 2010, the pricing of this vehicle and its competitors was difficult to specify with estimates ranging from twice the retail price of the Toyota Prius (equating to more than AU$80,000) to figures around AU$35,000 (Mitsubishi reveals pricing for electric car 2010). The motor vehicle companies acknowledge that price will be the primary barrier to consumer acceptance. Government subsidies could well conceal the real cost of the vehicle. The MiEV was released in Australia with considerable demand as a lease only option.
2.4 Effect Of Propulsion Type On Vehicle Consumer Appeal 18 meaning that a typical recharge might be for only two or three hours. The MiEV has the capacity for a fast recharge but it requires a 3 phase 50 kW power source, gener-ally not available in domestic dwellings, but in a commercial operation such recharge capacity could be useful. Although the purchase cost would be a barrier in itself, the most significant obstacle to general acceptance would be the inability of the vehicle to make trips in excess of 100 km without access to at least a 240 V recharge source and 8 hours! Such electric vehicles would have a quite specific market appeal and in general could not fill the role currently filled by the vast majority of ICE powered vehicles. In a 200,000 km expected life of a small ICE powered vehicle which achieves a life-long fuel consumption average of 6 L/100km, 12,000 L of fuel will be consumed. At 2010 Australian petrol price of $1.30/L, the purchase price alone of the MiEV will exceed both the purchase price of an equivalent ICE powered vehicle and all the fuel it would use in its life.
2.4.2 Alternative electrical storage systems
When a vehicle’s operating requirements are not able to be met by BEVs because of the problem of recharge time, replaceable batteries that are charged remotely from the vehicle could be used. Battery cost would consequently be a major consideration and potentially an optimized range-weight-cost combination for particular battery technol-ogy could prove to be effective. Major motor vehicle manufacturers are exploring such options. Renault for example is involved in developing the Quickdrop system (Green Car Congress, Energy, Technology, Issues and Policies for Sustainable Mobility2010).
cost of the electric power used for BEVs is a low proportion of the cost of operating the BEV, they claimed that the use of currently expensive renewable electricity is a viable energy source for BEVs because of their storage capacity. That is, the energy from renewable electric sources could be stored for vehicle use when it is being generated, such as daylight hours for photovoltaic or windy days for wind turbines for example; suggesting that the widespread use of BEVs could have the added benefit of supporting the renewable energy sector. They also claimed that the widespread take up of BEVs would benefit the Australian economy by reducing importation of petroleum products. They failed to identify where the batteries, which they identified as the major cost, were to be manufactured and from what energy source. If the import of fuel is substituted by the import of batteries than the point has less validity. It was claimed that most advanced countries have well established BEV systems and that mass produced cars are comparable in price to ICE powered cars. This is not the case in Australia and one would assume that the cost of BEVs is being subsidised by the governments of those countries. The commentators did say that the government would get very good value for money invested in subsidies for BEVs and the infrastructure for re-charging.
Based on current consumer demand, BEVs have a limited role to play. With significant government investment and significant technology improvement, BEVs could, in future, become more appealing.
Chieng, Kazacos & Skyllas-Kazacos (1992) and others have contributed to the im-provement of Vanadium redox batteries. The concept shows promise in that only the electrolyte, a liquid, needs to be replaced to recharge the battery, though poor energy density has been a major drawback to date.
2.4.3 Electric hybrids - a more usable concept
2.4 Effect Of Propulsion Type On Vehicle Consumer Appeal 20 and when the battery electric system is used more as an accumulator for ICE efficiency the design concept is called charge-sustaining hybrid (CSHEV) (Environmentally Con-scious Transport2008). From the driver’s viewpoint, HEVs are essentially very similar to ICE powered vehicle in most respects. The one feature that is notably different is the net fuel consumption, especially city cycle, which is significantly lower. Of course, that is counterbalanced by a much higher purchase price in comparison to ICE vehi-cles with comparable performance. Based on the Toyota Prius in 2010, at retail prices of approximately AU$40,000, and achieving an average of 5 L/100km compared to 8 L/100km for an ICE powered equivalent, the cost of reduced fuel consumption over a 200,000 km life is about AU$8,000 on current fuel pricing. This doesn’t compensate for the purchase price which is easily AU$20,000 higher than an ICE powered equivalent vehicle. As with BEVs, HEVs do not represent a cost benefit over the vehicle life.
2.4.4 Alternative energy storage technologies
A large number of alternative energy storage systems have been attempted. These include relatively simple systems such as compressed air, which can have low capital cost per vehicle, but result in high operating costs due to energy transfer inefficiencies. Although online media presentations by compressed air vehicle manufacturers (The Air Car2007) claim impressive performance, the net energy conversion of compression by an electric source then expansion in a mechanical motor are physically inefficient. Heat recovery from ambient air could assist efficiency and other technologies including hybrid use (Ditmore 2009) could make compressed air a viable vehicle propulsion technology.
A version using liquid nitrogen as the energy storage medium has been considered (Randell 1974). In environments requiring very low emissions, such vehicles can find a niche, but typically would compete with BEVs.
energy conversion, cost and physical characteristics make it unviable.
Assume the liquid nitrogen is stored at 1000 kPa, the ratio of specific heat,n is 1.4, and using an expansion ratio in the motor of 5:1 gives an exhaust pressure of approximately atmospheric for isentropic expansion, P = 1000×(15)1.4≈100 kPa. The work done in the expansion, given by P2V2−P1V1
1−n is 2,237 J for a piston dispalcement of 0.8 litres. At
2000 rpm the motor which expands the nitrogen gas produces approximately 74 kW. The exhaust temperature will be low at approximately 250 K, so some heat transfer from ambient air to increase the work done is certainly possible. Based on a 2010 price for liquid nitrogen purchased in small quantities of $3.20 per litre, and a density of 0.8 kg/litre for the liquid and using the ideal gas law for the pressurised gas before expansion in the motor, without considering added work from heat transfer in the expansion process, a liquid nitrogen powered motor produces about 800 kJ of work for $3.20. That equates to 0.22 kWhr for $3.20 and 0.28 kWhr of stored energy per kg of liquid nitrogen.
When compared to lead-acid battery storage at about at 0.04 kWhr per kg, liquefied nitrogen stores energy at a better energy for weight than a lead-acid battery, even if the liquid nitrogen tank weighs as much as the nitrogen it contains, resulting in 0.14 kWhr/kg. Significantly, the cost of the stored energy is about 20 times more ex-pensive (electricity≈$0.16/kWhr) than the energy stored in a charged battery when sourced from a domestic connected grid. A further disadvantage is the extra storage volume required for liquid nitrogen as compared to an equivalent battery, at approxi-mately 6:1. If considered as a competitor to petrol fuel energy storage (35 MJ/litre), considering only a 30% efficiency for petrol conversion in an IC engine and 90% in the nitrogen motor, the ratio of energy delivered to the vehicle per unit volume for liquid nitrogen compared to petrol is in the order of 1:50.
2.4.5 On-board conversion from fuel energy to electric energy
2.4 Effect Of Propulsion Type On Vehicle Consumer Appeal 22 modern electronically controlled motors which can exceed 90%, it is an appealing goal to create electrical power directly from the fuel.
The endurance problem of BEVs can be overcome by on board conversion of fuel energy to electric energy with an ICE powered generator. Advantage can be taken of high ICE efficiency under specific operating conditions in such a configuration.
Fuel cell technology can also achieve this and is in use in various countries. Hydrogen has proven to be a viable fuel for fuel cells. An added advantage in creating the infrastructure to produce hydrogen for fuel cell powered vehicles is that hydrogen is also a good ICE fuel. Consequently, during the transition to fuel cell vehicles, current ICE vehicles can be serviced by the hydrogen supply infrastructure (California Fuel Cell Partnership2010).
2.4.6 Conclusion
2.5
Direct Energy Conversion Efficiency At The Vehicle
2.5.1 Introduction
The standard measure for fuel consumption for ICE vehicles is litres per 100 km. This is a clear comparator for vehicles using the same fuel, but is misleading for comparison of vehicles operating on different fuels. The most notable current discrepancy relates to the comparison of petrol and diesel fueled vehicles. The available energy per volume of diesel is higher than that for petrol. A measure of that energy, the heating value (HV) is generally defined on a per mass basis and is about 45 MJ/kg for diesel and 47 MJ/kg for petrol. The density of petrol is about 0.87 that of diesel, resulting in the energy of diesel being about 10% higher on a volume basis. A true comparison of efficiency between fuel types is more complex because the energy associated with the production of the fuel is not apparent to the end user.
The cost of fuel is also not a good comparator with respect to the energy content. For example, in Australia in 2010, ethanol for motor vehicle use does not attract the same taxes as petrol and therefore the cost to the consumer is not an accurate indicator of the energy associated with its production. Australian governments have a long history of using taxes and tariffs on fuels (History of fuel taxation in Australia 2001) to mod-ify demand and alter government revenue, consequently influencing fuel consumption patterns.
2.5.2 Spark Ignition ICE
2.5 Direct Energy Conversion Efficiency At The Vehicle 24
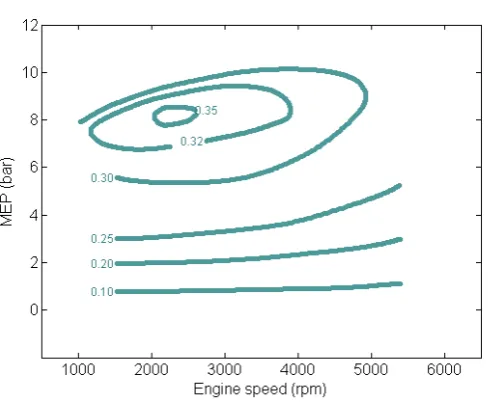
Figure 2.1: Typical SI engine efficiency map (Adapted from Stone (1999))
The power required for level cruise of a typical 4.0 litre family sedan ranges from 8 kW at 60 km/hr to 17 kW at 100 km/hr (Malpress & Buttsworth 2009). In Figure 2.1, at the required output torque, equating to brake mean effective pressure (BMEP) in the plot, the efficiency varies significantly from less than 17% for 60 km/hr motoring using 1300 rpm and 1.8 bar MEP to approximately 22% at highway cruise speed using 2000 rpm and 2.5 bar MEP.
2.5.3 Compression Ignition ICE
The Diesel cycle represents an idealized compression ignition (CI) engine and in com-parison to the Otto cycle for the same CR is slightly less efficient. Because a diesel engine operates at a higher CR and in general can operate without throttling, typically the fuel consumption of CI ICE powered motor cars is lower than equivalent SI ICE powered vehicles. To some extent this fuel consumption advantage is the result of the energy density of the fuel as described in 2.5.1. Recent efforts from most European manufacturers to optimize efficiency via high pre-induction compression such as su-percharging and turbo-charging and very high fuel injection pressures have produced reductions in fuel consumption for CI engines.
vehicle indicate that diesel options achieve about a 25% better fuel consumption on a per litre basis reflecting an energy efficient benefit of approximately 16% (Toyota 2010b).
Small passenger cars operating high pressure diesel engines can achieve highway fuel consumptions as low as 4 L/100km (Fiat 2010).
2.5.4 Electric hybrid
The prime design intent of electric hybrids is improved fuel efficiency. Published data for the Toyota Prius (Toyota 2010a) indicates a city cycle fuel consumption is very similar to the highway cycle at about 5 L/100km. Various configurations of drive train can be selected for optimum efficiency for a particular application and when optimized for highway cruising with optimum aerodynamics and rolling resistance, moderate sized HEV passenger cars can achieve fuel consumption as low as 3 L/100km on petrol. In the case of the Prius and any HEV of the type, highway cruise efficiencies are achieved by operating the ICE engine very near to its optimum efficiency point. In doing so, the engine is configured in such a way that it reduces the maximum power available from the engine relative to a conventional configured engine of the same displacement. When used in a conventional ICE powered vehicle the engine configuration would generally be selected to include optimised power from a specific displacement. The large im-provement on the city cycle efficiency of a HEV over a conventional ICE power vehicle is a combination of ICE efficiency in the HEV and regenerative and optimum energy conversion. See 2.5.2 for an explanation of ICE efficiency.
2.5.5 Battery electric vehicles
2.5 Direct Energy Conversion Efficiency At The Vehicle 26 for a vehicle designed to carry four passengers. That can result in deficits in the order of 15% for the rolling drag.
For a small four seat commuter car, the energy input from the electric charging source gives approximate endurance of 100 km per 12 kWhrs. At 2010 South East Queensland domestic electricity costs, this equates to approximately $2.20 per 100 km. Typically, a similar ICE power vehicle would operate on city cycle at 6 L/100km. At 2010 petrol retail price, that equates to $7.80 per 100 km. On these figures, the electric vehicle seems a very attractive option.
One very significant advantage of BEVs is that while no drive force is required by the vehicle, that is while either stationary or coasting, no electric energy is being consumed. In addition, re-generative braking is also quite effective and efficient in BEVs.
The result is a low recharge energy requirement for motoring compared to the energy available in fuel that is used in equivalent sized ICE powered vehicles. Included in the above energy consumption values is the effect of the efficiency of battery charging. The recharge-discharge efficiency of modern batteries of any type is still no better than 80% (Ikeya, Sawada, Murakami, Kobayashi, Hattori, Murotani, Ujiie, Kajiyama, Nasu, Narisoko, Tomaki, Adachi, Mita & Ishihara 2002) and is dependent on discharge current (power). Since this is the only source of energy for a BEV, it should always be considered in energy analyses for the vehicle. In spite of this, a BEV is still significantly more efficient than an ICE powered vehicle when comparing the electric energy input to the fuel energy equivalent. Based on the 15% net efficiency for the ICE powered vehicle and 35 MJ/L for heating value, the ratio of efficiencies of energy conversion for an ICE powered vehicle (fuel energy to motive energy) to a BEV (recharge energy to motive energy) is approximately 6:1.
Australia, 2001-022004). When this is taken into account, the net efficiency of electric vehicles from fuel source to propulsive energy is approximately double conventional ICE power vehicles. This margin would be reduced to possibly directly compare with ICE powered vehicle efficiency if the optimum efficiency can be achieved in the ICE of a vehicle (see Section 2.2), although some energy is required in the manufacture and delivery of fuel for ICEs.
The second of the inefficiencies of BEVs that is not directly apparent is the energy associated with the manufacture of the batteries. It is manifested to some degree in the cost of the batteries/vehicle, but a LCA would identify and could quantify this energy cost via carbon pricing and would result in a further reduction in the efficiency of energy conversion for a BEV.
2.5.6 ICE efficiency for on board energy conversion
The most telling detail of the analysis of HEVs is the achieved fuel consumption of a vehicle that is sourcing all its energy from on board fuel via an ICE. No substantial efficiency gain is achieved by the hybrid characteristics of HEVs at highway cruise speed because the energy transfer is essentially constant with no electric contribution because the battery energy source is of limited size. Therefore, the ICE achieving that fuel consumption is capable of achieving that fuel consumption without the hybrid features. That is, in a conventionally configured ICE powered vehicle operating with the engine specifications employed in the HEV would achieve similar cruise fuel consumption to a HEV.
2.6 Life Cycle Assessment of ICE Powered Vehicles, HEVs And BEVs 28 to optimum over a much larger operating range than conventional ICE power plants.
The power-to-weight ratio of an engine is a major design consideration. Reduced weight directly improves acceleration and reduces fuel consumption. Complex structural con-sideration for safety and performance are influenced by engine mass. The prime engine configuration modification employed in the Prius engine is an increased compression ratio and reduced compression stroke volume via valve timing (Toyota 2010a). This arrangement uses a conventional ICE. That engine with a reduced CR and full com-pression stroke configuration would produce a higher maximum power with essentially the same engine mass. The reported GHG LCA advantage of HEV could therefore be achieved with a conventional ICE powered vehicle at highway cruise speeds by using the engine configuration employed by HEVs. Re-generative braking and other efficiency gains for city cycle operation, such as no energy use for idle and coasting, give the HEV its notable fuel consumption advantage in city cycle use.
2.5.7 Conclusion
A comparison of propulsion systems via a LCA is necessary to identify what net energy transfer efficiencies exist in alternatives to ICE power vehicles. This requires an anal-ysis of manufacturer energy transfers and should consider the primary energy sources. Obtaining optimum efficiency for the ICE of conventional vehicles brings their effi-ciency to similar values as BEVs without considering the energy transfer required for manufacturer, which would inevitably favour the ICE powered vehicle.
2.6
Life Cycle Assessment of ICE Powered Vehicles, HEVs
And BEVs
internationally standardized, GHG emissions will be factored into cost. Estimates of future cost of currently produced vehicles can be projected from LCA generated GHG emissions and converted to cost via an estimated carbon price.
LCA of HEVs and BEVs and comparisons of each with conventional ICE powered vehicles have been carried out by others, including Samaras & Meisterling (2008) who report the advantage of plug-in HEVs over conventional ICE powered vehicles is 32% with respect to GHG emissions. They report that a similar advantage exists for HEVs over conventional ICE powered vehicles. Other studies (Matsuhashi et al. 1998), (Humphreys, Placet & Singh 1996) indicated similar levels of advantage in regard to LCA of the GHG emissions of various forms of hybrid and battery electric vehicles compared to conventional vehicles. With respect to the uncertainties with which LCAs calculate these values, a figure of 32% is not sufficient to dismiss further development of conventional ICE powered vehicles.
2.7
Variable Compression For Fuel Consumption
Improve-ment
An otherwise conventional ICE powered vehicle with variable CR could achieve cruise fuel consumption efficiency achieved by HEVs as discussed in 2.5.6. Studies on the via-bility of variable compression, (Clenci et al. 2007), (Wittek & Tiemann 2009) through simulation and experimentation suggest that the benefits are worthy of continued re-search. Further work (Malpress & Buttsworth 2009) shows that the majority of the benefit from variable compression ratio (VCR) can be achieved via a step between two CRs. This can potentially significantly reduce the complexity of the VCR mechanism. Various variable compression ratio technologies have been explored in the past but none are yet employed by motor vehicle manufacturers.
Figure 2.2 shows the output from modelling for the efficiency, including engine friction for an ICE with a step in CR.
2.7 Variable Compression For Fuel Consumption Improvement 30
Figure 2.2: Modelled operating efficiencies for a two position VCR engine considered in early
stages of this research. The lower set of contours (thick lines) correspond to the higher CR
case with LIVC and these contours peak at above 35% at approximately 2500 rpm and
produce about 5 Bar MEP. This equates to about 21 kW engine output power for a 2 litre
engine.
achieved at higher engine output power (function of MEP) at conventional CRs can be achieved at lower power with a change to a higher CR. This requires the reduced compression stroke volume. This would improve the efficiency of the engine in the oper-ating range most used. Section 4.4 gives details of the modelling involved in producing the plot of Figure 2.2.
Various mechanisms can potentially achieve the desired stepped CR change and would result in an ICE configuration that could achieve fuel consumption the equivalent of HEVs for continuous power output at highway cruise speeds.
Improved efficiency at lower power outputs would also result, but without a comparable re-generative breaking energy storage system, the overall fuel consumption performance would not compete with HEVs.
total effect could be that HEV GHG emissions might be only marginally better than, if not similar to, a VCR ICE powered vehicle.
2.8
Vehicle Energy Sources
2.8.1 Introduction
One of the driving forces for reduced fuel consumption is the benefits of reduced depen-dency on oil based fuels. Electric vehicles of any form can make direct use of alterna-tive/renewable energy sources that are generated electrically. These sources could be systemic sources such as wind, solar, hydro, geothermal, nuclear or any other,