Students in Work and their Impact
on the Labour Market
Miroslav Beblavý & Brian Fabo
No. 410 / July 2015
Abstract
The purpose of this study is to evaluate the size and composition of the student labour force in order to consider its potential impact on labour markets in the European Union. The paper is based on an analysis of EU Labour Force Survey data from 2011, supplemented by the findings of the EUROSTUDENT project.
The structure of student labour is discussed within the framework of the so-called ‘crowding-out’ literature, which identifies competition for jobs between students and low educated non-students, particularly in the retail and wholesale sectors.
In contrast to these assumptions, we found that, depending on the age of the student, the profile of student workers closely matches that of non-students with medium- to-high educational attainment. In general, the retail and wholesale sectors are of importance in the employment of students under the age of 25, but students typically take positions in the middle of the occupational hierarchy, rather than in the lower-grade positions. Meanwhile, older students, often professionals furthering their education while studying, are typically located in similar jobs and sectors to university graduates.
A common trait of student work is its very high degree of flexibility compared to that of non-students. Nevertheless, the structure of student labour does not lead us to believe that student workers are particularly prone to be present in the precarious segment of the labour market.
CEPS Working Documents are intended to give an indication of work being conducted within CEPS’ research programmes and to stimulate reactions from other experts in the field. The opinions expressed in this document are the sole responsibility of the authors and do not necessarily represent the official position of CEPS.
For a more succinct version of this paper, please see the CEPS Commentary by the same authors, 17 July 2015 ( www.ceps.eu/publications/are-student-workers-threat-or-solution).
ISBN 978-94-6138-471-3
Contents
Introduction ...1
1. Who are student workers? ...2
2. Overview of student workers ...5
3. The structure of student work ... 11
4. Conclusion ... 23
1
Students in Work and their Impact
on the Labour Market
Miroslav Beblavý & Brian Fabo
*CEPS Working Document No. 410 / July 2015
Introduction
The purpose of this paper is to evaluate the size and composition of the student labour force and elaborate on its potential impact on the labour markets of the European Union. The aim is to answer the following interrelated questions:
What is the size and composition of the tertiary-level student working population in an era of massification of higher education?
What work is done by tertiary-level students?
What is the importance of the gender dimension with regard to student work? Which groups are complemented by/compete with tertiary student labour?
A unifying aspect of the various approaches to analysing student labour is the overlap with low-skilled labour. The reasons behind this overlap include the extreme levels of flexibility of many student jobs and their localisation in certain sectors associated with low-skilled work. However, the question of what makes certain jobs ‘low skilled’ remains open in the literature and indeed various authors use a range of arbitrary thresholds and criteria to determine whether a specific worker or job is low-skilled or not (Kureková et al., 2013). This report aims to cover student labour as a whole, rather than focus on any arbitrary segment, and contrasts the actual distribution of working students between jobs and sectors with the assumptions about the low-skilled nature of student work.
The descriptive analysis is based on the European Union Labour Force Survey (EU-LFS) dataset. Although the EU-LFS does not aim to determine the size of the student population, it provides a sufficient sample of student and non-student workers to carry out an in-depth comparison of these two groups. For the purpose of this report, we use EU27 data. While the EU-LFS is conducted annually and allows developments to be observed over time, the extent to which this is possible is limited by the availability of historical data. For this reason, the bulk of the information presented in this report is based on the latest available data from 2011. Where possible, we analyse developments over time, with LFS data supplemented by official statistics. Where appropriate, the findings are also supplemented by the data collected within the framework of the Eurostudent project, which are available in the form of aggregated statistics on the project website. The aim of the project, which took place between 2008 and 2011, was to collect comparable data on the social dimension of student education.
While there is a student workforce in all EU countries, the scope of the phenomenon varies. Some reasons for variance include access to higher education, which is determined by factors such as the structure of higher education funding (and the associated question of fees that
students have to cover); the capacity of universities to offer placements to prospective students; the presence and structure of apprenticeship programmes; and time constraints. All these factors differ between countries (and indeed sometimes between institutions within individual countries). Consequently, where appropriate, the analysis also captures differences between individual EU member states.
1.
Who are student workers?
The supply of highly educated workers in Europe has grown rapidly over the course of the 2000s. While in 2001 on average 17% of the population aged 25-65 had completed tertiary education in the EU27, in 2011 it was already 24%. Over the same time period, the share of workers not having attained at least upper secondary education level dropped from 38% to 30%. This means that while in 2001 62% of workers had at least higher-than-secondary education, in 2011 70% had upper secondary or even tertiary-level education.
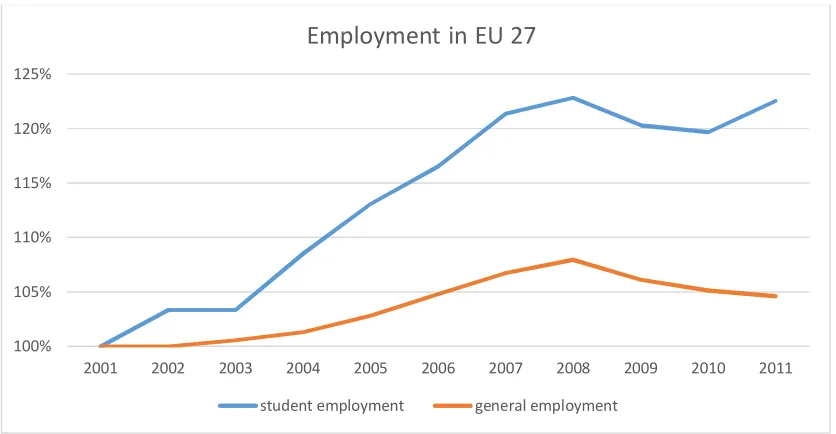
[image:4.612.92.510.349.566.2]The increased participation of Europeans in tertiary education also means that there is an increased number of students living in the EU27, an increase from 16.5 million in 2001 to over 20 million in 2011 (see Appendix Part I, Table A1). The share of working students thus remained quite steady at around 30%, despite the Great Recession.
Figure 1. Relative growth of employment among students and in general population
Note: Figure represents the number of workers, not a share.
Source: Own calculation based on EU LFS, Eurostat.
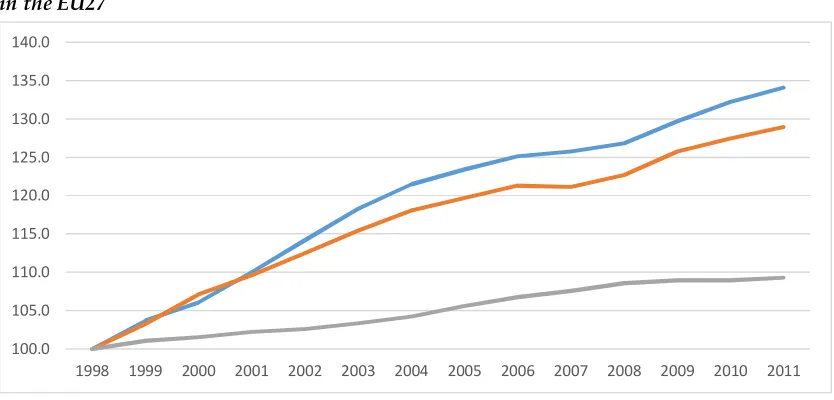
Figure 2 shows that the growth of students has by far outpaced any growth in the working-age population. Additionally, the number of students working-aged over the 25 years of working-age threshold associated with a move from higher education to the workforce has been growing even faster.
100% 105% 110% 115% 120% 125%
2001 2002 2003 2004 2005 2006 2007 2008 2009 2010 2011
Employment in EU 27
Figure 2. Index of growth of workforce (grey), students (blue), and students under 25 (orange) in the EU27
Source: Eurostat (1998=100).
Nonetheless, the rise in the number of students compared to the size of the labour force has not happened in all EU member states to the same degree. For example, the expansion of the student population has not kept pace with the growth of the economically active population in Spain, but has significantly outpaced it in a number of new EU member states and in the Netherlands (Table 1).
Table 1. Growth of students and population in the EU27, 2001-2011
Country Students growth Population growth Difference
Cyprus 169% 20% 149%
Luxembourg 112% 17% 96%
Romania 64% -10% 73%
Czech Republic 72% 2% 69%
Slovakia 57% 0% 57%
Netherlands 55% 4% 51%
Lithuania 38% -12% 50%
Malta 55% 6% 49%
European Union 38% 3% 35%
Germany 33% -1% 33%
Denmark 36% 4% 32%
Bulgaria 15% -10% 25%
Estonia 20% -5% 24%
Sweden 29% 6% 23%
Belgium 29% 7% 22%
Poland 17% 0% 18%
Hungary 16% -2% 18%
Slovenia 17% 3% 14%
United Kingdom 21% 7% 14%
Latvia 1% -12% 13%
100.0 105.0 110.0 115.0 120.0 125.0 130.0 135.0 140.0
[image:5.612.97.532.420.725.2]Austria 12% 4% 8%
Finland 10% 4% 7%
Italy 9% 4% 4%
Portugal 2% 2% 0%
Ireland 18% 19% -1%
Spain 6% 15% -9%
Sources: Own calculations based on Eurostat data.
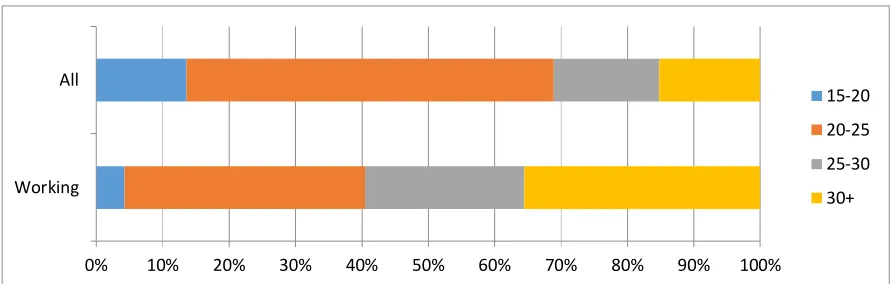
[image:6.612.93.540.268.410.2]The growth in the number of older students is important to understanding the dynamics of students as workers, because students above the age of 25 are especially likely to work.
Figure 3. Average share of students in general/working students per age group in EU27 member states, 2011
Source: Own calculations based on EU-LFS 2011 dataset average of EU 27.
A look at the self-reported main status of the respondent shows another dimension – while younger students consider themselves primarily as students who work ‘on the side’, older students are more likely to be workers who study on the side (Table 2).
Table 2. Main status of students per age group
15-20 20-25 25-30 30+
M ai n S ta tus o f al l st ud en
ts Student 95.40% 87.02% 56.27% 19.20%
Worker 3.37% 10.76% 37.76% 70.09%
Unemployed 0.70% 1.50% 4.37% 5.72%
Other 0.53% 0.72% 1.60% 4.98%
M a in S ta tu s o f st ud en t w o rke rs
Student 68.90% 50.92% 22.83% 6.91%
Worker 31.00% 48.50% 71.67% 91.41%
Unemployed 0.01% 0.12% 3.13% 0.31%
Other 0.09% 0.46% 0.60% 1.38%
Note: Data unavailable for the main status (variable maintstat) of students in the UK and Germany, data insufficient for main status of student workers in Bulgaria, the Baltic countries, Slovakia and Spain.
Source: Own calculations based on EU LFS 2011 dataset average of EU member states.
[image:6.612.96.529.505.678.2]2.
Overview of student workers
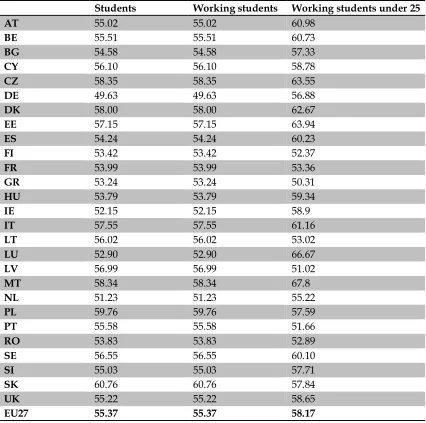
The gender aspect of student work is an under-researched topic. The LFS data show that in all countries except Germany, where the gender ratio is about equal, there are more females than males in the student population. Slovakia is a particularly pronounced case with over 60% of university students being female. The share of female working students is approximately the same as the share of women in the entire student population when taking all students into account, but higher when only students under the age of 25 are considered (Table 3).
[image:7.612.99.525.282.705.2]In this respect the student working population differs greatly from the general population of workers. While women are more likely to study and typically make up the majority of student workers, most member states fall behind the EU 2020 goal of achieving the equal participation of men and women in the labour force due to the lagging participation of women (Mills et al., 2014).
Table 3. Share of women in the student population, working students in general, under 25yrs
Students Working students Working students under 25
AT 55.02 55.02 60.98
BE 55.51 55.51 60.73
BG 54.58 54.58 57.33
CY 56.10 56.10 58.78
CZ 58.35 58.35 63.55
DE 49.63 49.63 56.88
DK 58.00 58.00 62.67
EE 57.15 57.15 63.94
ES 54.24 54.24 60.23
FI 53.42 53.42 52.37
FR 53.99 53.99 53.36
GR 53.24 53.24 50.31
HU 53.79 53.79 59.34
IE 52.15 52.15 58.9
IT 57.55 57.55 61.16
LT 56.02 56.02 53.02
LU 52.90 52.90 66.67
LV 56.99 56.99 51.02
MT 58.34 58.34 67.8
NL 51.23 51.23 55.22
PL 59.76 59.76 57.59
PT 55.58 55.58 51.66
RO 53.83 53.83 52.89
SE 56.55 56.55 60.10
SI 55.03 55.03 57.71
SK 60.76 60.76 57.84
UK 55.22 55.22 58.65
EU27 55.37 55.37 58.17
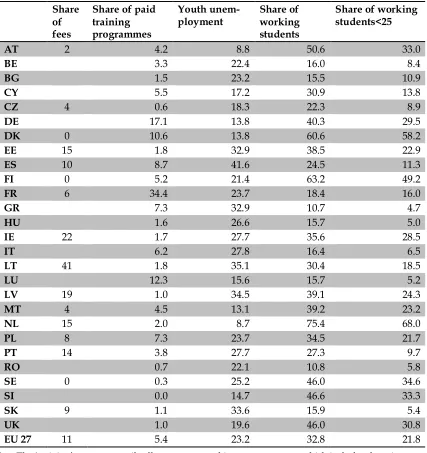
The share of working students differs greatly between individual member states. The data show that the share of working students is 75% in the Netherlands and over 60% in Finland and in Denmark. Meanwhile, in Romania and Greece the share is just over 10% (Table 4).
Table 4. Study fees on undergraduate students’ budget, tertiary students participating in a training programme, youth unemployment and share of working students in general and under the age of 25
Share of fees
Share of paid training programmes
Youth unem-ployment
Share of working students
Share of working students<25
AT 2 4.2 8.8 50.6 33.0
BE 3.3 22.4 16.0 8.4
BG 1.5 23.2 15.5 10.9
CY 5.5 17.2 30.9 13.8
CZ 4 0.6 18.3 22.3 8.9
DE 17.1 13.8 40.3 29.5
DK 0 10.6 13.8 60.6 58.2
EE 15 1.8 32.9 38.5 22.9
ES 10 8.7 41.6 24.5 11.3
FI 0 5.2 21.4 63.2 49.2
FR 6 34.4 23.7 18.4 16.0
GR 7.3 32.9 10.7 4.7
HU 1.6 26.6 15.7 5.0
IE 22 1.7 27.7 35.6 28.5
IT 6.2 27.8 16.4 6.5
LT 41 1.8 35.1 30.4 18.5
LU 12.3 15.6 15.7 5.2
LV 19 1.0 34.5 39.1 24.3
MT 4 4.5 13.1 39.2 23.2
NL 15 2.0 8.7 75.4 68.0
PL 8 7.3 23.7 34.5 21.7
PT 14 3.8 27.7 27.3 9.7
RO 0.7 22.1 10.8 5.8
SE 0 0.3 25.2 46.0 34.6
SI 0.0 14.7 46.6 33.3
SK 9 1.1 33.6 15.9 5.4
UK 1.0 19.6 46.0 30.8
EU 27 11 5.4 23.2 32.8 21.8
Note: The ‘training’ category entails all temporary working arrangements, which include a learning component as long as they are paid. The LFS dataset has no data on unpaid internships.
Source: Training programmes, share of working students – own calculations based on EU-LFS 2011 dataset average of EU member states, share of fees on the budget of an undergraduate student – EUROSTUDENT, youth unemployment – Eurostat.
study practice in Slovakia or the ‘combined’ one in the Czech Republic, which allows individuals, often workers, to attain tertiary education without the need to participate in regular education activities, which has relevance when considering the age structure of student workers. The difference between the shares of working students in general and in the under 25 category is very pronounced in Hungary, Slovakia, the Czech Republic, Italy or Portugal, and minimal in the Scandinavian countries, Netherlands, France or Ireland.
Study fees are a commonly cited factor driving students to seek employment (Hall, 2010). The EU countries differ strongly in the burden the study fees place on students’ budget. This burden is very high in the Baltic states and in Ireland (and probably also in the UK, although EUROSTUDENT does not have data on this country) and no burden whatsoever in the Scandinavian countries.
Another possibly important factor is the work-based training programmes that allow students to gain work experience without interrupting their education. Regardless of whether they take the form of internships, traineeships, apprenticeships, or research assistantships, they are an important source of work for students (Quintini and Manfredi, 2009; Quintini and Martin, 2006). In some countries, these programmes are paid (for example in Scandinavia and in France) and contribute to high rates of student employment. In others, particularly in the Anglo-Saxon context, these programmes are often unpaid and therefore not seen as employment for the purposes of this paper.
Finally, youth unemployment is a factor. While it has already been established that not all students are necessarily young people, low youth unemployment often goes hand in hand with a high share of working students. Austria, the Netherlands and the Scandinavian countries are a good example. Meanwhile, the east European countries, which often suffer high youth unemployment rates, also tend to have a low rate of student work. This might suggest the ‘postponed unemployment’ effect, when participation in higher education serves to shelter young people from the ailing labour market.
A simple correlation shows that paid training programmes are not an important determinant of student employment. There is, however, a somewhat strong and statistically significant correlation between the size of education fees and youth unemployment. This suggests that high fees prevent young unemployed individuals from escaping the labour market through enrolling in tertiary education. High levels of youth unemployment in turn have a medium-sized negative effect on student employment, possibly due to stronger competition for jobs. There is, nonetheless, no significant direct correlation between fees and student employment itself (Table 5).
Table 5. Correlation between the share of study fees on the undergraduate student’s budget, tertiary students participating in internships, youth unemployment and the share of working students, under 25
Fees Training Unemployment Work<25
Fees 1
Training -0.2329 1
Unemployment 0.5* -0.0661 1
Work<25 -0.2099 -0.0667 -0.6099*** 1
Source: Training programmes, share of working students – own calculation based on EU-LFS 2011 dataset average of EU member states, share of fees on the budget of an undergraduate student – EUROSTUDENT, youth unemployment – Eurostat.
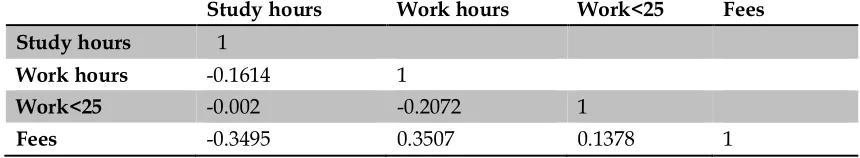
[image:10.612.99.525.239.536.2]Individual European countries differ greatly in terms of how undergraduate students divide their time between study work and leisure. While the relative size of fees compared to the budget of undergraduate students is negatively correlated with the hours they spend studying and positively with hours spent working, it is not statistically significant. There appears to be no correlation between the share of working students and the distribution of hours between working and studying (Table 7).
Table 6. Time allocation (hours per week) of students in EU27
Taught studies Personal study time Paid jobs Total
AT 12.9 16.9 6.6 36.4
CZ 21.2 11.9 10.9 44.0
DE 19.0 16.2 8.0 43.2
DK 17.1 15.4 3.6 36.1
EE 18.1 14.0 12.1 44.2
ES 19.4 17.2 6.5 43.1
FI 20.1 12.8 1.9 34.8
FR 18.2 17.6 2.3 38.1
IE 19.0 13.0 9.0 41.0
IT 17.5 20.7 8.2 46.4
LT 16.7 9.7 11.9 38.3
LV 18.1 12.4 10.6 41.1
MT 16.9 20.4 6.6 43.9
NL 19.0 16.0 8.0 43.0
PL 19.6 10.3 17.1 47.0
PT 26.6 16.1 9.8 52.4
RO 22.5 8.4 4.1 35.0
SE 13.6 19.0 5.9 38.5
SI 21.4 14.3 16.6 52.3
SK 16.0 8.7 9.8 34.5
EU 18.7 14.6 8.5 41.7
Source: Eurostudent.
Table 7. Correlations between weekly undergraduate study time, the number of hours they work, the share of working students in the population of students <25 and the share of fees on student budget
Study hours Work hours Work<25 Fees
Study hours 1
Work hours -0.1614 1
Work<25 -0.002 -0.2072 1
Fees -0.3495 0.3507 0.1378 1
Note: Study hours represent total hours spent learning in class and studying at home.
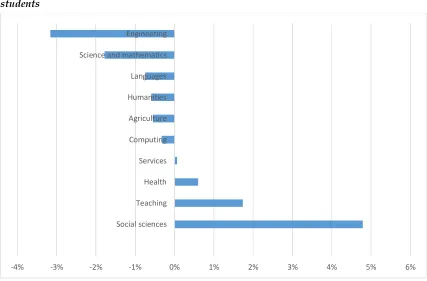
[image:10.612.95.525.604.683.2]Finally, the study field also determines the likelihood of working: the share of social science, law, business, teaching, and health and welfare students among working students is higher than among students in general. Social science, business and law students are particularly likely to work – their share among working students is more than 5% higher than their share in the general student population. Meanwhile, STEM, humanities, languages and agriculture students are underrepresented in the labour market. The share of services students among working students is about the same as in the general student population, (Figure 3). The differences are even more pronounced among students under the age of 25.
Figure 4. Difference between share of study fields on population of students and working students
Source: Own calculations based on EU-LFS 2011 dataset average of EU member states.
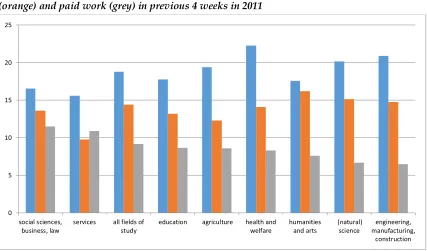
As noted by Beblavý et al. (2013), fewer hours are spent studying in the ‘soft’ disciplines, such as humanities and social sciences, and more in the STEM disciplines, which allows students in these disciplines to spend more time working. Nonetheless, the data are not clear on whether this actually takes place. The EUROSTUDENT data show that STEM students indeed spend more than 35 hours studying and less than 7 hours working, while students of social sciences, business and law spend less than 30 hours studying and over 11 hours working per week. Nonetheless, such a trade-off does not apply to all fields; health- and welfare-field students spend even more hours studying, particularly in taught studies, than STEM students, but also work slightly more hours. Meanwhile, humanities and arts students work fewer hours than expected based on the time they spend studying (Figure 5).
-4% -3% -2% -1% 0% 1% 2% 3% 4% 5% 6% Social sciences
Figure 5. Average number of hours spent on taught studies (blue), personal study time (orange) and paid work (grey) in previous 4 weeks in 2011
Source: Own calculations based on EUROSTUDENT data.
Consequentially, rather than the number of hours worked, the work-study balance might be determined by the study field in a different way. For example, Duru-Bellat et al. (2008) argue that in the context of the massification of tertiary education, the selection of study field reflects the social background of the student and thus students between fields might differ in their need to engage in paid work on the side. Another factor might be demand for different skills associated with individual study fields. Orr et al. (2008) have discovered significant variances between countries in the extent to which students of different fields of study work, which is also visible in the EUROSTUDENT data (Table 8). The average number of working hours in countries thus sometimes increased by very high number of hours worked by students in a particular field, such as health and welfare in Estonia, education in Slovakia and Lithuania or services in Malta and Portugal.
0 5 10 15 20 25
social sciences, business, law
services all fields of
study
education agriculture health and
welfare
humanities and arts
(natural) science
engineering, manufacturing,
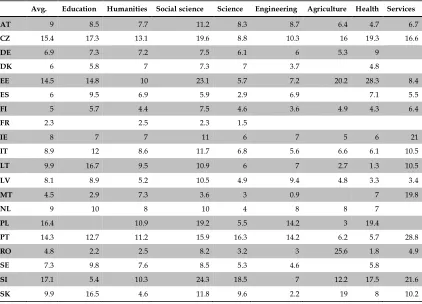
Table 8. Average hours spent working for undergraduate students per country and study field
Avg. Education Humanities Social science Science Engineering Agriculture Health Services
AT 9 8.5 7.7 11.2 8.3 8.7 6.4 4.7 6.7
CZ 15.4 17.3 13.1 19.6 8.8 10.3 16 19.3 16.6
DE 6.9 7.3 7.2 7.5 6.1 6 5.3 9
DK 6 5.8 7 7.3 7 3.7 4.8
EE 14.5 14.8 10 23.1 5.7 7.2 20.2 28.3 8.4
ES 6 9.5 6.9 5.9 2.9 6.9 7.1 5.5
FI 5 5.7 4.4 7.5 4.6 3.6 4.9 4.3 6.4
FR 2.3 2.5 2.3 1.5
IE 8 7 7 11 6 7 5 6 21
IT 8.9 12 8.6 11.7 6.8 5.6 6.6 6.1 10.5
LT 9.9 16.7 9.5 10.9 6 7 2.7 1.3 10.5
LV 8.1 8.9 5.2 10.5 4.9 9.4 4.8 3.3 3.4
MT 4.5 2.9 7.3 3.6 3 0.9 7 19.8
NL 9 10 8 10 4 8 8 7
PL 16.4 10.9 19.2 5.5 14.2 3 19.4
PT 14.3 12.7 11.2 15.9 16.3 14.2 6.2 5.7 28.8
RO 4.8 2.2 2.5 8.2 3.2 3 25.6 1.8 4.9
SE 7.3 9.8 7.6 8.5 5.3 4.6 5.8
SI 17.1 5.4 10.3 24.3 18.5 7 12.2 17.5 21.6
SK 9.9 16.5 4.6 11.8 9.6 2.2 19 8 10.2
Source: EUROSTUDENTS.
3.
The structure of student work
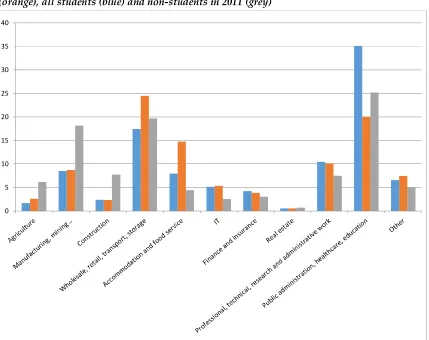
Figure 6. Average share of industrial sectors in student labour for those aged under 25 (orange), all students (blue) and non-students in 2011 (grey)
Source: Own calculations based on LFS data, average of EU member states.
Furthermore, the relative importance of individual economic sectors for student labour differs in individual countries (Table 9). In manufacturing centres such as the Czech Republic and Germany, 1-in-10 working students work in the manufacturing, mining and quarrying sectors. Meanwhile, in Greece or Bulgaria the share is just about 1% and student workers are mostly concentrated in accommodation and food services (particularly in Greece, where the share of the sector is 37%). In Ireland, Netherlands and the UK, the wholesale, retail and warehousing sector is very important.
Table 9. Share of students under 25 years among workers in ISCO levels 9, 6-8 and 5 in 2011
Manufacturing Wholesale, retail
Accommodation, food service
Professional, tech research
Public sector, health, education
AT 11.4 17.4 10.5 19.9 8.3
BE 8.7 22.2 15.6 26.2 6.9
BG 1.3 29.3 28.0 8.0 4.0
CY 5.3 27.5 13.0 17.6 3.8
CZ 16.8 10.3 9.4 22.4 13.1
DE 13.8 17.1 10.0 30.1 7.4
DK 4.6 22.4 11.8 30.6 9.6
EE 11.5 26.4 13.5 20.7 10.6
ES 7.5 20.8 18.7 21.9 13.0
FI 11.7 29.1 6.7 17.1 8.9
FR 11.8 27.7 9.1 18.5 7.4
GR 1.9 23.3 36.7 11.5 7.5
HU 10.7 24.2 11.3 20.6 4.4
IE 2.6 41.1 26.6 10.3 7.6
IT 8.7 20.0 21.8 18.5 12.5
LT 10.5 29.3 11.0 16.8 4.9
LU 11.5 15.4 19.2 26.9 3.9
LV 7.8 24.9 9.0 19.2 6.9
MT 1.7 11.0 20.3 30.5 3.4
NL 3.6 35.9 14.8 21.6 5.9
PL 14.0 26.0 7.6 18.9 4.0
PT 9.7 25.3 16.1 18.4 6.4
RO 10.4 29.5 3.8 10.4 9.0
SE 6.1 29.2 7.5 26.7 7.6
SI 15.9 21.8 13.3 13.8 8.4
SK 9.7 17.3 11.9 28.7 5.4
UK 4.6 36.6 20.3 15.9 9.5
EU27 8.7 24.5 14.7 20.1 7.4
The general distribution of student labour shows that most student workers tend to work in the top half of the ISCO job hierarchy, which seems to contradict assumptions connecting student work with low-skilled labour.
The situation is rather complex, however. Firstly, the massification trend in higher education has also been present at the PhD. level. Doctoral students often participate in highly complex work in fields such as education, healthcare and research. Nonetheless, the share of PhD. students in the entire population of student workers is rather marginal and skill distribution remains largely the same, even after excluding PhD. students.
students are more active in professional positions. The share of elementary occupations among younger students is nonetheless still relatively low (about 8%, see Figure 7).
[image:16.612.93.520.204.497.2]The relatively modest importance of low-skilled jobs for student employment contrasts with the general overrepresentation of young workers in low-skilled jobs due to their lack of experience, as noted by the literature (Kureková et al., 2012). Nonetheless, the share of students among young workers in elementary occupations is typically much lower than in the services and sales categories (although Austria and Denmark are notable exceptions).
Figure 7. Distribution of student (orange - all, blue - under 25) workers among ISCO skill levels in 2011
Note: Excluding occupations in the armed forces.
Source: Own calculation based on LFS data, average of EU member states.
The gender aspect strongly influences the presence of student workers across sectors. Women predominate in the public services, including in healthcare and education. This category is also dominated by students over 25 years. Meanwhile, sectors such as retail, accommodation and catering mostly employ younger students and their share in female student employment is slightly higher than the share in male student employment. Manufacturing and related jobs, as well as IT, are mostly the domain of male workers. Neither gender nor age seems to have a marked impact on the share of working students in professional, technical, research and administrative positions (Figure 8).
0 5 10 15 20 25 30 35 40
Managers Professionals Technicians and associate professionals
Clerical support workers
Service and sales workers
Skilled agricultural, forestry and fishery workers
Craft and related trades
workers
Plant and machine operators,
and assemblers
Figure 8. Share of selected industrial sectors in employment of male (blue) and female (orange) working students
Note: Lighter colours denote the under-25 age category. Excluded are the sectors that have less than 5% share of student employment.
Source: Own calculations based on EU LFS 2011 dataset.
About 30% of working students are employed in management and professional jobs (but the share is approximately 15% for students under the age of 25). An additional one-third of students work in technical, associated professional and clerical jobs. In this segment, service and sales jobs are very common, particularly for younger students; 42% of female working students aged under 25 and 28% of their male counterparts work in a service or sales job. The jobs in ISCO categories 5, 6 and 7 only employ male students, particularly younger ones. Finally, the elementary occupations are mainly performed by younger male students, but even in this demographic group, only 10% of student workers are present in these low-skilled positions (Figure 9).
There is a research gap in the literature regarding the role of gender in student work; nonetheless the notion that women enjoy an advantage in the jobs for which an emotional connection with clients is important has been advanced in contemporary gender studies literature. McDowell (2002), for example, argues that certain ‘masculine identity’ traits push men towards fields that are in decline in developed countries and thus lead them on the path of downward social mobility. Nonetheless, students already in management positions are more often male, in spite of female dominance in the professional positions as well as among university students as a whole.
0 5 10 15 20 25 30 35 40 45
Manufacturing, mining, quarrying and other industry
Wholesale, retail, transport, storage
Accommodation and food service
IT Professional, technical, research and administrative
work
Public administration,
Figure 9. Share of selected ISCO skill levels in employment of male (blue) and female (orange) working students
Note: Lighter colours denote under 25 age category. Occupations in the armed forces are excluded and ISCO levels 5-7 merged in one group.
Source: Own calculations based on EU LFS 2011 dataset.
Accommodation and food services, along with wholesale and retail, employ students across study fields, but particularly in the study field without a connection to specific jobs, such as social sciences and humanities (Table 10). One explanation for this phenomenon might be that the choice of study field often reflects the socio-economic background of the student (Duru-Bellat et al., 2008) and costs associated with humanities and social science education are lower than those associated with studies in STEM (Beblavý et al., 2013). Students who supplement their income with work in the retail or accommodation sectors might not be able to commit to the significantly higher number of working hours required to study STEM subjects.
Table 10. Share of selected industries in student workers per study field
Wholesale, retail, transport, storage
Accommodation and food service
All <25 All <25
Education 29.5 16.1 10.9 5.6
Humanities and art 31.4 21.1 18.4 12.1
Foreign languages 25.0 17.0 18.2 11.9
Social sciences, business and law 38.8 27.6 11.2 7.8
Science, mathematics 23.0 16.7 15.4 9.7
Computer science 26.5 20.8 11.4 6.4
Engineering, manufacturing, construction 22.0 20.1 5.3 4.7
Agriculture and veterinary 9.3 9.3 6.7 7.0
Health and welfare 25.1 14.8 11.2 6.1
Services 18.8 18.4 34.3 27.7
Source: Own calculations based on LFS data, average of EU member states.
0 5 10 15 20 25 30 35 40 45
Managers Professionals Technicians and associate professionals
Clerical support workers
Service and sales workers
Agriculture, craft and trade workers, plant
and machine operators and
assemblers
[image:18.612.94.528.511.701.2]Nonetheless, the high presence of the ‘soft fields’ students in the two service-oriented sectors does not support public concerns about ‘useless degrees’ leading to low-skilled work. The humanities and social sciences students seem to be particularly concentrated in the service and sales occupations, rather than on the bottom of the ISCO hierarchy. Meanwhile, compared to the students of these ‘soft’ disciplines, the share of STEM students in elementary occupations is slightly higher, although still relatively modest. In agricultural positions, trade and crafts and machine operators and assemblers, students of ‘hard’ fields are far more common (Table 11).
Table 11. Share of ISCO skill levels in student workers aged under 25 per study field
1 2 3 4 5 6 7 8 9
Education 1 19 11 9 47 2 2 1 8
Humanities and art 0 13 11 10 46 2 5 2 11
Foreign languages 0 18 9 18 43 0 1 1 9
Social sciences, business and law 1 6 15 20 41 2 2 2 10
Science, mathematics 1 18 15 9 34 4 2 4 13
Computer science 1 15 20 12 25 4 7 5 11
Engineering, manufacturing, construction 1 4 12 3 10 4 52 4 11
Agriculture and veterinary 1 2 5 4 13 55 2 4 16
Health and welfare 0 14 18 6 50 1 1 1 9
Services 1 2 6 7 62 3 3 3 12
Note: Occupations are ranked per complexity 1=managers, 9=elementary occupations.
Source: Own calculations based on EU LFS 2011 dataset, excluding occupations in the armed forces.
Overall, while students of fields with a clear application are less likely to work in general skills fields such as retail, accommodation or food services, the skills developed in social sciences and humanities departments are in demand for sales and service-type jobs, which enables the students of these fields to avoid low-skilled work.
Figure 10. Share of workers in part-time, temporary and unusual contracts among students under 25 (grey), students in general (orange) and non-students (blue)
Source: Own calculations based on EU LFS 2011 dataset average of EU member states.
Across industries students working under these very flexible contracts display little desire to work more hours. Typically, only about 10% of students would like to work more hours than they already do. Indeed, EUROSTUDENT data show that students in the EU generally consider it acceptable to work about 10 hours per week and quickly become dissatisfied if they are asked to work more (Figure 11).
Figure 11. Satisfaction levels per average number of working hours, all university students
Source: Own calculations based on EUROSTUDENT data.
Furthermore, the LFS data show that only about 5-7% student workers in part-time jobs are looking to change jobs, suggesting that such arrangements are actually in line with students’ preferences. Nonetheless, the share of part-timers differs radically across industries and skill
0 10 20 30 40 50 60
part time temporary shifts Saturday Sunday Evenings Nights
0 2 4 6 8 10 12 14 16 18
[image:20.612.96.538.469.657.2]levels. Part-time work is very common in elementary occupations and sales and service jobs in the wholesale and retail accommodation and food service sectors, while in professional and technical positions, particularly IT or professional occupations, the share of part-time workers among students is around 30%.
[image:21.612.96.539.217.489.2]Not only are the students more often employed on temporary assignments than non-students, but students under 25 years of age more commonly work with very flexible contracts of less than 3 months (Figure 12).
Figure 12. Share of contracts divided by length among working students under 25 (grey), students in general (red) and non-students (blue)
Source: Own calculations based on 2011 EU-LFS data, average of EU member states.
Over time, the average ISCO level of student jobs has remained largely the same in Europe. But in countries like Luxembourg, where the average ISCO of student jobs in 2004 was very high, there was some decline. Meanwhile, in countries like Denmark, where students were more likely to hold less complex jobs, the mean ISCO level has actually grown, suggesting that student jobs tend to appear in the middle of the ISCO hierarchy (Table 12). Meanwhile, student jobs do not appear to become more diverse; the standard deviation being quite stable at 1.9.
Table 12. Arithmetical mean value of the ISCO classification skill of under 25 student job-holders, per country
2004 2005 2006 2007 2008 2009 2010 2011
AT 4.2 4.4 4.4 4.4 4.3 4.4 4.2 4.2
BE 4.0 4.6 4.5 4.5 4.3 4.3 4.5 4.5
BG 4.8 4.7 4.4 4.5 4.5 4.6 4.5 4.7
CY 4.1 3.7 3.9 4.3 4.7 4.4 4.2 4.7
CZ 3.9 3.7 3.8 4.0 4.2 4.0
0 5 10 15 20 25 30 35
Less than one month
1 to 3 months
4 to 6 months
7 to 12 months
13 to 18 months
19 to 24 months
25 to 36 months
[image:21.612.94.525.638.727.2]DE 4.3 4.3 4.6 4.2 4.3 4.3 4.4 4.5
DK 5.0 4.9 4.8 4.9 4.8 4.9 4.8 4.7
EE 3.9 3.7 3.9 3.9 4.2 4.1 4.0 4.4
ES 4.6 4.6 4.5 4.5 4.4 4.4 4.7 4.5
FI 5.0 5.1 5.1 5.1 5.0 4.8 5.1 4.9
FR 4.0 4.1 4.2 4.3 4.2 4.2 4.2 4.4
GR 4.3 4.6 4.4 4.5 4.5 4.6 4.6 4.6
HU 3.6 3.7 3.7 4.3 3.9 3.7 3.9 4.2
IE 4.8 4.7 4.9 4.6 4.7 4.7 4.9 5.0
IT 4.5 4.4 4.4 4.4 4.5 4.5 4.5 4.4
LT 3.7 3.7 4.2 4.2 4.3 4.2 4.6 4.4
LU 3.0 3.0 3.3 2.0 3.0 3.6 3.6 4.4
LV 4.3 3.8 3.8 4.1 4.0 4.0 4.2 4.4
MT 3.2 3.6 3.8
NL 5.1 5.2 5.2 5.0 4.9 4.9 5.0 5.1
PL 4.7 4.7 4.8 4.7 4.6 4.6 4.5 4.6
PT 3.9 4.2 4.1 4.1 4.2 4.3 4.5 4.4
RO 4.2 4.5 4.6 4.7 4.4 4.4 4.4 4.4
SE 4.8 4.9 5.0 4.9 4.9 4.8 4.9 4.9
SI 4.9 5.0 5.1 5.2 5.1 5.1 5.2 5.3
SK 3.5 3.7 3.8 3.7 3.8 3.9 4.1 4.2
UK 4.9 4.9 4.9 4.9 4.8 4.9 4.9 4.9
EU 27 4.3 4.4 4.4 4.4 4.4 4.4 4.4 4.5
Source: Own calculations based on 2011 EU-LFS.
The structure of jobs that attract a large share of young student workers is most similar to the job structure of medium-educated workers in terms of ISCO skill classification of occupations. Students are far less present in the low- skilled jobs than are low-educated non-students (Figure 13).
Students are particularly present in service and sales jobs (ISCO 5). The share of these jobs in the student worker population is higher by more than 15 percentage points than among secondary educated non-students. The difference is even greater when non-students with high and low educational attainment are considered. This is also the case for clerical and support workers (ISCO 4), although to a lesser degree.
Meanwhile, older students typically hold similar positions to highly educated non-students. This suggests that the main pressure caused by the increased number of student workers lies not in low-skill jobs, but rather in the medium-skill occupations, particularly service and sales positions.
Figure 13. Percentage difference between the share of ISCO aggregated occupation groups (excluding armed forces) in the low (blue), medium (red) and highly (grey) educated non-student workforce and in the EU27 non-student workforce
Note: Positive values mean the ISCO category employs higher share of all workers in the particular education group, while negative values mean that the share of student workers employed in this category is higher than share of non-student workers with the associated educational attainment.
Source: Own calculations based on LFS data, average of EU member states.
Meanwhile, sector-wise there is a strong correlation between the distribution of the workforce among sectors between all students (but not just students under the age of 25) and non-students with high educational attainment. Younger non-students tend to work in similar sectors to the secondary educated workers, however the correlation is not significant (Table 13). The correlations between sectors where low-educated workers and students find employment is very low and not statistically significant. This underlines the notion that the barrier between student and (professional) worker is becoming rather thin, particularly among older students.
Table 13. Correlation coefficients between share of workers in sectors among student and non-students of low, medium and high educational attainment
Low Medium High
Students .174 .352 .830*
Students <25 .213 .405 .281
Source: Own calculations based on 2011 EU LFS data, averages of EU member states. *-significant at 0.01
[image:23.612.93.523.654.697.2]Based on the findings above, it is clear that it is mainly middle-educated workers and workers in wholesale, retail, accommodation and food service sectors that are the ones who typically work alongside students. Nevertheless, there is no sign of student workers pushing the middle-educated non-students out of these sectors or towards low-skilled jobs. There is no evidence of the number of students influencing the presence of medium-educated workers in either wholesale and retail or accommodation and food sectors. Furthermore, there is actually a positive correlation between the share of medium-skilled jobs in services and sales and the number of students and negative for the elementary occupations. Neither of these correlations is significant, however. The situation remains the same if the analysis is limited to under 25 middle-educated non-student workers (Table 14).
Table 14. Correlation coefficients between the number of working students and shares of selected sectors and ISCO skill levels in the medium-educated non-student labour force
All medium educated non-students
Medium educated non-students <25
Service and sales 0.253 0.3257
Elementary occupations -0.3337 -0.0123
Wholesale and retail -0.3116 0.0796
Accommodation and food
-0.021 -0.0622
Source: Own calculations based on 2011 EU LFS data, averages of EU member states.
Another possible effect could be that student workers are actually crowding out workers with low education to low-skilled work and out of certain sectors, such as retail, accommodation and food services. Nonetheless, the correlations are positive and significant for both industries and for the share of service and sales jobs, and slightly negative and non-significant for elementary occupations (Table 15).
Table 15. Correlation coefficients between the number of working students and shares of selected sectors and ISCO skill levels in the low educated non-student labour force
All low educated non-students Low educated non-students <25
Service and sales 0.5632* 0.2549**
Elementary occupations -0.321 -0.09
Wholesale and retail 0.5825** 0.6024***
Accommodation and food 0.4133* 0.4114**
Source: Own calculations based on 2011 EU LFS data, averages of EU member states. Significance * <0.05, ** <0.01, *** <0.001
[image:24.612.95.545.495.574.2]Meanwhile, particularly in east European countries, the low employment rate goes hand-in-hand with the low share of working students on the labour market.
Table 16. Share of students on the labour market and employment rate of low and medium skilled non-students
Share of student workers Low Low<25 Medium Medium<25
AT 4.2 49.8 39.8 80.8 78.1
BE 1.5 38.1 12.4 60.7 72.3
BG 1.3 28.5 4.4 51.0 67.3
CY 2.3 49.6 11.6 37.9 70.4
CZ 1.9 20.8 3.6 66.8 72.6
DE 2.6 52.5 45.6 81.6 77.8
DK 5.4 56.3 50.3 72.4 80.3
EE 3.9 26.6 10.8 50.8 70.7
ES 3.3 46.1 19.1 41.9 66.9
FI 5.3 38.0 19.3 57.9 74.4
FR 1.5 43.8 13.0 57.1 71.3
GR 1.2 46.5 10.3 38.8 60.3
HU 1.3 24.1 5.2 49.4 63.0
IE 3.2 35.2 7.3 49.4 63.7
IT 1.5 41.8 10.3 47.9 69.8
LT 2.4 11.9 3.1 42.6 65.2
LU 2.0 43.5 10.8 76.1 70.5
LV 0.9 28.0 9.0 47.6 64.7
MT 4.0 46.2 36.6 72.0 78.2
NL 4.9 62.9 57.9 83.3 81.7
PL 3.1 22.4 6.1 48.7 61.1
PT 3.3 56.8 20.4 59.3 76.0
RO 0.8 39.5 13.4 43.4 64.6
SE 4.1 53.0 22.6 69.9 81.5
SI 4.3 34.7 13.6 60.5 68.2
SK 1.7 15.2 2.3 59.2 67.2
UK 3.9 52.7 32.7 54.9 72.4
EU 27 2.8 39.4 18.2 57.8 70.7
Source: Own calculations based on 2011 EU LFS data.
4.
Conclusion
As the massification of tertiary education progresses, the share of tertiary students in the workforce continues to rise. Even at the time of the Great Recession, which resulted in a massive destruction of jobs that affected young people in particular, the student employment rate does not appear to have been hit particularly hard.
students tend to be concentrated in the growing service sectors rather than sectors such as manufacturing or agriculture, which are in decline in Europe.
It would be a mistake to associate student workers exclusively with young people, however. In many EU member states, it is common that individuals participate in tertiary education well into their 30s. Students over the age of 25 are often workers rather than students. They work in healthcare, education, professional, technical, and research fields, often on a professional level. This makes this group similar to the tertiary-educated non-students, with whom they commonly share workplaces.
Younger students tend to predominate in fields such as accommodation and food services, and wholesale and retail in which there is a relatively low barrier to entry and a high demand for general skills and flexibility. Even the younger students do not typically work in the so-called ‘low-skill’ jobs, however, but rather in the medium-skill positions, such as services and sales.
As far as the gender aspect is concerned, the majority of college and university students in Europe are now women. Female students are also more likely to work in the service sectors and less likely to do low-skilled work than their male counterparts. Nonetheless, the rare management positions available for students and jobs in the IT sector are predominantly filled by male students.
As for the study field, the individual specialisations clearly differ in terms of the extent of student work and the average time students spend working. The study field also tends to influence the sector of work, in particular for older students. Nonetheless, there is quite some degree of variance between the fields, both in terms of working time and the nature of the work.
Given their position on the labour market, student workers tend to be present in the occupations typically held by workers with secondary (mainly younger students) to tertiary (predominantly older students) workers. The low-skill jobs which employ low-educated workers do not seem to employ particularly high numbers of students.
No crowding out effect between the presence of students and opportunities available for medium- and low-skilled workers has been identified. In spite of the significant presence of student workers in sales and service jobs in sectors such as retail, accommodation and food services, there is no evidence that medium-educated workers, who dominate the non-student workforce in this segment of the labour market are being pushed out to low-skill jobs. Meanwhile, the low-educated workers, who typically work in low-skill positions, encounter very limited competition from student workers and there is no significant negative effect either.
Overall, even enrolling in higher education has an important labour market consequence as it helps escape low-skill, precarious job positions. European policies to improve access to higher education are, therefore, reasonable. The suspected negative impact of student work on low educated workers has not been confirmed.
References
Beblavy, Miroslav, Sophie Lehouelleur, and Ilaria Maselli. 2013. “Useless Degrees or Useless Statistics?: A Comparison of the Net Present Value of Higher Education by Field of Study in Five European Countries, Useless Degrees or Useless Statistics?: A Comparison of the Net Present Value of Higher Education by Field of Study in Five European Countries” (www.voced.edu.au/content/ngv58859).
Brunello, Giorgio, and Martin Schlotter. 2011. Non Cognitive Skills and Personality Traits: Labour
Market Relevance and Their Development in Education & Training Systems. IZA DP No. 5743. Curtis, Susan, and Rosemary Lucas. 2001. “A Coincidence of Needs?: Employers and
Full-Time Students.” Employee Relations 23 (1): 38–54. doi:10.1108/01425450110366264. Duru-Bellat, Marie, Annick Kieffer, and David Reimer. 2008. “Patterns of Social Inequalities in
Access to Higher Education in France and Germany.” International Journal of Comparative Sociology 49 (4-5): 347 –368. doi:10.1177/0020715208093081.
Eichhorst, Werner, Tito Boeri, Michela Braga, An De Coen, Vincenzo Galasso, Maarten Gerard, Michael J. Kendzia, et al. 2013. Combining the Entry of Young People in the Labour Market
with the Retention of Older Workers. IZA Research Reports 53. Institute for the Study of Labor (IZA) (http://ideas.repec.org/p/iza/izarrs/53.html).
Eurostat (2009): Youth in Europe
(http://pjp- eu.coe.int/documents/1017981/1668203/YouthinEurope.pdf/40f42295-65e4-407b-8673-95e97026da4a).
Eurostat (2010): EU Labour Force Survey: Explanatory Notes. (http://epp.eurostat.ec.europa.eu/portal/page/portal/employment_unemployment_l fs/documents/EU_LFS_explanatory_notes_from_2011_onwards.pdf).
Gruber, Jonathan, and David A. Wise. 2010. Social Security Programs and Retirement around the
World: The Relationship to Youth Employment. University of Chicago Press. (www.google.com/books?hl=en&lr=&id=IWJAA3RqdHsC&oi=fnd&pg=PR7&dq=gru ber+and+wise+2010&ots=Y7chUI9t5I&sig=qwifGq-R52xrZeeLu6S3c8shR1w).
Häkkinen, Iida. 2006. “Working While Enrolled in a University: Does It Pay?” Labour Economics, Labour Economics, 13 (2): 167–189.
Hall, Ralph. 2010. “The Work–study Relationship: Experiences of Full‐time University Students Undertaking Part‐time Employment.” Journal of Education and Work 23 (5): 439– 449.
IMF. 2010. World Economic Outlook (WEO) - Rebalancing Growth, Chapter 3: Unemployment dynamics during recessions and recoveries. International Monetary Fund
(www.imf.org/external/pubs/ft/weo/2010/01/).
ILO. 2012: International Standard Classifi cation of Occupations.
(www.ilo.org/wcmsp5/groups/public/---dgreports/---dcomm/---publ/documents/publication/wcms_172572.pdf).
Kureková, Lucia, Miroslav Beblav{, and Corina Haita. 2012. “Qualifications or Soft Skills? Studying Demand for Low-Skilled from Job Advertisements.” NEUJOBS Working Paper
No. 4.3.3.
Kureková, Lucia, Corina Haita, and Miroslav Beblavý. 2012. Being and Becoming Low-Skilled: A
Levy, Frank, and Richard J. Murnane. 2003. The Skill Content of Recent Technological Change: An
Empirical Exploration. The Quarterly Journal of Economics. November 2003.
Levy, Frank, and Richard J. Murnane. 2005. How Computerized Work and Globalization Shape
Human Skill Demands.
Lindsay, C .2005. ‘McJobs’, ‘good jobs’ and skills: job-seekers’attitudes to low-skilled service work, Human Resource Management Journal 15(2):50-65.
Maxwell, Nan L. 2006. The Working Life: The Labor Market for Workers in Low-Skilled Jobs. WE
Upjohn Institute.
http://www.google.com/books?hl=en&lr=&id=3cZO0cTOOTMC&oi=fnd&pg=PR9& dq=the+working+life,+maxwell&ots=uS9l7g2Fpk&sig=KOG0NPHh0TfdJvfqc8XU70N ijeQ.
McDowell, Linda. 2002. Transitions to work: masculine identities, youth inequality and labour market
change. Gender, Place and Culture, 9(1), 39-59.
Mills, Melinda; Tsang, Flavia; Präg, Patrick; Kai, Ruggeri ; Miani Celine and Stijn Hoorens 2014. Reconciling work, private and family life in Europe http://ec.europa.eu/justice/gender-equality/files/documents/140502_gender_equality_workforce_ssr_en.pdf
Moreau, Marie-Pierre, and Carole Leathwood. 2006. “Balancing Paid Work and Studies: Working (-Class) Students in Higher Education.” Studies in Higher Education 31 (1): 23– 42.
Orr, Dominic, Klaus Schnitzer, and Edgar Frackmann. 2008. Social and Economic Conditions of Student Life in Europe. Synopsis of Indicators. Final Report. Bielefeld: W. Bertelsmann Verlag GmbH & Co. KG.
Quintini, Glenda, and Sébastien Martin. 2006. Starting Well or Losing Their Way? OECD Social, Employment and Migration Working Papers. Paris: Organisation for Economic
Co-operation and Development.
http://www.oecd-ilibrary.org/content/workingpaper/351848125721.
Pollmann-Schult, Matthias. 2005. “Crowding-out of Unskilled Workers in the Business Cycle: Evidence from West Germany.” European Sociological Review 21 (5): 467–80.
Tijdens, Kea; Sprenger, Wim; van Klaveren, Martin; Ramos Martin, Nuria: Older Workers,
Wibar Report. No. 4
(www.wageindicator.org/documents/WIBAR%20documents/WIBAR-No4_Olderworkers-update2_070720.pdf).
Quintini, Glenda, and Sébastien Martin.. 2014. Same Same but Different: School-to-Work
Transitions in Emerging and Advanced Economies. OECD Social, Employment and Migration Working Papers 154. http://www.oecd-ilibrary.org/social-issues-migration- health/same-but-different-school-to-work-transitions-in-emerging-and-advanced-economies_5jzbb2t1rcwc-en
Quintini, Glenda and Manfredi Thomas (2009),“Going Separate Ways? School-to-Work
Transitions in the United States and Europe, OECD Social, Employment and
MigrationWorking Papers, No. 90, OECD
Publishing.http://dx.doi.org/10.1787/221717700447
Migration Working Papers No. 154, OECD, Paris ( www.oecd-ilibrary.org/social-issues- advanced-economies_5jzbb2t1rcwc-en).
Pollmann-Schult, Matthias (2005), “Crowding-out of Unskilled Workers in the Business Cycle: Evidence from West Germany”, European Sociological Review, Vol. 21, No. 5, pp. 467–480.
Tijdens, Kea, Wim Sprenger, Martin van Klaveren, and Nuria Ramos Martin (2007), “Older
Workers”, Wibar Report No. 4
APPENDIX
Table a.1. Number of students in the EU 27 (in thousands)
2001 2002 2003 2004 2005 2006 2007 2008 2009 2010 2011
AT 265 224 230 239 244 253 261 285 308 350 362
BE 359 367 375 386 390 394 394 402 425 445 462
BG 247 228 231 229 238 244 259 265 274 287 285
CY 12 14 18 21 20 21 22 26 31 32 32
CZ 260 285 287 319 336 337 363 393 417 437 446
DE 2084 2160 2242 2331 2269 2290 2279 2245 2439 2556 2763
DK 191 195 202 217 232 229 232 231 235 241 259
EE 58 61 64 66 68 68 69 68 68 69 69
GR 478 529 562 597 646.6 d
653 603 638 : 642 661
ES 1834 1833 1841 1840 1809 1789 1778 1781 1801 1879 1951
EU 27
1651 7
1713 9
1776 2
1823 3
18530 1878 3
1888 4
1903 7
1947 0
1984 1
2012 9
FI 280 284 292 300 306 309 309 310 297 304 308
FR 2032 2029 2119 2160 2187 2201 2180 2165 2173 2245 2259
HU 331 354 391 422 436 439 432 414 398 389 382
IE 167 176 182 188 187 186 190 179 183 194 196
IT 1812 1854 1913 1987 2015 2029 2034 2014 2012 1980 1968
LT 136 149 168 183 195 199 200 205 211 201 187
LU 3 3 3 : : 3 : : : : 5
LV 103 111 119 128 131 131 130 128 125 113 104
MT 7 7 9 8 9 9 10 10 10 11 12
NL 504 517 527 543 565 580 590 602 619 651 780
PL 1775 1906 1983 2044 2118 2146 2147 2166 2150 2149 2080
PT 388 397 401 395 381 367 367 377 373 384 396
RO 533 582 644 686 739 835 928 1057 1098 1000 872
SE 358 383 415 430 427 423 414 407 423 455 464
SI 92 99 102 104 112 115 116 115 114 115 107
SK 144 152 158 165 181 198 218 230 235 235 226
UK 2067 2241 2288 2247 2288 2336 2363 2330 2415 2479 2492
CENTRE FOR EUROPEAN POLICY STUDIES, Place du Congrès 1, B‐1000 Brussels, Belgium Tel: 32 (0)2 229 39 11 • Fax: 32 (0)2 219 41 51 • www.ceps.eu • VAT: BE 0424.123.986
ABOUT CEPS
Founded in Brussels in 1983, the Centre for European Policy Studies (CEPS) is widely recognised as the most experienced and authoritative think tank operating in the European Union today. CEPS acts as a leading forum for debate on EU affairs, distinguished by its strong in-house research capacity, complemented by an extensive network of partner institutes throughout the world.
Goals
• Carry out state-of-the-art policy research leading to innovative solutions to the challenges facing Europe today,
• Maintain the highest standards of academic excellence and unqualified independence • Act as a forum for discussion among all stakeholders in the European policy process, and • Provide a regular flow of authoritative publications offering policy analysis and
recommendations,
Assets
• Multidisciplinary, multinational & multicultural research team of knowledgeable analysts, • Participation in several research networks, comprising other highly reputable research
institutes from throughout Europe, to complement and consolidate CEPS’ research expertise and to extend its outreach,
• An extensive membership base of some 132 Corporate Members and 118 Institutional Members, which provide expertise and practical experience and act as a sounding board for the feasibility of CEPS policy proposals.
Programme Structure
In-house Research Programmes
Economic and Social Welfare Policies Financial Institutions and Markets
Energy and Climate Change
EU Foreign, Security and Neighbourhood Policy Justice and Home Affairs
Politics and Institutions Regulatory Affairs Agricultural and Rural Policy
Independent Research Institutes managed by CEPS
European Capital Markets Institute (ECMI) European Credit Research Institute (ECRI)
Research Networks organised by CEPS
European Climate Platform (ECP) European Network for Better Regulation (ENBR)
European Network of Economic Policy Research Institutes (ENEPRI) European Policy Institutes Network (EPIN)