How returns from tertiary
education differ by field of study
Implications for policy-makers and students
Miroslav Beblavý, Sophie Lehouelleur and
Ilaria Maselli
No. 411 / July 2015
Abstract
With the huge growth in enrolment in higher education, the key question facing young people today is not so much “what to study” as “whether to study”. Taking a methodologically innovative approach, this paper measures the net present value of university education and compares returns from studying a range of different subjects. We use data from 5 European countries (France, Italy, Hungary, Poland and Slovenia) and include (opportunity) costs in the computation. Results suggest that enrolling in science, technology, engineering and mathematics (STEM) courses is often not the best investment for students, especially female students. In choosing what to study, therefore, students are taking decisions that are consistent with their own private returns. This suggests that policy-makers should consider changing the incentives offered if they wish to change students’ behaviour.
JEL CLASSIFICATION: I124, J31,
CEPS Working Documents are intended to give an indication of work being conducted within CEPS’ research programmes and to stimulate reactions from other experts in the field. The opinions expressed in this document are the sole responsibility of the authors and do not necessarily represent the official position of CEPS.
This work has been carried out in the context of the NEUJOBS project, financed by the European Commission under the 7th Framework Programme. We are grateful for the funding opportunity.
ISBN 978-94-6138-476-8
1. “What to study” matters in higher education ... 1
2. A review of the literature on returns from education ... 2
3. How our methodology departs from the literature ... 4
4. Results and discussion ... 8
5. Subject selection – explaining students’ decisions ... 13
1
How returns from tertiary education
differ by field of study
Implications for policy-makers and students
Miroslav Beblavý, Sophie Lehouelleur and Ilaria Maselli
*CEPS Working Document No. 411 / July 2015
1.
“What to study” matters in higher education
When higher education was an elite pursuit, the fact of participating in tertiary education mattered more than the area of study. However, since the 1960s, the number of students in higher education in Europe has grown considerably and recently the European Union set itself a goal of 40% of young people (in the 30-34 age group) obtaining a higher-education degree by 2020. It is reasonable to expect that as the number of university graduates increases, so does the diversity of their skills. Different labour market outcomes can be expected for graduates from different disciplines. To what extent has this happened and what are the policy implications?
Policy-makers and policy analysts at European level appear to have clear answers, which point to a lack of science, technology, engineering and mathematics (STEM) skills and the need to train more students in these subjects. EUROPE 2020, the flagship EU policy strategy document, emphasised that “at national level, Member States will need to ensure a sufficient supply of science, maths and engineering graduates”.1 This is based on research that shows that “the current supply of STEM skills is considered to be insufficient and when combined with forecast growth in demand for STEM skills, these shortages present a potentially significant constraint on future economic growth in Europe”.2 At the same time, applied research emphasises that “those with specific degrees do better than those with more general degrees (arts and humanities)”.3
The choice of field of study also has a gender dimension. While there are now more female students than male students in tertiary education, the proportion of female students in science, technology, engineering and mathematics remains only around one third, with relatively little variation in different countries (see Table 1). The European Commission recently linked the fact that “there are great differences in the choice of study field between women and men” to there being “a key challenge for Member States and for higher education institutions [in attracting] a broader cross-section of society into higher education”.4 The EC even described the need to make STEM education more attractive to females as “a well-known… challenge”.5
* Miroslav Beblavý is Associate Senior Research Fellow at the Centre for European Policy Studies and
Professor at the Comenius University. Sophie Lehouelleur was a Leonardo da Vinci intern at CEPS. Ilaria Maselli is Research Fellow at CEPS.
1 European Commission (2010), p. 13.
2 European Commission (2012a), p. 6.
3 CEDEFOP, The skill matching challenge (2010), p. 11.
4 European Commission (2012c), p. 22.
Table 1. Proportion of female graduates in STEM, 2010
Country % of female graduates of all STEM graduates
EU (27 countries) 33.3
France 28
Italy 39.8
Hungary 30.1
Poland 39.4
Slovenia 30.1
Note: 2008 for France and Italy.
Source: Eurostat.
This leads to a puzzle – while studying “hard” subjects such as STEM leads to better employment and pay prospects, interest by students is “insufficient”. This points to irrational decision-making by students or lack of relevant information or, in the case of women and STEM, to an unfortunate legacy of the past.
Our paper aims to partially solve the puzzle using data from 5 European countries (France, Italy, Hungary, Poland and Slovenia). We contend that the current research examines only part of the equation because it tends to look at only some of the benefits of studying STEM subjects (employment prospects and graduate salaries, for example). Private returns to education (what an individual gets out of education, from a financial point of view) should include a broader set of variables. The key variable is the time cost to students of their studies, a factor which heavily influences their opportunities for doing paid work while studying. We demonstrate that once these factors are taken into account, together with post-graduation salaries and a proper discount rate, much of the puzzle is explained. In the short- to medium-term after graduation, STEM careers do not make as much financial sense as the headline numbers suggest, and this is particularly true for women. On the other hand, social studies do make sense financially, thanks to the combination of good returns and low costs. Our findings seem to suggest both an important methodological innovation and its policy application.
The paper itself is organised as follows: in section 2 we review the existing literature, in section 3 we explain the methodology in detail and in section 4 we give our results. In the last section we examine and interpret students’ decisions and provide policy recommendations.
2.
A review of the literature on returns from education
There is a huge literature on the rate of return to education that started with the work of Becker (1964) and Mincer (1974), and then became more and more sophisticated. We are interested in particular in two growing branches.
The second branch of the literature tries to compute returns by using alternative methods to the traditional Mincer approach. These borrow indicators from the financial world such as the internal rate of return (IRR) of the net present value (NPV hereafter).
We focus on private returns to education – what an individual gets out of education (from a financial point of view). Early studies which broke down returns by field of study focused essentially on North America6 and the UK.7 Some recent studies focus on Continental Europe, including Germany (Kim & Kim, 2003; Grave & Goerlitz, 2012), France (Goudard & Giret, 2010), Italy (Buonanno & Pozzoli, 2009), Greece (Livanos & Pouliakas, 2008), Ireland (Kelly, O’Connell & Smyth, 2010), Slovenia (Bartolj, Ahcan, Feldin & Polanec, 2012) and Czech Republic (Münich, Svejnar & Terrell, 2005). Studies are often conducted at national level and for this reason, it is difficult to make direct comparisons. Overall, they tend to find that returns in scientific and technical fields exceed those in education, arts and humanities. Using data from the European Labour Force Survey (2004-2005) in 22 European countries, Reimer, Noelke and Kucel (2008) show that humanities graduates are at higher risk of unemployment than graduates from other fields. Additionally, the more students graduate from universities, the greater the differences in labour market chances of graduates from different fields.
If we accept the idea that education is an investment, the risk element should not be ignored. Secondary-school leavers need to take a number of decisions with limited information when they apply for university: they assess their risk of dropping out, calculate costs, evaluate gains in terms of labour market opportunities and try to assess the future impact of technology. All of these elements may have an impact on the choice of field of study. Fields allowing high wages are typically considered more challenging and are characterised by higher drop-out rates (De Paola & Gioia, 2011; Leppel, 2001). De Paola and Gioia (2011) find that risk-averse students are more likely to enrol in humanities or engineering than social sciences. The more able ones will opt for engineering where dropout rates are higher and pay and job prospects are better. The less able will prefer the humanities track to be sure of completing their studies.
The literature on fields of study also examines gender differences. Indeed, the gender gap can be explained partly by differences in qualifications between gender groups and by differences in pay among individuals with similar qualifications. These two issues can be tested by analysing the returns of education by field of study. Kim and Kim (2003) observe that women and men are asymmetrically distributed across fields of study with women more concentrated in disciplines such as humanities, education and business, which offer lower lifetime earnings; men are more strongly represented in disciplines such as mathematics, engineering and natural sciences.
This segregation varies dramatically across countries. Interestingly, Scandinavian countries show the highest rate of segregation, especially in engineering and natural sciences (Bradley, 2000).8. Looking at university courses followed in the UK and Germany, Machin and Puhani (2003) found that subject selection accounts for 9 - 19% of the gender wage differential among graduates; this is consistent with findings from Livanos and Pouliakas (2008) - 8.4%
6 Vaillancourt (1995), Stager (1996), Arcidiacono (2004), Finnie & Frenette (2003), Stark (2007).
7 Blackaby, Murphy & O’Leary (1999); Blundell, Dearden, Goodman & Reed (2000); Bratti & Mancini
(2003), O’Leary & Sloane (2005), Walker & Zhu (2011), Chevalier (2011).
for Greece. The work of O’Leary and Sloane (2005) and Finnie and Frenette (2003), using a cohort approach to assess these findings in the UK and Canada respectively, shows that the impact of study choices on the gender wage gap has decreased considerably since the 1970s just as women's choices have converged with men’s. However, even if we still observe a slight but continuous increase in the share of female participation in traditional male- dominated fields, the segregation remains remarkably stable (Kim & Kim, 2003; Bradley, 2000), and can only explain a very small part of the gender gap (O’Leary & Sloane, 2005). This convergence pattern in the gender gap followed a different path in transition countries. As noted by Gáti and Róbert (2011), in Poland, Hungary and Slovenia, women are overrepresented in the fields of social sciences, health, business, economics and law, much as they are in Western Europe. Early in the transition period, this helped to bring about a reduction in the gender gap thanks to a boom in the professions related to these fields. As a consequence, the position of female graduates in the labour market improved in Bulgaria (Giddings, 2002), Estonia and Slovenia (Orazem & Vodopivec, 2000). However, over the years, this early advantage disappeared slightly, a trend driven also by increasing earnings differences within fields (Bartolj et al., 2012).
3.
How our methodology departs from the literature
The most common method used in the literature to calculate return on education is the econometric approach of the so-called Mincer equation, which estimates the impact on wages of an additional year of schooling. This procedure does not come without problems, not least the difficulty of measuring an individual’s innate cognitive abilities. Hence abler students may opt for more difficult subjects. Kelly, O’Connell and Smyth (2010), for instance, find that the field of study has a marginal effect on the earnings of abler students.
What the Mincer equation does not do is consider the cost of education, which can strongly influence educational decisions (Usher, 2005). Boarini and Strauss (2010) compare the private rates of return in 21 OECD countries and find that even if labour market premiums are the main driver of returns, other factors are significant too: cost, duration of studies and taxation rates vary considerably from one country to another.
A more recent approach to the study of returns consists of borrowing financial indicators. This can be labelled as “an investment approach” (OECD, 2012). Instead of a “wage premium”, NPV computes a “labour market premium”. This allows for the examination of the different components of IRR/NPV, in particular the effect of costs, study length and the probability of employment (Martins, Boarini, Strauss & de la Maisonneuve, 2009).
Overall, as the OECD (2012) explains: “Apart from availability of data, the main difference between the two approaches is that the investment approach is forward-looking (although historical data are typically used), whereas an econometric approach tries to establish the actual contribution of education to gross earnings by controlling for other factors that can influence earnings and returns… As the investment approach focuses on the incentives at the time of the investment decision, it is prudent not to remove the effects of (controlling for) other factors such as work characteristics, as these are not known ex-ante and could be seen as part of the average returns that an individual can expect to receive when deciding to invest in education.” (OECD, 2012, p. 167)
using the NPV approach has been published for several years by the OECD. We generally follow their methodology with two caveats which also constitute the main value added of this paper:
- the OECD data do not distinguish between the different fields. They calculate a single value for each country, differentiated only by gender. Our paper focuses on differences by fields of study
- Our paper factors in time use, meaning that we use information on how many years students remain in education and how many hours they spend in private study and classes and in small jobs. We use this information to calculate the opportunity cost: we assume the number of hours they spend studying is the same as the number they would work if they were not students.
In other words, we include, on the cost side, the direct costs of education and foregone earnings. On the benefit side, we include gross earning benefits, the income tax effect and the social security contribution effect.
We also decided to base our estimate on actual earnings data from the five-year period following graduation rather than estimate a lifetime profile, as the OECD and other studies do. The disadvantage of this approach is that it provides only a short- to medium-term view. However, its advantage is that since lifetime earnings data are not available by field of study, any imputation would be essentially guesswork. Additionally, if we are primarily interested in student choices, then the 8-11 year cost and benefit horizon this provides (time spent studying + five years after) is relevant given the likely high lifetime discount rates and limited horizons. We also utilise the results cautiously, looking not at the numerical values themselves, but their relative positions and differences.
We rely primarily on survey data collected in the HEGESCO and REFLEX projects9 for which more than 43,000 graduates in 20 countries were surveyed five years after their graduation. Reference populations are the cohort of graduates in France and Italy from the year 2000 (surveyed in 2008) and the 2002/3 cohort from Hungary, Poland and Slovenia (surveyed in 2008). We complement them with data drawn from the European Labour Force Survey (aggregate data accessible online).
Overall, we proceed as follows. We create two periods: during university and after graduation. The latter lasts always approximately five years; the former depends on the duration of studies, which ranges from three to six years. We discount each year at a 3% rate.10
Consequently, to compute the private net present value we use the formula:
9 The HEGESCO (Higher Education as a Generator of Strategic Competences) project was financed by
the European Commission, DG Education and Culture (www.hegesco.org). The REFLEX project was a
large-scale European survey among higher education graduates
(http://roa.sbe.maastrichtuniversity.nl/?portfolio=reflex-international-survey-higher-education-graduates).
y is the sum of the number of years in education, A and B respectively the net cash-flow after and before graduation, and r the discount rate. For the period at university, we sum the following variables: foregone earnings multiplied by the probabilities of employment for non-university graduates (OC), university fees net of grants (NF) and labour income during studies (SLI).
Students’ labour income (SLI) is calculated by multiplying the number of months worked in the pre-graduation period (MW) by the monthly median net income of a male/female aged 16-2411 in 1995 in France and Italy and in 1998 in the other three countries. Information on the number of months spent on paid work while studying comes from REFLEX/HEGESCO.12
Net fees (NF) are the sum of fees and grants multiplied by the number of years in education (y). The source for this information is a report produced for the European Commission which gives an overview of public fees and support systems in Europe (European Commission, 2012b). The report refers to 2011/2012 fees and grants. We calculate 1995/1998 fee and grant levels simply by applying the inflation rate and assume that there was no major change in the fee structure in the period up to 2011/2012. We do not distinguish by field in this case.
We compute the opportunity cost in the following way: to calculate how much students from each field (and gender) would have earned if they had chosen full-time work instead of university, we assume that the time they would have spent working equals the number of hours they actually spent studying (whether in class or private study). We multiply these hours by the median net income of a 16- to 24-year-old and the probability of employment for someone of the same age who does not go on to tertiary education. The result obtained is then multiplied by the length of time studied. This gives opportunity costs differentiated by both field and gender. They range from -4000 euros in Poland and Hungary to -20,000 in France and Italy.
For the period after graduation we subtract from earnings the cost of the month of transition to the first job and the salary of a similar-aged person who did not go on to tertiary education.
11 A further clarification is needed here: Eurostat shows the annual average earnings of 16- to 24- year-
olds, by gender. We calculate the hourly value by dividing these earnings by twelve months, four weeks and 40 hours per week. This gives a number in the range of €6/hour for males and €5 for females in Italy, €7 and €6 respectively in France, €3 in Slovenia, €1 in Hungary and Poland.
12 See questions B3/B4: we sum the study hours and the non-study-related paid work done during
Labour income after graduation (LI) is calculated as gross salary multiplied by the number of months in employment and the probability of employment. Data come directly from HEGESCO/REFLEX. A tax rate is applied to the gross salary using tax rates for single-parent high-earners that can be downloaded from Eurostat.13
T refers to the transition from school to work (normally less than 3 months) and is calculated as an opportunity cost. For the period after graduation, we also subtract what the same person would have earned if he/she had continued to work after school and we multiply that by the probability of employment of ISCED3 graduates in 1999/2000 in France and Italy and 2003 in Poland, Hungary and Slovenia.
We compute NPVs for five countries: Italy, France, Hungary, Poland and Slovenia. In each, the gross number of observations goes from 1200 in Poland to 3139 in Italy. We do not consider the Bachelor/Master division for two reasons. The first is that it does not apply in the case of Poland, France and Italy: the 3+2 reform was implemented after the people surveyed started university. The other is that the number of masters graduates in the two remaining countries is very small, even though it would, in principle, be possible to make the distinction.
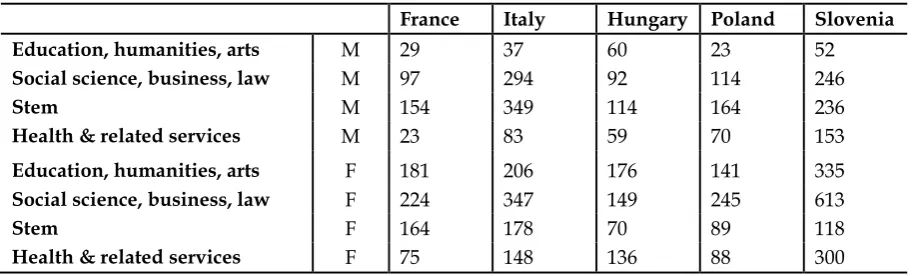
[image:9.595.68.530.453.591.2]When only those whose wages are recorded are considered,14 the number of observations falls to, on average, 160 by field and gender. Data are organised into nine fields of study which we group into four to have a big enough sample size for each: (i) education, art and humanities; (ii) social science, business and law; (iii) STEM (science, mathematics, computing, engineering, manufacturing and construction); and (iv) fields we have termed health and related services, and which include agriculture, veterinary services, health and welfare.15 All values are averaged for each field of study.
Table 2. Number of observations by country, gender and field of study
France Italy Hungary Poland Slovenia Education, humanities, arts M 29 37 60 23 52
Social science, business, law M 97 294 92 114 246
Stem M 154 349 114 164 236
Health & related services M 23 83 59 70 153
Education, humanities, arts F 181 206 176 141 335
Social science, business, law F 224 347 149 245 613
Stem F 164 178 70 89 118
Health & related services F 75 148 136 88 300
Source: Authors’ elaboration based on HEGESCO/REFLEX datasets.
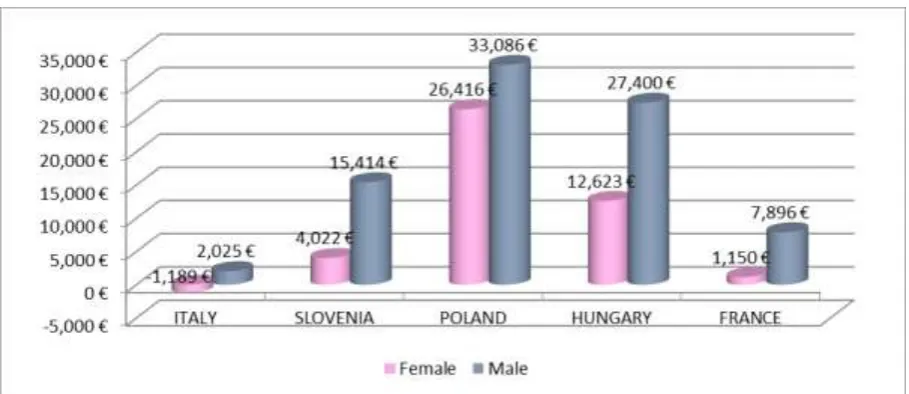
With this methodology, we compute the monetary net present value of tertiary education. For male graduates, it ranges from €2,000 for STEM graduates in Italy to €33,000 for social scientists in Poland. For female students, it is on average lower, even negative, for Italian STEM graduates, but for social scientists, it can reach €27,000 in Poland and €23,000 in
13 The source for Eurostat is the OECD.
14 Plus those whose wages are higher or lower than the average +/-three times the standard deviation.
15 Health and welfare strongly dominates in the group in terms of number of observations. The only
Hungary. The computed NPVs are higher in Central and Eastern European countries than in Western Europe. The reason is that there was sustained overall economic growth in these countries during the decade covered by the survey and this generated a generalised growth in wages and prices. Moreover, the actual NPVs are difficult to interpret because they are expressed in current prices for the year they refer to. And last, but not least, no matter how accurate our calculation is, it is subject to error and missing data which can alter the exact numbers. But since these errors are likely to apply in the same way to all fields, they are unlikely to change the ranking.
For all these reasons, we standardise the results: we set the average NPV to 100 in each country and examine how each of the four fields compares to the average.
Our methodological choices do have their limitations. One is that we combine study areas in order to have larger sample sizes. This means that we cannot distinguish a graduate in law from a graduate in political science. Existing research indicates disparities between genders when ranking the top-earning fields. So, for example, Chevalier (2011) observes that women in the UK tend to earn less than men in the fields with the highest returns. Indeed, male graduates in economics, law, IT and subjects related to medicine have significantly higher earnings than women with the same qualifications, while it is the female graduates in education, linguistics, history and philosophy who are the higher earners. Similar disparities are observed in Slovenia (Bartolj et al., 2012) and Germany (Wahrenburg & Weldi, 2007).
4.
Results and discussion
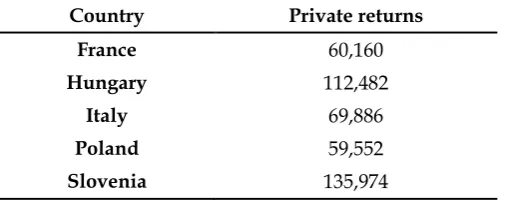
[image:10.595.69.322.504.604.2]To demonstrate a baseline of the current state of the art, we extracted from the OECD data their current estimates for the net present value of tertiary education in the five countries that we both study (see Table 3). As shown in the previous section, these are probably the most detailed and sophisticated returns to tertiary education calculated for a larger sample of countries.
Table 3. Average net present value of tertiary education in USD in 2010 (female).
Country Private returns
France 60,160
Hungary 112,482
Italy 69,886
Poland 59,552
Slovenia 135,974
Source: OECD (2014).16
As we can see, despite much lower wages, the net present value of tertiary education in the new member states are equal or higher from the older member states.
We will now examine, using our own analysis, how the inclusion of additional data and the division of students according to the field of study change the picture.
16 Note: net present value for an individual completing tertiary education as part of his/her initial
Figures 1 and 2 present private returns for males and females in different fields of study. The charts show that significant differences emerge as soon as we stop treating university graduates as a homogeneous group. This is especially true for men in France and Italy. For a young male school-leaver, enrolling in education and humanities is, relatively speaking, not an advantageous choice. Somewhat surprisingly, the same applies, although to a lesser degree, to STEM. Why is this the case? We observed that different fields not only result in more or less high salaries after university, but also that costs can change. In particular:
- Study hours are different because some subjects are more demanding in terms of personal study time and class attendance.
- The time available for students to take paid jobs varies, partly because of the amount of reading/private study required by different courses.
- The number of years needed to graduate can vary according to the country and the subject. It takes longer, on average, to obtain a university degree in Italy.
The ‘STEM case’ is clear in two countries - in Italy and France, the lower return is more the result of high costs than it is of low benefits. In Italy, costs are higher because the duration of studies is not fixed as it is in other countries. In France they are determined by the high average number of hours spent studying or attending classes per week, a higher average than other fields.
In France and Italy, students are better off studying health and related services. In Hungary, Slovenia and Poland, the fields with the highest return are social sciences, business and law. (In Poland, the return is the same as it is for STEM.)
This implies that the recent success of subjects like economics, business or law is consistent with high private returns, especially in Central and Eastern Europe. Some studies offer an explanation for this success. Münich, Svejnar and Terrell (2005) investigate the shift in the returns to education in the Czech Republic between 1989 and 1996, namely the transition away from a specific labour market structure characterised by very low rates of return on education, a low proportion of university graduates and a strong emphasis on industrial skills. They find that along with a substantial increase in returns, a considerable redistribution among fields of study took place. Unlike Western Europe, qualifications under-represented during the Soviet period, such as social studies, law and business studies, became better rewarded than technical skills. This is especially marked for law: the high demand for legal services during the period of privatisation and restructuring led to it becoming the best-rewarded qualification. The same thing happened in Slovenia, according to Bartolj et al. (2012).17
17 More recent studies observe that the gap between the rates of return for social sciences and technical
Figure 1. Net Present Value of University education in five countries, five years from graduation, male graduates. (Blue bars refer to male students, pink bars to female.)
Italy France
Hungary Poland
Slovenia
This first part of the analysis indicates therefore that when both costs and benefits are taken into account, social sciences and medicine (and related professions) tend to have the highest private returns across the five countries studied.
Machin and Puhani (2003) stress that in this type of research, as in many other labour economics topics, it is important to distinguish by gender. Our results, as shown in Figure 1, suggest first that the labour market for female graduates is subject to a lower degree of inequality compared with that for men, especially in Central and Eastern European countries.
[image:13.595.71.526.393.590.2]Our results also confirm the findings in the literature on segregation which can be observed on the one hand in the male/female dominance in certain fields, and on the other in the difference in NPVs for the same field. Female graduates dominate the education, art and humanities field, for which they enjoy higher returns than men. For a woman, enrolling in STEM courses is rarely the financially most rewarding choice. In Italy, France, Slovenia and Hungary, it brings the lowest returns. This is consistent with, and perhaps also explains, the low female participation in STEM. According to some authors (Hall, 2007; Hewlett et al., 2008), this is the result of long working hours, a macho culture and uncertain career paths. Hunt (2010) argues instead that it is because of dissatisfaction over pay and opportunities for promotion. Our data indicate that there is a clear wage gap and therefore support Hunt's hypothesis.
Figure 2. NPV of tertiary education for STEM graduates, male and female compared.
Source: Authors’ elaboration based on HEGESCO/REFLEX datasets.
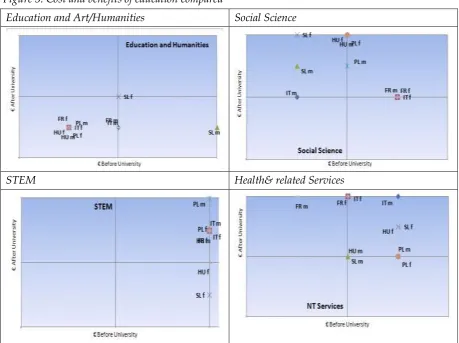
In terms of ranking, social science is always a good choice, especially in Central and Eastern Europe, but so are health and related services in France and Italy. Poland constitutes an exception in the group: a good level of convergence has been achieved, even for STEM subjects, returns are the same as for social sciences and are similar for men and women. In the remainder of the section, we disaggregate the costs and benefits18 of tertiary education by field in each of the five countries considered and rank them. What determines the position of each dot in the scatterplot is not the absolute value in euros (€) but the ranking by country. For example, in Italy, listing costs for male graduates in order from lowest to highest, we
have non-tradable services (which we rank as 1), social science (2), humanities (3) and STEM (4)., When we look at benefits, the best- rewarded subject is non-tradable services (ranked 4, therefore) and the least rewarded is humanities(1)-. We classify this information by field rather than by country and show it in Figure 3.
Figure 3. Cost and benefits of education compared
Education and Art/Humanities Social Science
STEM Health& related Services
Source: Authors’ elaboration based on HEGESCO/REFLEX datasets.
According to the ranking, four outcomes are possible:
- A degree costs relatively little but also provides a low return: this is almost always the case with education and humanities.
- A degree has a high cost, but also provides a high return: STEM more often falls into this category.
- Social science usually brings good returns for a low initial investment, especially in Central European countries
- Studying medicine (and related professions) brings high returns for a cost that is high, but not as high as STEM.
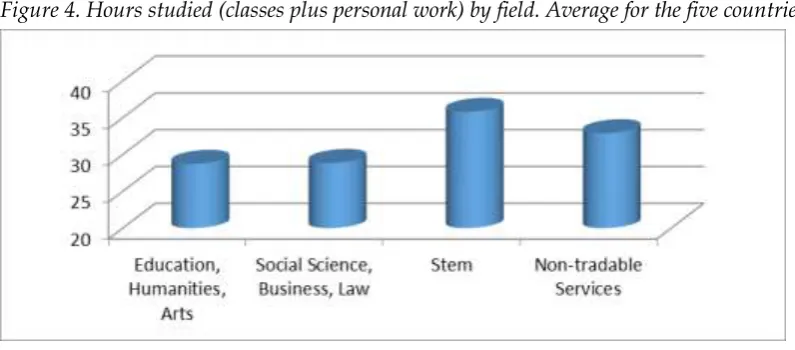
serve a signalling purpose. The sorting effect implies that more-able students will select themselves into the fields which are assumed to be more demanding and so will be able to earn more after they graduate. Differences in the allocation of hours to study and to student jobs support this view.
Figure 4. Hours studied (classes plus personal work) by field. Average for the five countries.
Source: Authors’ elaboration based on HEGESCO/REFLEX datasets.
Students who, despite the overall NPV, decide to enrol in STEM could therefore be wealthier or more intelligent (or both). A downside of this is that the participation of poorer students may be restricted in subjects with high initial costs. In a comparative study between France and Germany, Duru-Bellat et al. (2008) show that educational expansion implies elite-mass division in the sense that if fields are academically demanding or more costly in terms of study length, social background effects are particularly likely. Alternatively, those who still enrol in STEM despite the high cost are notably risk-averse given that they anticipate positive labour market outcomes (in the case of male students); they also know their abilities and anticipate that they can cope with the challenge.
5.
Subject selection – explaining students’ decisions
Factoring in time use helps to explain why, in the short- to medium-term after graduation, STEM careers do not make as much financial sense as the headline numbers seem to show. Moreover, from a gender point of view, private returns for STEM are consistently lower for females than males in any given country.
We also distinguish between the private costs and benefits generated before and after graduation. We saw that both females and males experience STEM as a field with high initial costs, but males were much more likely than females to see high return generated after graduation. This provides a rational explanation for the smaller interest shown by females in the STEM field. It also suggests that a potentially powerful way of increasing female interest in STEM lies in examining sources of smaller post-graduation rewards or in post-diploma incentives designed to lower the cost of enrolling in STEM courses.
On the other hand, some, but not all of the “soft” subjects have very high total private returns. They combine low initial costs (since they allow students to take paid jobs while studying) with substantial later returns. These are subjects such as social science, law and business, but they do not include arts, humanities and education, where the private returns tend to be much lower. This is particularly true for the new EU member states where the generic skills represented by such degrees are a good fit for rapidly changing economies. The fourth category we examined – health and related services – concerned mostly, but not exclusively, health care and social welfare, and provided a consistent picture of medium overall returns stemming from high initial costs and high subsequent benefits.
References
Arcidiacono, P. (2004), “Ability Sorting and the Returns to College Major”, Journal of Econometrics,
121(1-2), pp. 343-375.
Bartolj, T., A. Ahcan, A. Feldin and S. Polanec (2012), “Evolution of Private Returns to Tertiary Education During Transition: Evidence from Slovenia”, Discussion Paper No. 314/2012, LICOS Discussion Paper Series, LICOS Centre for Institutions and Economic Performance, Leuven.
Becker, G.S. (1964), Human capital, New York: Columbia University Press.
Blackaby, D., P. Murphy and N. O’Leary (1999), “Graduate Earnings in Great Britain: A Matter of
Degree?”, Applied Economics Letters, 6(5), pp. 311-315.
Blundell, R.L., L. Dearden, A. Goodman and H. Reed (2000), “The Returns to Higher Education in
Britain: Evidence from a British Cohort”, Economic Journal, 110(461), pp. F82-F99.
Boarini, R. and H. Strauss (2010), “What is the Private Return to Tertiary Education? New
Evidence from 21 OECD Countries”, OECD Journal: Economic Studies.
Bradley, K. (2000), “The incorporation of women into higher education: Paradoxical outcomes?”,
Sociology of Education, 73(1), pp. 1-18.
Bratti, M. and L. Mancini (2003), “Difference in early occupational earnings of UK male graduates
by degree subject: evidence from the 1980-1993 USR”, IZA Discussion Paper No. 890,
Institute for the Study of Labor, Bonn.
Buonanno, P. and D. Pozzoli (2009), “Early Labour Market Returns to College Subjects”, Labour,
23(4), pp. 559-588.
CEDEFOP (2010), The Skill Matching Challenge, European Centre for the Development of
Vocational Training, Thessaloniki.
Chevalier, A. (2011), “Subject choice and earnings of UK graduates”, Economics of Education
Review, 30(6), pp. 1187-1201.
Chevalier, A. and G. Conlon (2003), Does it Pay to Attend a Prestigious University?, IZA Discussion
Paper No. 848, Institute for the Study of Labor, Bonn.
De Paola, M. and F. Gioia (2011), “Risk aversion and major choice: evidence from Italian students”, Working Paper No. 07 – 2011, Dipartimento di Economia e Statistica, Universita’ della Calabria.
Dickson, M. and C. Harmon (2011), “Economic Returns to Education: What We Know, What We
Don’t Know, and Where We Are Going – Some Brief Pointers”, Economics of Education
Review, 30(6), pp. 1118–1122.
Dörfler, L. and H.G. van de Werfhorst (2009). “Employers’ Demand for Qualifications and Skills”,
European Societies, 11(5), pp. 697-721.
Duru-Bellat, M., A. Kiefferand and D. Reimer (2008), “Patterns of Social Inequalities in Access to
Higher Education in France and Germany”, International Journal of Comparative Sociology,
49(4-5), pp. 347-368.
European Commission (2012a), EU Skills Panorama Analytical Highlight - Science, technology, engineering and mathematics (STEM) skills.
European Commission (2012c), “Rethinking education: investing in skills for better socio-economic outcomes”, COM(2012) 0669 final, Strasbourg, 20.11.2012.
Finnie, R. and M. Frenette (2003), “Earnings Differences by Major Field of Study: Evidence from
Three Cohorts of Recent Canadian Graduates”, Economics of Education Review, 22(2), pp.
179-192.
Gáti, A. and P. Róbert (2011), “Gender issues and inequality in higher education outcomes under post-communism”, Almalaurea Working Paper No. 34, AlmaLaurea Inter-University Consortium, Bologna.
Giddings, L.A. (2002), “Changes in Gender Earnings Differentials in Bulgaria’s Transition to a
Mixed-market Economy”, Eastern Economic Journal, 28(4), pp. 481-497.
Goudard, M .and J.F. Giret (2010), “Schooling Effects and Earnings of French University Graduates : School quality matters, but choice of discipline matters more”, GREQAM Working Paper No. 2010-09, Groupement de Recherche en Economie Quantitative d’Aix-Marseille, Aix-Marseille University.
Grave, B.S. and K. Goerlitz (2012), “Wage differentials by field of study – the case of German
university graduates”, Education Economics, 20(3), pp. 284-302.
Hall, L.E. (2007), Who’s Afraid of Marie Curie? The Challenges Facing Women in Science and
Technology, Emeryville, C.A.: Seal Press.
Handerson, D.J., S. Polachek and L. Wang (2011), “Heterogeneity in Schooling Rates of Return”,
Economics of Education Review, 30(6), pp. 1202-1214.
Harkness, S. and S. Machin (1999), Graduate Earnings in Britain, Research Brief No. 95,
Department for Education and Employment, London.
Heckman, J.J., L.J. Lochner and P.E. Todd (2005), “Earnings Functions, Rates of Return, and Treatment Effects: The Mincer Equation and Beyond”, NBER Working Paper No. 11544, National Bureau of Economic Research, Cambridge, MA.
Hewlett, S.A., C.B. Luce and L.J. Servon (2008), The Athena Factor: Reversing the Brain Drain in
Science, Engineering, and Technology, Harvard Business Review Research Report 10094.
Hunt, J. (2010), “Why Do Women Leave Science and Engineering?”, NBER Working Paper No. 15853, National Bureau of Economic Research, Cambridge, MA.
Kelly, E., P.J. O’Connell and E. Smyth (2010), “The economic returns to field of study and
competencies among higher education graduates in Ireland”, Economics of Education Review,
29(4), pp. 650-657.
Kim, A. and K.W. Kim (2003), “Returns to Tertiary Education in Germany and the UK: Effects of Fields of Study and Gender”, MZES Working Paper No. 62, Mannheimer Zentrum für Europäische Sozialforschung, Mannheim.
Leppel, K. (2001), “The impact of major on college persistence among freshmen”, Higher
Education, 41, pp. 327-342.
Leslie, D. (2003), “Using Success to Measure Quality in British Higher Education: Which Subjects
Attract Best-Qualified Students?”, Journal of the Royal Statistical Society, 166(3), pp. 329-347.
Livanos, I. and K. Pouliakas (2008), “Returns to education by academic discipline in the Greek labour market”, MPRA Paper No. 14159, Munich Personal RePEc Archive.
Machin, S. and P.A. Puhani (2003), “Subject of Degree and the Gender Wage Differential:
Martins, O., J.R. Boarini, H. Strauss and C. de la Maisonneuve (2009), “The Policy Determinants
of the Investment in Tertiary Education”, OECD Journal: Economic Studies.
Mincer, J. (1974), Schooling, Experience and Earnings, New York: Columbia University Press.
Münich, D., J. Svejnar and K. Terrell (2005), “Returns to human capital under the communist
wage grid and during the transition to a market economy”, The Review of Economics and
Statistics, 87(1), pp. 100-123.
OECD (2014), Education at a Glance 2014, OECD, Paris.
O’Leary, N.C. and P.J. Sloane (2005), “The Return to a University Education in Great Britain”,
National Institute Economic Review, 193(1), pp. 75-89.
Orazem, P.F. and M. Vodopivec (2000), “Male-Female Differences in Labor Market Outcomes
during the Early Transition to Market: The Cases of Estonia and Slovenia”, Journal of
Population Economics, 13(2), pp. 283-303.
Park, S. (2011), “Returning to school for higher returns”, Economics of Education Review, 30(6), pp.
1215-1228.
Reimer, D., C. Noelke and A. Kucel (2008), “Labor Market Effects of Field of Study in
Comparative Perspective”, International Journal of Comparative Sociology, 49(4-5), pp. 233-256.
Stager, D.A.A. (1996), “Returns to Investment in Ontario University Education, 1960-1990, and
Implications for Tuition Fee Policy”, The Canadian Journal of Higher Education, 26(2), pp.
1-22.
Stark, A. (2007), Which Fields Pay, Which Fields Don't? An Examination of the Returns to University
Education in Canada by Detailed Field of Study, Economic Studies and Policy Analysis
Division, Department of Finance, Canada.
Usher, A. (2005), A Little Knowledge is a Dangerous Thing: How Perceptions of Costs and Benefits Affect
Access to Education, Canadian Education Report Series, Toronto, ON: Educational Policy
Institute.
Vaillancourt, F. (1995), “The Private and Total Returns to Education in Canada, 1985”, Canadian
Journal of Economics, 28(3), pp. 532-554.
Wahrenburg, M. and M. Weldi(2007), Return on Investment in Higher Education – Evidence for
Different Subjects, Degrees and Gender in Germany, Goethe University, Frankfurt.
Walker, I. and Y. Zhu (2011), “Differences by degree: Evidence of the net financial rates of return
to undergraduate study for England and Wales”, Economics of Education Review, 30(6), pp.