CRUSTAL EVOLUTION IN NORTHWEST AUSTRALIA: EVIDENCE FROM SEISMIC REFRACTION DATA
A thesis submitted for the degree of DOCTOR OF PHILOSOPHY
in the
AUSTRALIAN NATIONAL UNIVERSITY
by
BARRY JOHN DRUMMOND
i
STATEMENT
The studies described in this thesis were undertaken while I was a full-time research scholar in the Research School of Earth Sciences of the Australian National University during the period September 1979 to June 1982.
Except where mentioned in the text or in the acknowledgements, the research described in this thesis is my own.
This thesis has never been submitted to another University or similar institution.
ACKNOWLEDGEMENTS
The work described in this thesis was supervised by Dr K.J. Muirhead of the Research School of Earth Sciences, to whom I express my gratitude.
Dr C. Wright also made many useful comments during the latter part of the project, and critically read the manuscript. Emeritus Professor A.L. Hales was involved in the initial shaping of the project, and I benefitted greatly from the friendship and gentle guidance of the late Dr J.R. Cleary.
Of course, research based on the interpretation of seismic data is
impossible without data, and in this respect I acknowledge the considerable effort of my friends and colleagues of the Bureau of Mineral Resources, Geology and
Geophysics, during the collection of the data in 1977. In particular, I thank D.M. Finlayson and P. Wellman, who supervised the field work, J.B. Connelly, C.D.N. Collins and J.W. Williams for the efforts they made in collecting the seismic data, and Heather McCracken Shelley for collecting the gravity data. The staff of the iron mining companies of the Pilbara, notably Goldsworthy Mining Limited, Cliffs Robe River Associates, Hamersley Iron Pty Ltd, and Mount Newman Mining Company Pty Ltd often gave of their own time in order to allow us to time their mining blasts and to ensure that our seismic survey ran smoothly. Emeritus Professor A.L. Hales made available the data from his recorders deployed throughout the region at the time of the BMR survey.
During the interpretation of the seismic data, I used numerous computer programs, several of which were made available by my colleagues. Dr K.J. Muirhead and C.D.N. Collins gave me ray tracing programs. S.P. Mathur made available his program for intercept method inversion and the time term inversion programs were written by Dr J. Leven. The synthetic seismogram program was written by Professor K. Fuchs and Dr G. Muller of the University of Karlsruhe, Federal Republic of
Germany and converted to the RSES computer by Dr J. Leven. D.R. Christie gave me useful hints for writing my own programs.
Financial support for this research came in the form of an Australian Public Service Board Postgraduate Scholarship. All Bureau of Mineral Resources data and Figure 46 are used with the permission of the Director, Bureau of Mineral Resources.
iii
ABSTRACT
A seismic refraction and detailed gravity survey was undertaken in 1977 in the northwestern part of the Precambrian shield of Australia to study the structure of the Archaean Pilbara and Yilgarn Cratons which crop out in the
area. Most of the traverses were across the Pilbara Craton, but some results
are available from the northern Yilgarn Craton. The older Pilbara Craton
has a much thinner crust than the Yilgarn Craton. The different crustal
thicknesses, when considered with isostatic models of the region, imply that the upper mantle under the Pilbara Craton is less dense than the upper mantle
under the Yilgarn Craton. Thus the upper mantle is implicated as the source
of the huge amounts of iron in the banded iron formations of the Hamersley Basin which formed across the Pilbara Craton in the late Archaean and early Proterozoic.
Sediments of the Proterozoic Capricorn Orogenic Belt overlap the margins
of the cratons and mask their structural relations. The northern margin of the
Yilgarn Craton was deformed along a zone 50 km wide during the Proterozoic orogeny, but no such zone is recognisable in the seismic models of the southern edge of the
Pilbara Craton. The lower crust of the Carpricorn Orogenic Belt has high seismic
velocities and is dense, probably due either to higher metamorphic grades or mafic intrusions caused by the Proterozoic tectonics.
The seismic velocities in the crust of the Pilbara Craton imply that
the upper crust is of granitic composition. At 10-15 km depth, it is metamorphosed
to felsic granulite. Below this depth, the amount of garnet increases, causing
an increase in the seismic velocity. The mafic content also increases, causing
a further increase in the amount of garnet, until the lower crust of the craton
is of dioritic composition. The crust/mantle boundary under the craton must
be a chemical discontinuity. The lower crust of the Pilbara Craton is much
The Pn seismic velocity under the craton is anisotropic with the direction of maximum velocity at right angles to the axis of the Hamersley
Basin along the azimuth N30°E. The anisotropy is probably due to the realignment
of olivine crystals in the upper mantle by syntectonic recrystallisation and/or power law creep in the tensional environment caused at the base of the lithosphere
by flexure during loading by the Hamersley Basin strata. Another boundary occurs
15 km below the crust/mantle boundary throughout the region. It exhibits topo
graphy and the velocity below it is also anisotropic, with the apparent direction
of maximum velocity between north and 40 degrees west of north. This direction
correlates loosely with trends of geological features in the Hamersley Basin and in the younger Capricorn Orogenic Belt, suggesting that the anisotropy below the sub-Moho boundary is a younger feature than that below the crust/mantle
boundary. This is consistent with the notion that the lithosphere was thinner
in the Precambrian and implies that the base of the Archaean lithosphere is the velocity increase which is now at 45 km depth under the Pilbara Craton. The current base of the lithosphere may be below 200 km depth.
The seismic models limit the types of evolutionary processes that can
be applied to the formation of the Hamersley Basin. The most likely are: (a)
V
TABLE OF CONTENTS
A C K N O W L E D G E M E N T S
P a g e
A B S T R A C T i i i
C O N T E N T S V
L I S T OF T A B L E S v i i i
L I S T OF F I G U R E S ix
1. I N T R O D U C T I O N 1
2. G E O L O G Y 4
2 . 1 N O M E N C L A T U R E 4
2 . 2 G E O L O G I C A L D E S C R I P T I O N 6
3. T H E S U R V E Y 14
4. P R E L I M I N A R Y I N T E R P R E T A T I O N OF T H E S E I S M I C D A T A 17
4 . 1 D A T A 17
4 . 2 M E T H O D 17
4 . 3 S E I S M I C W A V E G R O U P N O M E N C L A T U R E 18
4 . 4 R E S U L T S 20
4 . 4 . 1 L i n e A B C (and G B C ) 20
4 . 4 . 2 L i n e F D B 23
4 . 4 . 3 L i n e s G D E (and A D E ) a n d D C
1»
31
4 . 4 . 4 L i n e F G 38
5. A M P L I T U D E S 39
5.1 T H E N E E D T O U S E A M P L I T U D E S 39
5 . 2 D A T A P R O C E S S I N G 41
5 . 3 S Y N T H E T I C S E I S M O G R A M M O D E L L I N G 44
5 . 3 . 1 S h o t p o i n t A ( S u n r i s e H i l l a n d S h a y G a p ) , a l o n g l i n e A B 44
5 . 3 . 2 S h o t p o i n t G ( G o l d s w o r t h y ) , a l o n g l i n e G B C 53
5.3.4 Shotpoint G (Goldsworthy), along line GHD 64
5.3.5 Shotpoint D (Tom Price), along line DHG 70
5.3.6 Shotpoint D (Paraburdoo), along line DHG 70
5.3.7 Shotpoint F (Pannawonica), along line FDB 73
5.3.8 Shotpoint B (Newman), along line BDF 79
5.3.9 Observed amplitudes within the Capricorn Orogen 88
5.4 BRIGHT CUSPS CAUSED BY LATERAL STRUCTURE 89
6. COMPOSITION OF THE CRUST 92
6.1 VELOCITY DERIVATIVES 94
6.2 PRESSURE AND TEMPERATURE DERIVATIVES 97
6.2.1 Pressure gradient 97
6.2.2 Temperature gradient 97
6.3 THE EFFECT OF PRESSURE AND TEMPERATURE ON THE CRUSTAL
VELOCITY/DEPTH MODELS 99
6.3.1 Classification of Igneous Rocks 103
6.3.2 Chemical change with depth 105
6.3.3 Metamorphic change with depth 106
6.4 THE COMPOSITION OF THE CRUST OF THE PILBARA CRATON 114
6.5 THE COMPOSITION OF THE CRUST OF THE YILGARN CRATON 116
6.6 THE NATURE OF THE CRUST/MANTLE BOUNDARY 117
6.7 COMPARISON WITH YOUNGER REGIONS OF AUSTRALIA 122
7. UPPER MANTLE ANISOTROPY 134
7.1 ANISOTROPY IN Pn 134
7.1.1 The Pn data set 141
7.1.2 Limitations of the time term method 146
vii
7.2 ANISOTROPY IN THE REFRACTOR BELOW THE CRUST/MANTLE BOUNDARY 174
8. SHEAR WAVES 184
9. EVOLUTION OF THE PRECAMBRIAN CRUST OF NORTHWEST AUSTRALIA
-CONSTRAINTS FROM THE SEISMIC MODELS 195
9.1 CONSTRAINTS FROM THE INTERCEPT METHOD MODELS 195 9.2 FURTHER CONSTRAINTS WHEN THE GRAVITY FIELD IS CONSIDERED 201
9.2.1 The gravity field 201
9.2.2 Isostatic compensation complete below the base of the
crust 206
9.2.3 Isostatic compensation complete at the base of the
crust 206
9.2.4 Implications of the gravity modelling 206 9.3 THE EVOLUTION OF NORTHWEST AUSTRALIA - DISCUSSION 209
9.3.1 The Archaean 209
9.3.2 The Hamersley Basin 210
9.3.3 The cause of upper mantle anisotropy 223 9.3.4 Lateral and vertical changes in the upper mantle 226
10. CONCLUSIONS 228
11. REFERENCES 231
APPENDIX 1 Drummond (1979b)
APPENDIX 2 Drummond, Smith and Horwitz (1981) APPENDIX 3 Drummond (1981)
APPENDIX 4 Drummond and Shelley (1981)
APPENDIX 5 Drummond, Muirhead and Hales (1982)
LIST OF TABLES Page
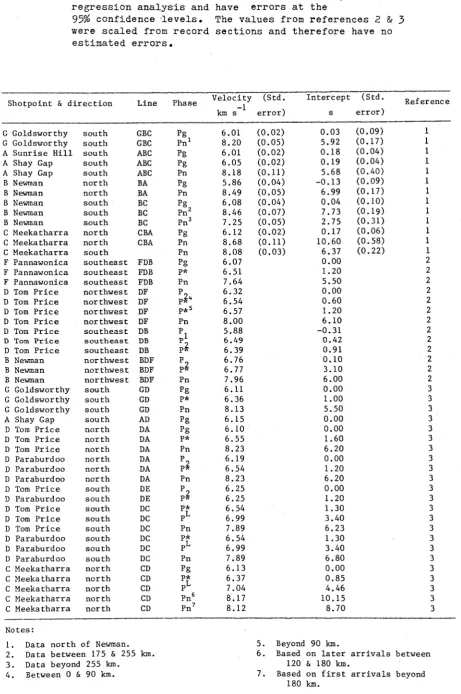
1. Seismic velocities and intercepts 22
2. Velocity/depth model for the profile: Shotpoint A (Sunrise Hill
and Shay Gap), along line AB 48
3. Velocity/depth model for the profile: Shotpoint G (Goldsworthy),
along line GBC 54
4. Regression analyses for travel-time data for the phase Pg from
Shotpoint B northwards along lines BA and BG 60
5. Velocity/depth model for the profile: ShotpointB (Newman), along
line BG 62
6. Velocity/depth model for the profile: Shotpoint G (Goldsworthy),
along line GHD 66
7. Velocity/depth model for the profile: Shotpoint D (Tom Price),
along line DHG 69
8. Velocity/depth model for the profile: Shotpoint D (Paraburdoo),
along line DHG 72
9. Velocity/depth model for the profile: Shotpoint F (Pannawonica),
along line FDB 76
10. Velocity/depth models for the profile: Shotpoint B (Newman),
along the line BDF • 79
11. Compressional wave velocities lGPa and 25°C in common rock types
metamorphosed to granulite and eclogite facies 112
12. Detailes of all uniterated time term solutions 149
13. Details of the solutions for time term surfaces 160
14. Final time term solutions 164
15. Shear wave velocities and intercept times 185
ix
ABBREVIATED FIGURE CAPTIONS
Page 1. Distribution of Precambrian rocks in Western Australia 5 2. Geology of the survey region, and survey design 7 3. Histogram of presently available isotopic ages of Precambrian
rocks in the Pilbara and Yilgarn Blocks 9
4. Survey design 13
5. Record sections along line ABC 19
6. Alternative models for line ABC 21
7. Seismic record sections along line FDB 24
8. Bar graph of laboratory measurements of seismic velocities and densities, at standard temperature and pressure, of 49 fresh
hand samples from the survey region 26
9. Diagrammatic cross-section along line FDB 28
10. Crustal model along line FDB 29
11. Record sections for line GD 32
12. Record sections for line DE 33
13. Record sections for line DC 34
14. Seismic models for lines GDC and DE 35
15. Record sections for line FG 36
16. Seismic model for line FG 37
25. Models for shotpoint B (Newman), along line BDF 80-85
26. Record sections across the Capricorn Orogen 87
27. An example of how reflector topography can produce bright cusps 90
28. Velocity/depth models for the Pilbara Craton 93
29. Pressure gradients for three crustal models 96
30. Adopted geothermal gradients 98
31. Velocity/depth models for the Pilbara Craton plotted on the same
axes 100
32. Classification of igneous rocks 102
33. Compressional wave velocities versus chemical composition 104
34. Velocity/depth models for the Pilbara Craton 107
35. Velocity/depth models for the Pilbara Craton, with the velocities
adjusted to lGPa and 25°C, plotted on the same axes 108
36. Velocity/density relations for mean atomic weights of 21 and
22 at 25°C and lGPa 110
37. Experimentally determined stability fields of granulite and
eclogite 113
38. Distribution of seismic refraction lines in northern Australia 120
39. Observed velocity/depth models for northern Australia 121
40. Velocity/depth model for the western line in the McArthur Basin 123
41. Velocity/depth models for northern Australia, with the velocities
adjusted to 25°C and lGPa 124
42. Distribution of seismic refraction lines in southeast Australia 125
43. Observed velocity/depth models for the Lachlan Fold Belt 126
44. Velocity/depth model for the line from Dartmouth to Marulan 128
45. Velocity/depth models for the Lachlan Fold Belt of southeast
xi
Page 46. Idealised cross-section from Port Augusta (SA) to Jugiong (NSW)
with inferred crust - upper mantle lithologies 131 47. Plot of reduced Pn travel times versus azimuth 135 48. Plot of reduced Pn travel times for a model with a Moho dipping
1 degree at an azimuth of 210 degrees 136
49. Plot of reduced Pn travel times versus azimuth with superimposed
modelled travel time curves 137
50. Pn travel times minus the calculated travel times for a model
with a 1 degree dip on the Moho 139
51. Pn travel times minus the calculated travel times for a model
with a 2 degree dip on the Moho 140
52. Areal distribution of Pn recordings 142
53. Reduced Pn travel times versus distance 143
54. Histograms of the azimuths of Pn travel times 145
55. Hierarchy of time term solutions 148
56. Time term profiles for lines GB, GD and GF for the solution for simple time term with no anisotropy for the stations with more
than one connection 151
57. Time term profiles GB, GD and GF for the uniterated solution for simple time term and anisotropy, for the stations with more
than one connection 153
58. Time term contours for the uniterated solution for simple time terms, with anisotropy, for the stations with more than one
connection 134
59. Comparison of the time term profile for the solutions for simple time terms, with and without anisotropy, for the stations with
more than one connection. 155
60. Contours for the uniterated solution for a linear polynomial
61. Contours for the uniterated solution for a quadratic polynomial
time term surface with anisotropy 158
62. Contours for the uniterated solution for a linear polynomial plus
first order double Fourier time term surface with anisotropy, with
the axes rotated (a) 0, (b) 30, (c) 60, and (d) 90 degrees clockwise 159
63. Contours for the uniterated solution for a linear polynomial plus
second order double Fourier time term surface with the axes rotated
30 degrees clockwise 162
64. Time term profiles for the solution, after iteration, for simple
time terms, with anisotropy, for the stations with more than one
connection 165
65. Time term surface for the solution, after iteration, for a linear
polynomial surface, with anisotropy 166
66. Time term surface for the solution, after iteration, for a linear polynomial plus first order double Fourier surface with the axes
rotated 30 degrees clockwise, and with anisotropy 167
67. Depth profiles for lines GB, GD and GF 169
68. Velocity scattergram for the solution for simple time terms with
anisotropy for the stations with more than one connection 170
69. Velocity scattergram for the solution for a linear polynomial
time term surface with anisotropy 171
70. Velocity scattergram for the solution for a linear polynomial
plus first order double Fourier time term surface with anisotropy 172
71. Record section of recordings of a blast at shotpoint G (Goldsworthy)
to the south along line BD 175
72. Record section of recordings of a blast at shotpoint D (Tom Price)
to the southeast along fan profile BC 176
73. Record section of recordings of a blast at shotpoint B (Newman)
xiii
Page
74. Record section of recordings of a blast of shotpoint D (Tom Price)
to the northwest along fan profile FG 179
75. Record section of recordings of a blast at shotpoint F
(Pannawonica) to the northeast along fan profile DG 180
76. Record section of recordings of a blast at shotpoint D (Tom Price)
to the northeast along fan profile AB 181
77. Record section of shear waves from shotpoint G (Goldsworthy)
along line GB 186
78. Record section of shear waves from shotpoint B (Newman) along
line BG 187
79. Record section of shear waves from shotpoint G (Goldsworthy)
along line GHD 188
80. Record section of shear waves from shotpoint D (Tom Price) along
line DHG 189
81. Record section of shear waves from shotpoint D (Paraburdoo) along
line DHG 190
82. Record section of shear waves from shotpoint F (Pannawonica) along
line FDB 191
83. Record section of shear waves from shotpoint B (Newman), along
line BDF 192
84. Fence diagram of all of the seismic models from the intercept
method interpretation 196
85. Cartoon sketch of a north/south section of crust through the
survey area, in which the seismic models are interpreted in terms
of geology 197
_3
86. Simple Bouguer gravity map (Bouguer density 2.67 t m ) onshore
87. The seismic model and two gravity models for line GBC 88. Velocity/depth curves
89. Cartoon sketches of ten methods whereby a depression can be created to start basin subsidence
90. Map of the major dolerite dyke swarms in the Pilbara Block and Hamersley Basin
91. Diagrammatic representation of (a) the stress distribution
and (b) the inferred rheology within a viscoelastic lithosphere overlying a fluid substratum and deformed by a point load
205
216
217
1
1. INTRODUCTION
The history of the earth's crust is important, because the crust
contains all of the minerals and energy resources necessary for man's exist
ence. It also contains rocks from deep within the earth, and there
fore provides us with a window to the interior of the earth. The history
of the crust is imprinted in its rocks; rocks forming at the surface
of the earth today carry the marks of the processes that formed them within
the earth and carried them to the surface.
None of the primaeval crust of the earth remains. It was all either
recycled through the mantle by the hot, active processes which must have
prevailed during the first few hundred million years of the earth's existence,
or was destroyed, or at least its character so altered that it is no longer
recognisable, by meteorite bombardments, the evidence of which is still
preserved on the surface of the moon. The oldest remnants of the earth’s
crust are the few Archaean cratons now exposed around the world, and it is
from the geology and geochemistry of these cratons that we must piece together
the earliest history of the earth.
The Archaean cratons are very old, perhaps older than 3500 m.y., and
are often metamorphosed. As well, the cratons are composed of domes of
granitoid that intruded sequences of volcanic and sedimentary rocks, now
called greenstones, and these granitoid/greenstone terrains are unknown in
younger regions. This poses problems for those who are studying the cratons
and need to apply the principles of uniformitarianism.
While evidence for plate tectonics in the middle to late Precambrian
can be found in the geochemistry of some lavas (eg. Loberg, 1980) and in
the geographical distribution, stratigraphy, composition and evolutionary
characteristics of other lavas and sediments (eg. Waters, 1976), the style,
geochemistry and age relationships of the oldest Precambrian rocks fail
attempts to unequivocally assign a plate tectonic history to the early
Precambrian (eg. Groves Sc others, 1978; Grachev Sc Fedorovsky, 1981).
An example of the difficulty of studying Archaean cratons and
deriving a model of Archaean crustal development is evidenced by the fact
that the volcanics of the greenstone belts were the terrestrial equivalents
of the lunar maria, formed by volcanism caused by the meteorite impact.
Anhaeusser (1973) suggested they were formed by the protonucleation of ancient
arcs, while Hunter (1974) preferred a model of small volcanic basins that
formed between the uplifting granitoid magmas which were partial melts of a
hydrous basaltic lithosphere. Glikson (1975) proposed that the greenstone
belts are the relics of the ocean floor from which the granitoids were derived
by partial melting. Within these four processes can be seen the uncertainty
over whether the granitoids predated, were coeval with, or postdated the
greenstones. Clearly, it is not easy to make unequivocal interpretations of
the origins of Archaean cratons through the fog of time, tectonism and
metamorphism.
The geology and geochemistry of the surface rocks can tell us much
about the origins of the cratons, but before a full picture of the earliest
evolution of the earth can be drawn, the interior of the crust must also be
studied, for the processes which shaped the surface of the crust also
modified its interior.
The rock types within the crust can sometimes be inferred from the
surface geology. Lava flows, plutonic rocks and dyke swarms might have origin
ated as partial melts of the lower crust, so their chemistry can indicate the
rock types of the lower crust, and the tectonics of their emplacement can give
inference to the stress state during their emplacement. Kimberlitic rocks
which originated in the upper mantle often have inclusions of the lower crustal
country rocks through which they passed to reach the surface.
However, in some cases, the lower crust in the areas of interest is
not sampled by any of these means. For example, there may be no igneous rocks
whose origins were undeniably in the lower crust, or perhaps there are no
kimberlite pipes. In these regions, the physical properties of the lower crust
crust can only be sampled by geophysical surveys.
The oldest exposed crust in the world exists in the South African
Craton, the North Atlantic Craton of North America and Greenland, and in the
Pilbara and Yilgarn Cratons of Western Australia. In 1977, the Australian
Bureau of Mineral Resources, Geology and Geophysics (BMR) and the Research
School of Earth Sciences of the Australian National University (ANU) undertook
3
containing the Pilbara Craton and the northern part of the Yilgarn Craton. The
aims of the survey were to investigate the major structures within the Pilbara
Craton and, if possible, those of the northern Yilgarn Craton, and to
investigate the structures in the mobile belt which lies between the cratons
to determine the mechanism of the its formation.
Some of the data from the survey were interpreted using the intercept
method (Ewing & others, 1938; Dooley, 1952; Mota, 1954) and the results
published by Drummond (1979b; 1981) and Drummond & others (1981)• Drummond
& Shelley (1981) considered the gravity field of the region, and Drummond &
others (1982) studied structures deeper in the mantle. The purpose of this
thesis is to paraphrase the results in those papers, and to present the
results of a time term interpretation and a study of the seismic amplitudes of
some of the data. From the models so derived, inferences are drawn about the
the nature of the crust in the cratons, and about the formation of the crust
of northwest Australia during the Precambrian. The results may be of use to
geoscientists studying similar cratons in other parts of the world where
2. GEOLOGY AND GEOCHRONOLOGY OF THE PRECAMBRIAN SHIELD OF NORTHWEST
AUSTRALIA.
The geology of Western Australia is most completely described in
GSWA (1975)» More up to date, though brief, descriptions of the Precambrian
shield are given by Gee (1979a; 1979b; 1980), Horwitz & Smith (1978), and
Hallberg & Glikson (1931)• Summaries of the geochronology of the region are
to be found in Compston & Arriens (1968), Arriens (1971), de Laeter & others
(1974), Richards (1977) and de Laeter, Libby & Trendall (1981)• Brief
descriptions of the geology and geochronology of the area of the 1977 seismic
survey are in Drummond (1979b; 1981) and Drummond & others (1931) which appear
in this thesis as Appendices 1, 2 and 3, respectively. The purpose of this
chapter is to present a succinct description of those features of the geology
relevant to future discussions in this thesis. As such, it is an expanded
version of the chapters on geology in the first three appendices. However,
before the geology and geochronology are described, a few notes on tectonic
and time nomenclature are in order.
2.1 NOMENCLATURE
The tectonic nomenclature used below mostly follows that of Gee
(1979a; 1979b). Accordingly, a block is that portion of an old, stabilised
region of the basement now exposed at the surface. If the buried portion of
the basement can be delineated, the total extent of the stabilised region is
known as a craton. Consequently, the Pilbara Block discussed below is the
exposed part of the Pilbara Craton, whose limits below the younger cover
rocks can be interpreted with confidence from geological and geophysical data.
Mobile belts bound some of the margins of the cratons in the Western
Australian shield. Mobile belts are elongate regions in which crustal mobility
is expressed by magmatism, metamorphism and deformation. If the mobile belt
also has a thick pile of flysch-type sedimentary rocks in an elongate
deposit-ional trough, it is called an orogen.
The entire survey area is in a region of outcropping Precambrian
rocks. The Precambrian is traditionally subdivided into the older Archaean era
and the younger Proterozoic era. Permeating the literature on the geology of
5
L O C A L I T Y M A P
.+ 1 4 S
a ne r o z o I c
P i I b a r a / B I ock
r c h a e an
H a m e r s l e y B a s i n a n d ---C a p r i c o r n O r o g e n i c B e l t
Y i l g a r n B l o c k
+ 3 4 S
A l b a n y - F r a s e r B e l t
[image:20.555.38.525.60.640.2]and all younger Precambrian rocks are Proterozoic. On this basis, Trendall
(1975a) set the Archaean/Proterozoic boundary at 2400 m . y . , while Proterozoic
rocks are between 2400 and 600 m.y. old. The terms 'early', 'middle' and
'late' give the rock ages relative to these time boundaries, and the terms
'lower', 'middle' and 'upper' refer to the positions of the rocks in the
stratigraphic column.
With the increasing flood of isotope geochronological ages, the basal
rocks of the Hamersley Basin, which unconformably overlie the granitoid/green
stone terrains of the Pilbara Craton, appear to be older than many of the
granitoids and greenstones of the Yilgarn Craton. Thus, Gee (1980) revised
the adopted time of the Archaean/Proterozoic boundary to 2500 m.y. Further
revisions will probably be necessary as more isotopic dates become available,
and this means that literature assigning some rocks to one or the other era
will become outdated as the boundary is moved backwards and forwards in time.
The problem of defining the Archaean/Proterozoic boundary in time
would not exist if the original definition of the term 'Archaean' was applied.
Holmes (1965, p165) wrote: "The term ARCHAEAN refers to the oldest known Pre
cambrian crystalline rocks of a given region and has no other age significance"
(my underling). Thus, in the strictest usage, the Archaean rocks of a region
can be Proterozoic, in which case the expression 'Archaean/Proterozoic bound
ary' is meaningless. The Archaean/Proterozoic time boundary probably varies
from continent to continent, and, within the shield of Western Australia,
from one craton to another. For this reason, I have tried to avoid using the
terms 'Archaean' and 'Proterozoic' as indicators of time in the following dis
cussion, and generally rely on the use of absolute isotopic ages. Where the
term 'Archaean' is used, it refers to the oldest recognisable cratonic core,
as inferred from Holmes' definition.
2.2 GEOLOGICAL DESCRIPTION
The survey area is part of the Western Shield of Western Australia,
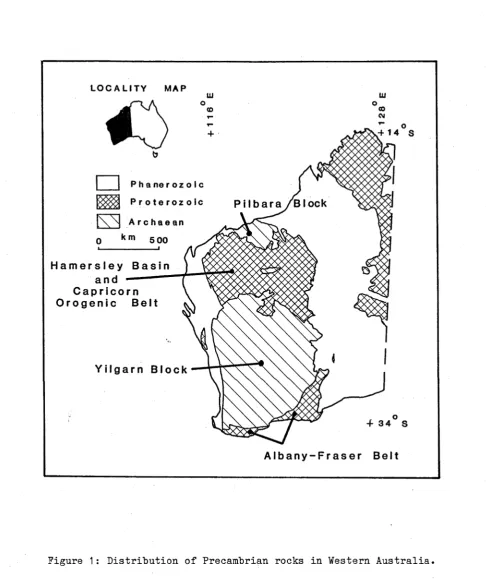
shown in Figure 1, and composed of two Archaean blocks, the Pilbara and
Yilgarn Blocks, whose structural relations are masked by the younger Protero
zoic cover rocks of the Hamersley Basin and Capricorn Orogenic Belt. Another
mobile belt, the Albany-Fraser Belt, bounds the southern margin of the Yilgarn
Block. The Darling Fault forms the western margin of the Yilgarn Block, but
younger, Phanerozoic cover rocks unconformably overlie all other boundaries.
7
Pilbara and Yilgarn Cratons
Hamersley Basin
Ashburton Trough, Glengarry Sub-Basin
Earaheedy Sub-Basin
Bangemall Basin
Gascoyne Province
Phanerozoic sedimentary basins
Gravity road traverse
---Gravity h e lico p te r traverse
• S hot p o in t
• BMR recording station • A N U recording station
• • • i
• •
\ / <
PILBARA W BLOCK
_ \ *
Pannaw onica
• . ^HAMERSLEY
Ibasin J o m Price
Paraburdoo Newm an
SYLVAW tA
BANGEMALL BASIN
^ P R O V IN C E
t EARAHEEDY" -^S U B -B A S IN • Port Hedland G o ldsw orthy
Sunrise H ill
IN D IA N OCEAN
D am pier
22 —
24°
-NABBERU BA SIN Jfi^® g&L.::
L E N G A R R Y i t \ S U B- B AS IN
Y' LG A R N B L0C K
[image:22.555.26.532.8.785.2]n o t known. The exposed p a r t o f th e W estern S h i e l d m e asu re s a p p r o x i m a t e l y 1500
km from n o r t h to s o u th and a b o u t 700 km from e a s t to w e s t . The s u r v e y area
c o v e re d t h e n o r t h e r n h a l f o f th e W estern S h i e l d .
The g e o lo g y o f th e s u r v e y a r e a i s shown i n s l i g h t l y more d e t a i l in
F i g u r e 2 . The o l d e s t i s o t o p i c d a t e s y e t r e c o r d e d i n A u s t r a l i a a r e i n th e
ra n g e 3400 to 3600 m .y . and a r e f o r r o c k s i n th e g r e e n s t o n e b e l t s o f th e
P i l b a r a B lo c k ( R i c h a r d s , 1977; P id g e o n , 1978a; H a m ilto n Sc o t h e r s , 1 9 8 0 ). The
g r e e n s t o n e b e l t s a r e composed o f v o l c a n i c r o c k s o f m a in ly u l t r a b a s i c and "basic
c o m p o s i t i o n , a l t h o u g h r o c k s o f a c i d and i n t e r m e d i a t e c o m p o s i tio n a r e also
p r e s e n t , w ith a s s o c i a t e d v o l c a n i c l a s t i c r o c k s and c l a s t i c s e d i m e n t s . They
s i n u o u s l y e n c l o s e l a r g e o v o id domes o f y o u n g er g r a n i t o i d , w ith i s o t o p i c ages
grouped aro u n d 3000 m .y . ( O v e rsb y , 1976; P id g e o n , 1978b; de L a e t e r Sc B lo c k le y ,
1972; de L a e t e r , Libby Sc T r e n d a l l , 1981; Cooper Sc o t h e r s , 1 9 8 0 ). These g r a n i t
o i d s were p r o b a b l y d e r i v e d d i r e c t l y from th e m a n t l e , o r had v e r y l i t t l e c r u s t a l
p r e h i s t o r y b e f o r e i n t r u s i o n i n t o th e u p p e r c r u s t (de L a e t e r Sc B lo c k le y , 1972),
and were i n t r u d e d i n t o th e g r e e n s t o n e s t r a t a w ith b r o a d l y c o n c o r d a n t c o n t a c t s .
The g r a n i t o i d domes and th e g r e e n s t o n e b e l t s were f u r t h e r i n t r u d e d by your.ger
g r a n i t o i d s , w i t h a g es grouped aro u n d 2600 t o 2800 m .y . (O v e rsb y , 1976; ce
L a e t e r & B l o c k l e y , 1972; de L a e t e r , Libby Sc T r e n d a l l , 1 9 8 1 ), w hich p ro b ab ly
r e s u l t e d from th e p a r t i a l m e l t i n g o f th e lo w er c r u s t (de L a e t e r Sc B lo c k le y ,
1 9 7 2 ).
The Y i l g a r n B lock a l s o h as a g r a n i t o i d / g r e e n s t o n e s t r a t i g r a p h y , b u t
w h ereas th e g r a n i t o i d s o f th e P i l b a r a B lock a r e ovoid i n s h a p e , th e g r a n i t o i d s
and g r e e n s t o n e s o f th e Y i l g a r n B lock a r e e l o n g a t e w ith a g e n e r a l n o r t h / s o u t h
t r e n d . Gee (1979a) d e f i n e d t h e W este rn G n e is s Zone, a r e g i o n o f h ig h meta-
m orphic g ra d e g n e i s s e s and g r a n u l i t e s a l o n g t h e w e s t e r n m a rg in o f th e Y ilg a rn
B lo c k , i n which th e g r a n i t o i d a g e s f a l l i n th e ra n g e 3000 to 3400 m .y.
( A r r i e n s , 1971; de L a e t e r , F l e t c h e r & o t h e r s , 1 9 8 1 ). F or th e r e s t o f the
Y i l g a r n B lo c k , most i s o t o p i c a g e s f o r g r a n i t o i d s f a l l a b o u t 2600 .m .y . The
a g e s can g e n e r a l l y be i n t e r p r e t e d as c l o s e to th e tim e th e g r a n i t o i d s were
d e r i v e d from t h e m a n t l e , a l t h o u g h O versby (1975) was a b l e to p o s t u l a t e a
p o s s i b l e c r u s t a l p r e h i s t o r y o f up to 700 m .y. f o r some g r a n i t e s i n th e Norseman
and K a l g o o r l i e r e g i o n s . The g r e e n s t o n e s may p r e d a t e th e g r a n i t o i d s by no more
th a n 100 m .y. (T u re k , 1966; Cooper Sc o t h e r s , 1978; H a l l b e r g Sc o t h e r s , 1916).
Thus th e b u lk o f th e g r a n i t o i d s i n t h e Y i l g a r n B lock a p p e a r to be th e
same age as th e th e rm a l e v e n t w hich r e m e lte d th e lo w e r c r u s t i n th e P i l b a r a
n
u
m
b
e
r
n
u
m
b
e
r
G
( a ) P i l b a r a Bl ock
3 0 0 0 2 4 0 0
3 6 0 0
a g e in m i l l i o n s of y e a r s
LEGEND
g r a n i t o i d
s u p r a c r u s t a l s
(b) Y i l g a r n Bl oc k
3 6 0 0 3 0 0 0 2 4 00
a ge in m i l l i o n s of y e a r s
[image:24.555.34.540.59.688.2]Pilbara and Yilgarn Blocks. It differs from Figure 4 of de Laeter 8c others in
several ways. The ages of rocks from the Hamersley Basin are not included with
those from the Pilbara Block; Oversby's (1975; 1976) lead ages, and not her
Rb/Sr ages were used; the ages from Leggo 8c others (1965), Cooper 8c others
(1980), Richards 8c others (1981 ), and Richards (1982) are included in the data
for the Pilbara Block, and those of de Laeter, Fletcher & others (1981),
Chapman 8c others (1980), Nieuwland 8c Compston (1980), Pidgeon (1975), Me Culloch
8c Wasserburg (1978) and Me Culloch 8c Compston (1981 ) were included in those of
the Yilgarn Block; and, where several rocks from the same locality gave similar
ages, or where several isotopic techniques were applied, only one result was
included. The histograms do not show the ages of the cratons. The dates
plotted include the times that some rocks were derived from the mantle, but
they also include the times some rocks were formed by remelting the lower crust,
and metamorphic dates. The histograms may also be influenced by the uneven
areal sampling of the blocks.
The histograms are, however, very useful indicators of thermal events.
The greenstones of the Pilbara Block have ages which are generally older than
the granitoids, and older than the bulk of the ages in the Yilgarn Block. The
histogram of the ages in the Yilgarn Block peaks at 2500 to 2600 m.y., at or
just after the time of partial melting of the lower crust of the Pilbara Block.
The rocks of the Hamersley Basin unconformably overlie the southern
margin of the Pilbara Block. Inliers of basement rock within the basin suggest
that the Pilbara Craton forms the basement of the basin. The Sylvania Dome in
Figure 2 is the only inlier large enough to plot at the scale of Figure 2.
Trendall (1979) defined the type areas and revised the stratigraphy of the
Hamersley Basin. It is made up of the basal Fortescue Group, composed mainly
of basalts and mudstones, the Hamersley Group, with banded iron formations of
remarkable lateral extent and continuity (Trendall, 1975b), clastic sediments,
and the acid Woongarra Volcanics, and the uppermost Turee Creek Group, of
clastic sediments. Together, these three groups comprise the Mount Bruce
Supergroup.
The structure of the Hamersley Basin was described by Trendall
(1975b). In the north of the present day outcrop area of the basin, the
strata dip southwards at no more than a few degrees. South of the axis of the
basin, which lies just to the northeast of a line joining Pannawonica to
however, the intensity of folding increases, with the strata folded
on approximate east/west axes. Coupled with this folding is a regular
plunge undulation, forming synclines and anticlines, with the synclines pass
ing along strike into anticlines. Archaean basement has either been exposed by
erosion or can be inferred from gravity data (Fraser, 1979a) in the cores of
the anticlines. Along the southern margin of the basin, the dips are very
steep, often near vertical, and some overturning has occurred.
The basal rocks of the Fortescue Group are probably 2700 to 2300 m.y.
old (Trendall, 1975c; Richards,' 1977; Richards & others, 1981; Richards,
1982; Hickman & de Laeter, 1977; R.T. Pidgeon, ANU, personal communication,
1978). The Woongarra Volcanics, near the top of the Hamersley Group are about
2200 m.y. old (Leggo & others, 1965), which is consistent with an age of about
2200 m.y. for the underlying Weeli Wolli Formation (de Laeter & others, 1974).
However, these are probably minimum ages for these formations. Blockley &
others(l980) suggested that the Sylvania Dome was uplifted about 2200 m.y. ago.
Thus, the Hamersley Basin was active for a period of 500 to 600 m.y. This rep
resents a time interval equal to the entire Phanerozoic.
The flysch-type clastic sediments of the Ashburton Trough (the Wyloo
Trough of Horwitz & Smith, 1978), which abuts the southern margin of the Hamer
sley Basin, were originally included with the Turee Creek Group and called
the Wyloo Group of the Mount Bruce Supergroup of the Hamersley Basin (Trendall,
1975b), but they are now recognised as younger than the Hamersley Basin strata
(Gee, 1979a). Isotopic dates for granite plutonism lie in the range 1700 to
1800 m.y. (de Laeter, 1976; Leggo & others, 1965; Williams & others, 1978),
and provide a minimum age for trough sedimentation. A tuffaceous siltstone
within the trough sediments is 1850 m.y. old (Leggo & others, 1965)
-Gee (1979b) has the Ashburton Trough coeval with the Nabberu Basin.
The structural and time relations between the two provinces are masked by
younger cover rocks. Horwitz (1975) reported a minimum K/Ar age of 1680 m.y.
for a glauconite schist in the Nabberu Basin. The stratigraphy of the Nabberu
Basin was described in detail by Hall & Goode (1973). The basin is composed
of two subbasins the Earaheedy Subbasin in the east and the Glengarry Sub
-Sub-basin in the west. The Glengarry Sub-basin lies in the survey area and
contains a thick geosynclinal sequence (Gee, 1979c) . The strata dip gently
northwards off the Yilgarn Block which they unconformably overlie, but the
intensity of folding increases to the north. The Stanley Fold Belt along the
commented on the mirror-image symmetry of folding in the Nabberu and Hamersley
Basins. Gee (1979a) included the Nabberu Basin and Ashburton Trough geosyncli
nal sequences in the Capricorn Orogen.
The Bangemall Group, which fills the Bangemall Basin and masks the
structural relations between the Ashburton Trough and Nabberu Basin is
composed of fine grained sedimentary rocks, with minor conglomerates,
breccias, tuffaceous sandstones and acid volcanics. The basin formed over a
cratonic crust (Gee, 1979a). Changes in the structureal style and facies
within the basin implied to Brakel Sc Muhling (1976) that stable basement
paralleled the southern boundary of the Pilbara Craton in the north, and the
northern boundary of the Y i l g a m Block in the south, while the central and
western portions of the basin had active basement.
Gee (1980) placed the age of the basal unconformity of the Bangemall
Basin at 1100 m.y., based on the results of Gee Sc others (1976) and Compston Sc
Arriens (1968). Richards (1982) derived an age of 1580 m.y. for galenas from a
basement high in the basin, but he does not say whether the samples are from
the basement or from basal rocks of the basin exposed near the high. The basin
may have been uplifted between 700 and 300 m.y. ago (de Laeter, 1976).
The Gascoyne Province in the west of the survey area contains reworked
and metamorphosed Archaean basement rocks, and folded and metamorphosed
rocks of the Bangemall and Nabberu Basins and the Ashburton Trough (Daniels,
1975)» The province underwent a major dynamothermal event 1700 to 1300 m.y.
ago, and a thermal event 700 m.y. ago. Granitoids which crop out within the
province were derived from partially melted basement granitoids mixed with
younger magmatic and supracrustally reworked material (de Laeter, 1976;
Williams Sc others, 1978).
The entire survey area has been a positive landmass since the
Precambrian. It is now mostly arid semi-desert covered by a thin veneer of
Tertiary and Quaternary sand and soil. Rejuvenated erosional surfaces testify
to regional uplift on several occasions since the Tertiary (Hickman Sc Lipple,
119 00 116 00
117 00 120 00
20 00
G o l d s w o r t h y G l
20 00
P ort
b o u r ne
21 00
21 00 0 0 8
PIL1 1
Pannawonica
a oo10C*
a,165 <p
22 00
22 00
«018
Tom Pr ice OJ-— V' —
T--23 00 23 00
O ^ ^ u I )
P a r a b u r d o o
,MEK21
0 6 3 ® •O o •
06 4 •
Newman
030»
25 00 25 00
»040
26 00
26 00 M EK 03*
Meekatharra
27 00
119 00
118 00 120 00
117 00
Figure 4 Survey design. Large circles indicate the shot
sites. Those at Goldsworthy (G), Shay Gap and
Sunrise Hill (A), Newman (B), Tom Price and Paraburdoo (D) and Pannawonica (F) were quarry
ing blasts at the iron ore mines. The blast at
Meekatharra (C) was especially prepared for the
survey. Small circles with a three digit number
are BMR recording stations; dots with a two
[image:28.555.54.528.52.799.2]Full details of the 1977 BMR field work are given in Drummond (1979c).
Brief summaries are given in Drummond (1979a; 19791); 1981), Drummond & others
(1981) and Drummond & Shelley (1981 ). Drummond (1979a) gave some details of the
the ANU field recording. The following description is included to make this
report complete.
One hundred and fifteen quarry blasts at the seven open-cut iron
ore mines in the Pilbara region were used as seismic sources. The mines are
at Goldsworthy (G in Figures 2 & 4), Shay Gap and Sunrise Hill (A), Newman (B),
Tom Price and Paraburdoo (D) and Pannawonica (F). The first three mines quarry
iron ore in banded iron formations in the greenstone belts of the northern
Pilbara Block. The Newman, Tom Price and Paraburdoo mines are in the banded
iron formations of the Hamersley Group in the Hamersley Basin, and the mine
at Pannawonica is in Tertiary laterites deposited along ancient stream beds,
but now exposed as the caps of mesas in the western Hamersley Basin.
The mining blasts varied in size from a few tonnes to nearly 600
tonnes. However, the blasts were designed to break rock, and not to produce
seismic energy; in fact, the seismic energy was often kept to a minimum to
avoid damage to buildings near the mines. Many of the blasts had large delays
between charges, and were spread over several benches within the mines; for
example, one Pannawonica blast had a total burning Lime of more than 2 s, while
areal extents greater than 10 km were common. Consequently, the blasts were
not efficient sources of seismic energy. The seismic energy was assumed to
originate from the centre of the blast pattern, so that some errors may occur
in the adopted effective position of some of the blasts.
Seismographs set up near the mines were used to time the explosions.
The travel times to these mine monitors were calibrated by recording at least
one blast simultaneously on the monitor recorder and on a chart recorder placed
as near as practicable to the blast. The time base used for all survey work
was the standard frequency and time signal transmission on radio station VNG,
on 4*5, 7-5 and 12 MHz.
A blast of 11 tonnes of explosives was prepared and fired in an
abandoned mine shaft at Meekatharra in the northern Yilgarn Block (C in
Figures 2 & 4). The blast was used to reverse the recording lines which
15
A rray s o f p o r t a b l e s e is m o g r a p h s were d ep lo y e d to r e c o r d t h e b l a s t s .
R e c o r d e r s were s e t up a t eac h s t a t i o n and l e f t u n t i l s u f f i c i e n t b l a s t s had been
r e c o r d e d . The a r r a y s were th e n moved to th e n e x t s e t o f s t a t i o n s . S e v e r a l
t y p e s o f r e c o r d e r s were u s e d . The BMR r e c o r d e r s were s i n g l e ( v e r t i c a l ) comp
o n e n t slow speed f r e q u e n c y m o d u la te d ta p e r e c o r d i n g s e is m o g r a p h s , d e s c r i b e d by
F i n l a y s o n & C o l l i n s ( 1 9 8 0 ) . The ANU s e is m o g r a p h s were u p d a te d v e r s i o n s o f th e
slo w s p e e d , d i r e c t r e c o r d ta p e r e c o r d e r s d e s c r i b e d by Muirhead & Simpson
( 1 9 7 2 ) , r e c o r d i n g e i t h e r one o r t h r e e components a t t h r e e g a i n l e v e l s .
The r e c o r d i n g s t a t i o n s were p o s i t i o n e d w ith an a c c u r a c y o f 100 m o r
b e t t e r u s i n g a e r i a l p h o to g r a p h s and t o p o g r a p h i c maps a t 1:100 000 s c a l e from
w hich th e c o o r d i n a t e s c o u ld be s c a l e d . I n some c a s e s , g r e a t e r a c c u r a c y was
o b t a i n e d by s e t t i n g up s t a t i o n s n e a r su rv e y e d road bench m a rk s . The s t a t i o n
s p a c i n g was g e n e r a l l y l e s s th a n 20 km. Near th e s h o t p o i n t s , a s p a c i n g o f 5 km
was u s e d ; th e maximum s p a c i n g a l o n g l i n e BD was 8 km.
The s t a t i o n numbers o f Drummond (1979c) a r e shown i n F i g u r e 4» The 137
BMR s t a t i o n s s r e shown a s s m a l l c i r c l e s w ith t h r e e d i g i t n um bers, and th e 37
ANU s t a t i o n s as d o t s w i t h two d i g i t s t a t i o n numbers w ith p r e f i x e s o f t h r e e
a l p h a b e t i c c h a r a c t e r s . A few o f th e s t a t i o n s f a i l e d , e i t h e r p a r t i a l l y o r
e n t i r e l y .
D uring p l a y b a c k o f t h e BMR t a p e s i n th e l a b o r a t o r y , th e s e i s m i c
s i g n a l s were f i r s t a n t i - a l i a s f i l t e r e d a t 20 Hz, and th e n d i g i t i s e d a t 16 ms
i n t e r v a l s . T h is meant t h a t t h e N y q u is t f r e q u e n c y o f a b o u t 31 Hz was w e ll
beyond th e l i m i t s o f t h e r e m a in in g s e i s m i c s i g n a l s . A f t e r a n t i - a l i a s f i l t e r
i n g , The ANU t a p e s were sam pled a t a b o u t 25 sam p les p e r s e c o n d , d e p e n d in g on
t h e i n s t a n t a n e o u s ta p e s p e e d . Record s e c t i o n s were th e n prod u ced f o r th e
s e i s m i c i n t e r p r e t a t i o n .
G r a v i t y c o v e r a g e o f t h e r e g i o n had p r e v i o u s l y been a t th e r e c o n n a i s s
ance s c a l e o f r e a d i n g s on an 11 km g r i d ( F r a s e r , 1979a; 1 9 7 9 b ). D u rin g t h e
s u r v e y , more th a n 2000 g r a v i t y m e asu rem en ts were made a t i n t e r v a l s o f l e s s th a n
4 km a lo n g ro a d s and t r a c k s i n th e a r e a . T o t a l m a g n e tic i n t e n s i t y was a l s o
m easured a t each o f t h e s e g r a v i t y s t a t i o n s . As w e l l , 109 g r a v i t y r e a d i n g s were
made i n i n a c c e s s i b l e r e g i o n s u s i n g a h e l i c o p t e r f o r t r a n s p o r t .
Heat flo w was m e asu re d i n s e v e r a l d r i l l h o l e s i n t h e r e g i o n ; C u ll &
Wherever possible, fresh rock samples were collected at recording
sites and from road and railway cuttings. The specific gravity and
compress-ional wave velocities at standard temperature and pressure were measured for
these samples in the laboratory after the field work. Drummond (1979c) tabul
ated the results, and Drummond & others (1981) presented some of the results
17
4. PRELIMINARY INTERPRETATION OF THE SEISMIC DATA.
4.1 DATA
I n t h e f o l l o w i n g d i s c u s s i o n , a l l o f th e d a t a a r e r e p r e s e n t e d a s r e c o r d
s e c t i o n s . U n le s s s t a t e d o t h e r w i s e i n th e f i g u r e c a p t i o n s , a l l d a t a were d i g i t
a l l y f i l t e r e d f o r d i s p l a y p u r p o s e s i n th e b a n d p a s s 0 . 5 t o 8 . 0 Hz, and no
c h an g e s were made to th e r e l a t i v e a m p l i t u d e s o f th e t r a c e s ; i e . no a d j u s t
m ents were made f o r t h e e f f e c t s o f d i f f e r e n t s h o t w e i g h t s , r e c o r d e r g a i n s , o r
f o r th e e f f e c t s o f g e o m e t r i c a l s p r e a d i n g o f th e wave f r o n t s w ith d i s t a n c e from
t h e s h o t p o i n t . A ll r e c o r d s e c t i o n s have a r e d u c e d tim e s c a l e , w ith a r e d u c t i o n
v e l o c i t y o f 8 . 0 km s . A ll tim e s r e f e r r e d to i n t h i s c h a p t e r a r e re d u c e d
t i m e s .
The m e asu re m en ts e r r o r s i n th e m easured t r a v e l tim e s s h o u ld be l e s s
t h a n 0 .0 5 s , t h i s b e i n g th e c u m u la ti v e e r r o r i n s c a l i n g b o t h th e s h o t and
a r r i v a l t i m e s , and i n a p p l y i n g c o r r e c t i o n s f o r p a r a l l a x b etw een th e c h a n n e l s
i n th e ta p e r e c o r d e r , and i n a d j u s t i n g f o r c l o c k d r i f t . However, th e s u b j
e c t i v e n a t u r e o f p i c k i n g a r r i v a l s , e s p e c i a l l y when t h e y a r e e m e r g e n t, means
t h a t th e a c t u a l e r r o r s on th e o b s e r v e d tim e s co u ld have b een as much as 0 . 2 s .
No tim e c o r r e c t i o n s were made f o r th e e f f e c t s o f to p o g r a p h y i n t h e s e ,
o r i n any o t h e r d a t a i n t h i s t h e s i s . W hile t h e maximum to p o g r a p h i c r e l i e f o v e r
th e s u r v e y a r e a i s a b o u t 1000m, from aro u n d s e a l e v e l to th e to p o f th e h i g h e s t
m o u n t a in s , t h e maximum v a r i a t i o n i n s h o t and r e c o r d e r h e i g h t s was a b o u t 500m.
The e r r o r due to t o p o g r a p h i c r e l i e f would depend on th e a n g l e o f em erg en ce,
and t h i s i n t u r n would v a r y w ith th e w a v eg ro u p s. The maximum e f e c t would be
a b o u t 0 .1 4 s f o r th e P* p h ase from t h e lo w e r c r u s t , and l e s s f o r o t h e r wave-
g r o u p s . T h e r e f o r e , th e e f f e c t s o f to p o g r a p h y a r e s m a ll and were n e g l e c t e d .
4 . 2 METHOD
The s e i s m i c s u r v e y y i e l d e d a v a s t amount o f s e i s m i c d a t a from w hich i t
was hoped a tim e term i n t e r p r e t a t i o n and a s t u d y o f s e i s m i c wave a m p l i t u d e s
would be made. However, b o th o f t h e s e m ethods r e q u i r e t h a t t h e r e i s v e r y l i t t l e
r e f r a c t o r to p o g r a p h y , and i t was t h e r e f o r e d e c id e d t h a t th e f i r s t a p p r o a c h to
i n t e r p r e t i n g th e d a t a would be made u s i n g th e i n t e r c e p t method (Ewing & o t h e r s ,
1938; D oo ley , 1952; Mota, 1 9 5 4 ). I t r e q u i r e s t h a t d a t a f a l l a lo n g l i n e a r
pairs of intercept times and apparent velocities. A computer program written
by S.P. Mathur of BMR (personal communication, 1976) automated the technique and
simplified its application.
The theoretical travel times from the models of the intercept method
inversion were then calculated using a computer program for ray tracing through
flat earth models of arbitrary two-dimensional polygonal cross section (C.D.N.
Collins, BMR, personal communication, 1973). The theoretical times were comp
ared with the record sections, and the models further perturbed until a reason
able match was obtained. In this way, topography on the refractor surfaces
could be introduced.
The theoretical times for the models generally agree to within about
0.2 s with the observed times, which is about the magnitude of the maximum
timing uncertainties. Errors of about 0.2 s imply inaccuracies in the modelled
refractor depths of 1 or perhaps 2 km. Larger errors in the refractor depths
probably arose from the assumption that the velocities within the refractors
did not vary with depth (Berry, 1971). This is discussed further in future
chapters.
4.3 SEISMIC WAVEGROUP NOMENCLATURE
The seismic wavegroup nomenclature used in the following discussion,
and in Figures 5, 7, 11, 12, 13 and 13 is as follows:
Pg
basement with velocities of 6.0-6.2 km s
- Direct waves, which travel through the near-surface crystalline
- 1
- Waves critically refracted at an intracrustal boundary, and with
velocities of 6.4-6.55 km s ' .
- Waves reflected from the intracrustal boundary and travelling with
velocities intermediate between those of the Pg and P* wavegroups.
- Waves critically refracted at the crust/mantle boundary, and having
apparent velocities in the range 7.6-8.6 km s ' .
- Waves reflected from the crust/mantle boundary, and with apparent
velocities intermediate between those of the P* and Pn wavegroups.
- Near-surface wavegroups observed where the Hamersley Basin strata
are underlain by lower velocity rocks. P waves have velocities of
- 1 - 1
about 5*9 km s , and P^ waves have velocities of 6.3-6.7 km s
- Near-critical reflections from a deep crustal layer in the northern
Yilgarn Craton and the Capricorn Orogenic Belt. They have velocities
19
-» H - a|g— Z o n e 3 — » | <
-Z one 4
WA 810 80a
F i g u r e 5: Re c or d s e c t i o n s a l o n g l i n e ABC. The r e c o r d s e c t i o n s a r e f o r : ( a ) s h o t
p o i n t G ( G o l d s w o r t h y ) s o u t h w a r d s ; ( b ) s h o t p o i n t A ( Sha y Gap & S u n r i s e H i l l ) s o u t h w a r d s ; ( c ) s h o t p o i n t B (Newman) n o r t h w a r d s ; ( d ) s h o t p o i n t B
(Newman) s o u t h w a r d s ; and ( e ) s h o t p o i n t C ( M e e k a t h a r r a ) n o r t h w a r d s . The