S H O R T R E P O R T
Open Access
Development and characterization of highly
polymorphic long TC repeat microsatellite
markers for genetic analysis of peanut
Selma E Macedo
1,2, Márcio C Moretzsohn
2, Soraya C M Leal-Bertioli
2, Dione MT Alves
1,2, Ediene G Gouvea
1,2,
Vânia CR Azevedo
2and David J Bertioli
1,3*Abstract
Background:Peanut (Arachis hypogaeaL.) is a crop of economic and social importance, mainly in tropical areas, and developing countries. Its molecular breeding has been hindered by a shortage of polymorphic genetic markers due to a very narrow genetic base. Microsatellites (SSRs) are markers of choice in peanut because they are co-dominant, highly transferrable between species and easily applicable in the allotetraploid genome. In spite of substantial effort over the last few years by a number of research groups, the number of SSRs that are polymorphic forA. hypogaeais still limiting for routine application, creating the demand for the discovery of more markers polymorphic within cultivated germplasm.
Findings:A plasmid genomic library enriched for TC/AG repeats was constructed and 1401 clones sequenced. From the sequences obtained 146 primer pairs flanking mostly TC microsatellites were developed. The average number of repeat motifs amplified was 23. These 146 markers were characterized on 22 genotypes of cultivated peanut. In total 78 of the markers were polymorphic within cultivated germplasm. Most of those 78 markers were highly informative with an average of 5.4 alleles per locus being amplified. Average gene diversity index (GD) was 0.6, and 66 markers showed a GD of more than 0.5. Genetic relationship analysis was performed and corroborated the current taxonomical classification ofA. hypogaeasubspecies and varieties.
Conclusions:The microsatellite markers described here are a useful resource for genetics and genomics inArachis. In particular, the 66 markers that are highly polymorphic in cultivated peanut are a significant step towards routine genetic mapping and marker-assisted selection for the crop.
Background
Peanut (Arachis hypogaea L.) is an oil crop of great importance in the tropics: in Africa, its production is comparable to all other grain legumes put together, and in Asia it provides about the same number of calories as soya (FAO, 2009). It has a narrow genetic base due to its recent origin event of tetraploidization [1,2], and this has hindered the application of molecular breeding in this crop.
Microsatellites or simple sequence repeats (SSRs) are useful molecular markers, are abundant, highly dis-persed through the genomes of eukaryotes, and locus
specific. In addition they are the ideal markers for geno-typing allotetraploid species, such as peanut, since they are usually co-dominant and multi-allelic. They are con-sidered suitable as tools for genetic diversity studies, genetic linkage mapping, and for use in plant breeding programs [3].
Over the past years several research groups have put considerable effort into developing SSR markers for the genusArachisin general and cultivated peanut in parti-cular. Now about 5,000 SSR markers have been published [4-21]. These markers have been mainly used for diver-sity studies of germplasm, and for genetic mapping ([10,11,22-28]. However, in spite of the number of mar-kers available, the very low polymorphism observed within cultivated germplasm requires large-scale marker screening for the identification of sufficient polymorphic
* Correspondence: [email protected] 1
Institute of Biological Sciences, Campus Darcy Ribeiro, University of Brasilia, CEP 70.910-900 Brasília, DF, Brazil
Full list of author information is available at the end of the article
markers even for low density genetic maps in populations derived from cultivated × cultivated crosses. For example, in spite of extensive marker screening, the published SSR-based maps of cultivated peanut have only 131, 135 and 175 SSR markers [22,23,28]. In a previous study, we observed that AG/TC microsatellites were more poly-morphic than AC/TG ones and that for cultivated germ-plasm, the highest polymorphism was observed for microsatellites with 21-25 motif repetitions [10]. In this context, we isolated and characterized long repeat AG/ TC SSRs as an effort to develop markers with high poly-morphism levels for cultivated peanut [10].
Findings Sequencing
Sequences were obtained for 1401 cloned genomic frag-ments. Most fragments were sequenced in both forward and reverse orientations. Of these 1401 cloned frag-ments, 65 harbored sequences very similar to already published markers and so were excluded from further analysis (≥50% of sequence with BLAST detected simi-larity with E-value≤E-40). Of the remaining sequences, 193 harbored microsatellite repeats. As expected, most were TC/AG repeats. The 143 unique SSR sequences were deposited in GenBank (accession numbers JN887491 to JN887636).
Design of flanking primer pairs
Of the 193 selected sequences, 135 were appropriate for primer design. Some sequences contained multiple microsatellite repeats that could not be flanked by a sin-gle primer pair. Therefore, in total 146 primer pairs were designed. The microsatellites amplified were gener-ally long, the average number of motif repeats being 23.
Polymorphism levels
All 146 primer pairs amplified PCR products of the expected size. Of these, 85 were polymorphic within the tetraploid samples (including cultivated peanut, a syn-thetic allotetraploid and an accession of the tetraploid wild species,A. monticola (Table 1), and 78 were poly-morphic within cultivated germplasm (Table 2).
The average number of alleles amplified per locus was 5.5, values of Gene Diversity (GD) were between 0.080 and 0.885, with an average of 0.614. Sixty-six markers were highly polymorphic with a GD of more than or equal to 0.5.
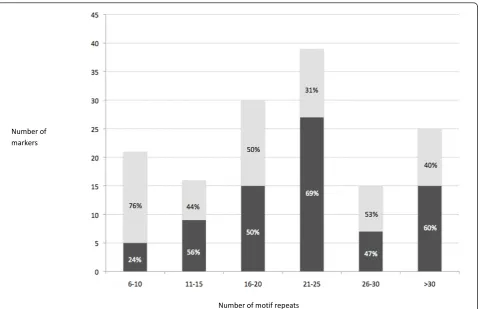
Within cultivated peanut, markers with 21-25 motif repetitions were the most polymorphic (69%), followed by markers that amplified more than 30 motif repeti-tions (60%, most of the markers being composite or imperfect) (Figure 1). The lowest polymorphism was observed with short microsatellites, between 6-10 motif repetitions.
Genic content
Thirty-six of the 135 marker sequences encoded puta-tive proteins that had significant BLAST similarities to known predicted proteins ofArabidopsisand/or legumes (E-value < 1e-07, (Additional File 1: Table S1). Of the highly polymorphic markers (GD≥ 0.5), 23% showed a significant BLAST similarity. This compares to 35% of the markers with GD < 0.5 that do not show significant BLAST similarity.
Genetic relationships
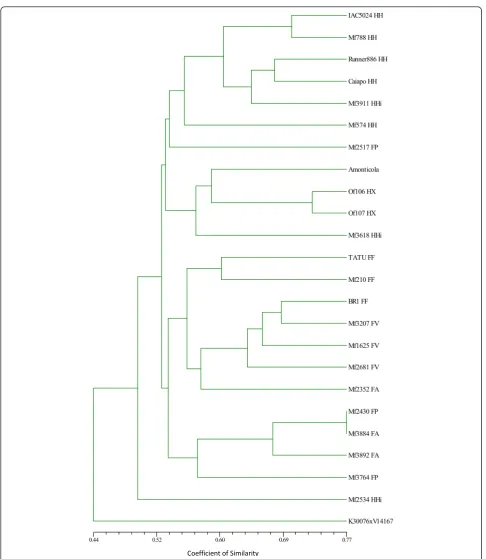
Genetic similarities were estimated by the band-sharing coefficient [29] in pairwise comparisons of the 24 geno-types (Table 1), using 78 microsatellite loci. Genetic similarity values ranged from 0.42-0.77, considering the 22A. hypogaeagenotypes used. Therefore all the geno-types were differentiated. A dendrogram based on UPGMA was constructed for the 24 genotypes (Figure 2). Cluster analysis showed two main groups according to the subspecies. Within these groups, genotypes of the same botanical varieties tended to group together.
Discussion
In spite of the considerable effort made by several research groups to develop molecular markers for culti-vated peanut, the number of polymorphic markers avail-able for this important crop is still limiting. One of the main challenges in the construction of linkage maps using populations derived from cultivated × cultivated crosses is the need to screen thousands of markers to obtain sufficient markers even for the construction of low density maps.
In this study we focused on the class of microsatellites that was shown to be the most highly polymorphic for cultivated peanut in a previous study, long TC repeats [10] For this, sequences were obtained from an enriched genomic library. For processing the sequences, the Sta-den software was used together with a module for the detection of microsatellites. Starting from a relatively large dataset of unassembled sequences, it was possible to quickly eliminate sequences that were similar to pre-viously described markers, and assemble a compact database of microsatellite containing sequences. Using a naming convention of plasmid clones, it was possible to correctly assemble microsatellite-containing reads even when the only overlap between forward and reverse sequences were microsatellite repeats. This was particu-larly important for obtaining complete sequences when the repeats were long. For design of primer pairs, the program used took into account the quality values of consensus bases. This was reflected in the 100% success rate of amplification of the primer pairs.
to be less polymorphic. This general tendency agrees with previous studies and reinforces the view that long (21-25 motif repetitions) or composite TC microsatel-lites are probably the most polymorphic marker class for cultivated peanut. A slightly higher proportion of markers that were not polymorphic or less informative (GD < 0.5) showed significant similarities to protein encoding regions, probably reflecting a tendency for non-coding regions to be more polymorphic than cod-ing regions. Overall 78 of the markers were polymorphic for the cultivated accessions and 66 of these had GD value of 0.5 or above.
Cluster analysis showed two main groups separating the two subspecies ofA. hypogaea. Some tendency of grouping of genotypes according to their botanical vari-eties was also evident. The main exceptions were three accessions, Mf2517, Mf2352, and Mf2534, which clus-tered with no apparent reason. The upper group con-tained the fivehypogaea/hypogaeagenotypes and two of the three hypogaea/hirsuta genotypes.Arachis monticola and the two genotypes collected in the Xingu
Indigenous Park also clustered in this group. The Xingu material has some morphological traits, especially in the pods, exceeding the previously variation described in cultivated peanut [30], but it seems to be closely related to hypogaea/hypogaea and hypogaea/hirsuta varieties. Our results also showed the great genetic similarity of the varietiesfastigiataandvulgaris, which formed a sub-group, andperuvianaand aequatoriana, which formed a separate subgroup. Some studies have shown that geno-types of the varietiesperuviana andaequatorianawere more closely related to genotypes of the subspecies hypogaea than to the other two varieties (fastigiataand vulgaris) of subspecies fastigiata [8,17,31,32]. Our results, in contrast, corroborated the current taxonomi-cal classification, despite the small number of genotypes included.
Conclusion
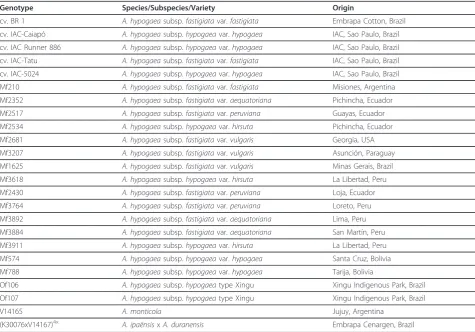
[image:3.595.57.533.99.431.2]In this study 146 new microsatellite markers were devel-oped for Arachis. All of these markers are new and use-ful tools for genetics and genomics in Arachis, but in Table 1Arachisgenotypes included in this study.
Genotype Species/Subspecies/Variety Origin
cv. BR 1 A. hypogaeasubsp.fastigiatavar.fastigiata Embrapa Cotton, Brazil
cv. IAC-Caiapó A. hypogaeasubsp.hypogaeavar.hypogaea IAC, Sao Paulo, Brazil
cv. IAC Runner 886 A. hypogaeasubsp.hypogaeavar.hypogaea IAC, Sao Paulo, Brazil
cv. IAC-Tatu A. hypogaeasubsp.fastigiatavar.fastigiata IAC, Sao Paulo, Brazil
cv. IAC-5024 A. hypogaeasubsp.hypogaeavar.hypogaea IAC, Sao Paulo, Brazil
Mf210 A. hypogaeasubsp.fastigiatavar.fastigiata Misiones, Argentina
Mf2352 A. hypogaeasubsp.fastigiatavar.aequatoriana Pichincha, Ecuador
Mf2517 A. hypogaeasubsp.fastigiatavar.peruviana Guayas, Ecuador
Mf2534 A. hypogaeasubsp.hypogaeavar.hirsuta Pichincha, Ecuador
Mf2681 A. hypogaeasubsp.fastigiatavar.vulgaris Georgia, USA
Mf3207 A. hypogaeasubsp.fastigiatavar.vulgaris Asunción, Paraguay
Mf1625 A. hypogaeasubsp.fastigiatavar.vulgaris Minas Gerais, Brazil
Mf3618 A. hypogaeasubsp.hypogaeavar.hirsuta La Libertad, Peru
Mf2430 A. hypogaeasubsp.fastigiatavar.peruviana Loja, Ecuador
Mf3764 A. hypogaeasubsp.fastigiatavar.peruviana Loreto, Peru
Mf3892 A. hypogaeasubsp.fastigiatavar.aequatoriana Lima, Peru
Mf3884 A. hypogaeasubsp.fastigiatavar.aequatoriana San Martín, Peru
Mf3911 A. hypogaeasubsp.hypogaeavar.hirsuta La Libertad, Peru
Mf574 A. hypogaeasubsp.hypogaeavar.hypogaea Santa Cruz, Bolivia
Mf788 A. hypogaeasubsp.hypogaeavar.hypogaea Tarija, Bolivia
Of106 A. hypogaeasubsp.hypogaeatype Xingu Xingu Indigenous Park, Brazil
Of107 A. hypogaeasubsp.hypogaeatype Xingu Xingu Indigenous Park, Brazil
V14165 A. monticola Jujuy, Argentina
(K30076xV14167)4x A. ipaënsisxA. duranensis Embrapa Cenargen, Brazil
Genotypes ofArachis hypogaea, A. monticola, and a synthetic allotetraploid used for SSR marker validation and for genetic relationship analysis.Arachis hypogaea
genotypes represent both subspecies (hypogaeaandfastigiata) and the six botanical varieties (hypogaea, hirsuta, fastigiata, vulgaris, aequatoriana, andperuviana). (K30076xV14167)4×
particular the set of 66 markers highly polymorphic for cultivated peanut are a significant step towards routine molecular breeding in this important crop.
Methods
Plant material and DNA extraction
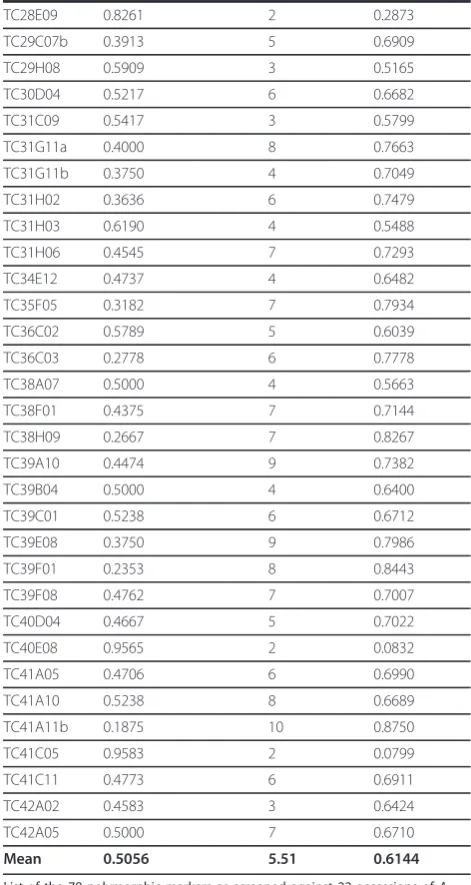
[image:4.595.57.290.101.733.2] [image:4.595.303.539.102.545.2]For construction of an SSR-enriched genomic DNA library, the peanut genotype A. hypogaea subsp. fasti-giatavar.fastigiatacv. IAC-Tatu was used. For marker validation and genetic relationship analysis, the follow-ing panel was used: a set of 22 A. hypogaeagenotypes representing all six botanical varieties, a synthetic Table 2 List of the 78 polymorphic markers.
Marker name
Major Allele Frequency
Allele number
Gene Diversity
TC13C03 0.4737 3 0.5873
TC13E05 0.4773 8 0.7118
TC14B08 0.5000 5 0.6621
TC14H09 0.9565 2 0.0832
TC15F12 0.3182 12 0.8388
TC16A10a 0.6786 6 0.5102
TC16A10b 0.3333 5 0.7222
TC19A02a 0.6667 2 0.4444
TC19A02b 0.5238 4 0.6270
TC19B07 0.2500 8 0.8472
TC19E01 0.6667 3 0.5000
TC20B05 0.4762 7 0.7086
TC20D05 0.4545 7 0.6374
TC20E08 0.4231 5 0.7278
TC21A09 0.5435 4 0.6011
TC21C03 0.5000 6 0.6791
TC21D06a 0.9286 2 0.1327
TC21D06b 0.3913 3 0.6578
TC21G01 0.2368 6 0.8075
TC22B07 0.9583 2 0.0799
TC22D09 0.8125 3 0.3116
TC22G05 0.4750 5 0.5700
TC22H12 0.5217 6 0.6522
TC23B10 0.4565 5 0.6408
TC23C08a 0.8158 3 0.3144
TC23C08b 0.9348 3 0.1238
TC23D04 0.3043 6 0.7741
TC23E04a 0.3750 6 0.7188
TC23E04b 0.5000 4 0.5564
TC23F04 0.8696 4 0.2382
TC23F09 0.5000 3 0.5450
TC23H10 0.2273 10 0.8636
TC24A06 0.3214 7 0.7985
TC24B05 0.2000 12 0.8850
TC24C06a 0.3182 10 0.8068
TC24D06b 0.6042 5 0.5460
TC24D12 0.5500 3 0.5950
TC24E01 0.9583 2 0.0799
TC24G10 0.5000 5 0.6796
TC25B04 0.4000 7 0.7025
TC25F03 0.5833 5 0.5747
TC25G11 0.3478 7 0.7561
TC27H12 0.6042 5 0.5868
TC28A12 0.2917 8 0.8090
TC28B01 0.2381 8 0.8345
TC28B07 0.4750 8 0.7213
Table 2 List of the 78 polymorphic markers.(Continued)
TC28E09 0.8261 2 0.2873
TC29C07b 0.3913 5 0.6909
TC29H08 0.5909 3 0.5165
TC30D04 0.5217 6 0.6682
TC31C09 0.5417 3 0.5799
TC31G11a 0.4000 8 0.7663
TC31G11b 0.3750 4 0.7049
TC31H02 0.3636 6 0.7479
TC31H03 0.6190 4 0.5488
TC31H06 0.4545 7 0.7293
TC34E12 0.4737 4 0.6482
TC35F05 0.3182 7 0.7934
TC36C02 0.5789 5 0.6039
TC36C03 0.2778 6 0.7778
TC38A07 0.5000 4 0.5663
TC38F01 0.4375 7 0.7144
TC38H09 0.2667 7 0.8267
TC39A10 0.4474 9 0.7382
TC39B04 0.5000 4 0.6400
TC39C01 0.5238 6 0.6712
TC39E08 0.3750 9 0.7986
TC39F01 0.2353 8 0.8443
TC39F08 0.4762 7 0.7007
TC40D04 0.4667 5 0.7022
TC40E08 0.9565 2 0.0832
TC41A05 0.4706 6 0.6990
TC41A10 0.5238 8 0.6689
TC41A11b 0.1875 10 0.8750
TC41C05 0.9583 2 0.0799
TC41C11 0.4773 6 0.6911
TC42A02 0.4583 3 0.6424
TC42A05 0.5000 7 0.6710
Mean 0.5056 5.51 0.6144
allotetraploid (derived from a cross betweenA. ipaënsis and A. duranensis) and an accession of the tetraploid wild species,A. monticola(Table 1). Marker polymorph-ism was also assessed in parents of four mapping popu-lations:A. duranensis K7988 ×A.stenospermaV10309 [10,25],A. ipaënsisKG30076 ×A. magnaKG30097 [11], A. hypogaeasubsp. hypogaeavar.hypogaea cv. Runner IAC 886, andA. hypogaeasubsp. fastigiatavar. vulgaris cv. Fleur 11 × a synthetic amphidiploid [24] (Additional file 1).
Total genomic DNA was isolated from young leaves using the CTAB-based protocol described by Grattapa-glia and Sederoff [33] modified by the inclusion of an additional precipitation step with 1.2 M NaCl. DNA quality and concentration were estimated on agarose gel electrophoresis and by spectrophotometry (Genesys 4 -Spectronic, Unitech, USA).
Construction of SSR-enriched library
A genomic DNA library enriched for the dinucleotide repeats TC/AG was constructed as described by Moretz-sohn [10]. About nine micrograms of DNA were digested withSau3AI (Amersham Biosciences, UK) and
electrophoresed in 0.8% low melting agarose gels to select fragments ranging from 200-600 bp. The selected fragments were purified from the agarose gels using phenol/chloroform, and ligated into Sau3AI specific adaptors (5’-cagcctagagccgaattcacc-3’ and 5’ -gatcggt-gaaatcggctcaggctg-3’). The ligated fragments were hybri-dized to biotinylated (AG)15 oligonucleotides and isolated using streptavidin-coated magnetic beads (Dynabeads Streptavidin, Dynal Biotech, Norway). The eluted fragments were amplified using one adaptor-spe-cific primer, cloned into the pGEM-T Easy vector (Pro-mega, WI, USA) and transformed into XL1-Blue E. coli cells with blue/white selection (Invitrogen, CA, USA). Plasmid DNAs of the positive clones were isolated by the alkaline lysis method. Sequencing reactions were performed with T7 and SP6 primers and the Big-Dye Terminator Cycle Sequencing Kit, version 3.1 (Applied Biosystems, CA, USA) using the ABI Prism 377 auto-mated DNA sequencer.
SSR marker development and validation
Sequences were processed and assembled by using the Staden package [34] with the repeat sequence finding
EƵŵďĞƌŽĨŵŽƚŝĨƌĞƉĞĂƚƐ EƵŵďĞƌŽĨ
[image:5.595.60.541.87.396.2]ŵĂƌŬĞƌƐ
Coefficient
0.44 0.52 0.60 0.69 0.77
IAC5024 HH
Mf788 HH
Runner886 HH
Caiapo HH
Mf3911 HHi
Mf574 HH
Mf2517 FP
Amonticola
Of106 HX
Of107 HX
Mf3618 HHi
TATU FF
Mf210 FF
BR1 FF
Mf3207 FV
Mf1625 FV
Mf2681 FV
Mf2352 FA
Mf2430 FP
Mf3884 FA
Mf3892 FA
Mf3764 FP
Mf2534 HHi
K30076xV14167
[image:6.595.56.543.83.643.2]ŽĞĨĨŝĐŝĞŶƚŽĨ^ŝŵŝůĂƌŝƚLJ
module TROLL [35] and Primer3 for primer design [36], using a module developed by Martins et al. [37]. Sequences with more than ten motif repeats were cho-sen for primer design. Some sequences with BLASTX hits to genes of interest were also included in spite of having fewer than ten motif repeats. The parameters for primer design were: (1) primer size ranging from 18 bp to 25 bp with an optimal length of 20 bp; (2) primer Tm(melting temperature) ranging from 57°C to 63°C with an optimal temperature of 60°C; and (3) GC con-tent ranging from 40%-60%. Default values were used for the other parameters.
PCR reactions contained 10 ng of genomic DNA, 1 U of TaqDNA polymerase (Amersham Biosciences, UK), 1× PCR buffer (200 mM Tris pH 8.4, 500 mM KCl), 1.5-2.0 mM MgCl2, 200μM of each dNTP, and 0.4μM of each primer, in a final reaction volume of 10 μl. Amplifications were carried out in a PTC 100 thermocy-cler (MJ Research Inc., MA, USA). PCR conditions were: 96°C for 5 min, followed by 30 cycles of 94°C for 1 min, 48-62°C (annealing temperature depending on primer pair, see Additional file 1).
Total genomic DNA was isolated from young leaves using the CTAB-based protocol described by Grattapa-glia and Sederoff [33] modified by the inclusion of an additional precipitation step with 1.2 M NaCl. DNA quality and concentration were estimated on agarose gel electrophoresis and by spectrophotometry (Genesys 4 -Spectronic, Unitech, USA).
Construction of SSR-enriched library
A genomic DNA library enriched for the dinucleotide repeats TC/AG was constructed as described by Moretz-sohn [10]. About nine micrograms of DNA were digested withSau3AI (Amersham Biosciences, UK) and electrophoresed in 0.8% low melting agarose gels to select fragments ranging from 200-600 bp. The selected fragments were purified from the agarose gels using phenol/chloroform, and ligated into Sau3AI specific adaptors (5’-cagcctagagccgaattcacc-3’ and 5’ -gatcggt-gaaatcggctcaggctg-3’). The ligated fragments were hybri-dized to biotinylated (AG)15 oligonucleotides and isolated using streptavidin-coated magnetic beads (Dynabeads Streptavidin, Dynal Biotech, Norway). The eluted fragments were amplified using one adaptor-spe-cific primer, cloned into the pGEM-T Easy vector (Pro-mega, WI, USA) and transformed into XL1-BlueE. coli cells with blue/white selection (Invitrogen, CA, USA). Plasmid DNAs of the positive clones were isolated by the alkaline lysis method. Sequencing reactions were performed with T7 and SP6 primers and the Big-Dye Terminator Cycle Sequencing Kit, version 3.1 (Applied Biosystems, CA, USA) using the ABI Prism 377 auto-mated DNA sequencer.
SSR marker development and validation
Sequences were processed and assembled by using the Staden package [34] with the repeat sequence finding module TROLL [35] and Primer3 for primer design [36], using a module developed by Martins et al. [37]. Sequences with more than ten motif repeats were cho-sen for primer design. Some sequences with BLASTX hits to genes of interest were also included in spite of having fewer than ten motif repeats. The parameters for primer design were: (1) primer size ranging from 18 bp to 25 bp with an optimal length of 20 bp; (2) primer Tm(melting temperature) ranging from 57°C to 63°C with an optimal temperature of 60°C; and (3) GC con-tent ranging from 40%-60%. Default values were used for the other parameters.
PCR reactions contained 10 ng of genomic DNA, 1 U of TaqDNA polymerase (Amersham Biosciences, UK), 1× PCR buffer (200 mM Tris pH 8.4, 500 mM KCl), 1.5-2.0 mM MgCl2, 200μM of each dNTP, and 0.4μM of each primer, in a final reaction volume of 10 μl. Amplifications were carried out in a PTC 100 thermocy-cler (MJ Research Inc., MA, USA). PCR conditions were: 96°C for 5 min, followed by 30 cycles of 94°C for 1 min, 48-62°C (annealing temperature depending on primer pair, see Additional file 1).
Total genomic DNA was isolated from young leaves using the CTAB-based protocol described by Grattapa-glia and Sederoff [33] modified by the inclusion of an additional precipitation step with 1.2 M NaCl. DNA quality and concentration were estimated on agarose gel electrophoresis and by spectrophotometry (Genesys 4 -Spectronic, Unitech, USA).
Construction of SSR-enriched library
Terminator Cycle Sequencing Kit, version 3.1 (Applied Biosystems, CA, USA) using the ABI Prism 377 auto-mated DNA sequencer.
SSR marker development and validation
Sequences were processed and assembled by using the Staden package [34] with the repeat sequence finding module TROLL [35] and Primer3 for primer design [36], using a module developed by Martins et al. [37]. Sequences with more than ten motif repeats were cho-sen for primer design. Some sequences with BLASTX hits to genes of interest were also included in spite of having fewer than ten motif repeats. The parameters for primer design were: (1) primer size ranging from 18 bp to 25 bp with an optimal length of 20 bp; (2) primer Tm(melting temperature) ranging from 57°C to 63°C with an optimal temperature of 60°C; and (3) GC con-tent ranging from 40%-60%. Default values were used for the other parameters.
PCR reactions contained 10 ng of genomic DNA, 1 U of TaqDNA polymerase (Amersham Biosciences, UK), 1× PCR buffer (200 mM Tris pH 8.4, 500 mM KCl), 1.5-2.0 mM MgCl2, 200μM of each dNTP, and 0.4μM of each primer, in a final reaction volume of 10 μl. Amplifications were carried out in a PTC 100 thermocy-cler (MJ Research Inc., MA, USA). PCR conditions were: 96°C for 5 min, followed by 30 cycles of 94°C for 1 min, 48-62°C (annealing temperature depending on primer pair, see Additional file 1).
Total genomic DNA was isolated from young leaves using the CTAB-based protocol described by Grattapa-glia and Sederoff [33] modified by the inclusion of an additional precipitation step with 1.2 M NaCl. DNA quality and concentration were estimated on agarose gel electrophoresis and by spectrophotometry (Genesys 4 -Spectronic, Unitech, USA).
Construction of SSR-enriched library
A genomic DNA library enriched for the dinucleotide repeats TC/AG was constructed as described by Moretz-sohn [10]. About nine micrograms of DNA were digested withSau3AI (Amersham Biosciences, UK) and electrophoresed in 0.8% low melting agarose gels to select fragments ranging from 200-600 bp. The selected fragments were purified from the agarose gels using phenol/chloroform, and ligated into Sau3AI specific adaptors (5’-cagcctagagccgaattcacc-3’ and 5’ -gatcggt-gaaatcggctcaggctg-3’). The ligated fragments were hybri-dized to biotinylated (AG)15 oligonucleotides and isolated using streptavidin-coated magnetic beads (Dynabeads Streptavidin, Dynal Biotech, Norway). The eluted fragments were amplified using one
adaptor-specific primer, cloned into the pGEM-T Easy vector (Promega, WI, USA) and transformed into XL1-BlueE. coli cells with blue/white selection (Invitrogen, CA, USA). Plasmid DNAs of the positive clones were iso-lated by the alkaline lysis method. Sequencing reactions were performed with T7 and SP6 primers and the Big-Dye Terminator Cycle Sequencing Kit, version 3.1 (Applied Biosystems, CA, USA) using the ABI Prism 377 automated DNA sequencer.
SSR marker development and validation
Sequences were processed and assembled by using the Staden package [34] with the repeat sequence finding module TROLL [35] and Primer3 for primer design [36], using a module developed by Martins et al. [37]. Sequences with more than ten motif repeats were cho-sen for primer design. Some sequences with BLASTX hits to genes of interest were also included in spite of having fewer than ten motif repeats. The parameters for primer design were: (1) primer size ranging from 18 bp to 25 bp with an optimal length of 20 bp; (2) primer Tm(melting temperature) ranging from 57°C to 63°C with an optimal temperature of 60°C; and (3) GC con-tent ranging from 40%-60%. Default values were used for the other parameters.
PCR reactions contained 10 ng of genomic DNA, 1 U of TaqDNA polymerase (Amersham Biosciences, UK), 1× PCR buffer (200 mM Tris pH 8.4, 500 mM KCl), 1.5-2.0 mM MgCl2, 200μM of each dNTP, and 0.4μM of each primer, in a final reaction volume of 10 μl. Amplifications were carried out in a PTC 100 thermocy-cler (MJ Research Inc., MA, USA). PCR conditions were: 96°C for 5 min, followed by 30 cycles of 94°C for 1 min, 48-62°C (annealing temperature depending on primer pair, see Additional file 1) for 1 min, 72°C for 1 min, with a final extension for 10 min at 72°C. PCR products were separated by electrophoresis on denaturing polya-crylamide gels (6% apolya-crylamide:bisapolya-crylamide 29:1, 5 M urea in TBE pH 8.3), stained with silver nitrate [38].
Data analyses
Additional material
Additional file 1: Table S1. Marker homologies and information. The file provides information on all markers used in this work: marker name, primer sequence, SSR motif, GenBank number, PCR conditions, fragment length, sequence homologies and if the primers are polymorphic (P) or monomorphic (M) for parents of four mapping populations.
Acknowledgements
The authors would like to acknowledge CNPq for a Research fellowship for DB, and Student fellowships for DMTA and EGG, Generation Challenge Programme project TLI and host institutions. We also acknowledge GS, IG and JV for providing the accessions included.
Author details
1Institute of Biological Sciences, Campus Darcy Ribeiro, University of Brasilia,
CEP 70.910-900 Brasília, DF, Brazil.2Embrapa Genetic Resources and Biotechnology, PqEB W5 Norte Final, CP 02372, CEP 70.770-900 Brasília, DF, Brazil.3Biotechnology and Genomic Sciences, Catholic University of Brasilia, SGAN 916 Avenida W5, CEP 70.790-160 Brasilia, DF, Brazil.
Authors’contributions
SEM participated in the experimental work, the identification of SSRs, primer design, and marker screening. EGG and DMTA participated in marker screening. DJB and MCM participated in the design and implementation of the study, supervision of the work and processing interpretation of the results. SCML-B participated in data analysis, microsatellite marker validation and drafted the manuscript. VCRA participated in the construction of SSR-enriched library. All authors read and approved the final manuscript.
Competing interests
The authors declare that they have no competing interests.
Received: 25 October 2011 Accepted: 3 February 2012 Published: 3 February 2012
References
1. Halward TM, Stalker HT, Larue EA, Kochert G:Genetic variation detectable with molecular markers among unadapted germ-plasm resources of cultivated peanut and related wild species.Genome1991,34:1013-1020. 2. Kochert G, Halward T, Branch WD, Simpson CE:RFLP variability in peanut
(Arachis hypogaeaL.) cultivars and wild species.Theor Appl Genet1991, 81(5):565-570.
3. Collard B, Jahufer M, Brouwer J, Pang E:An introduction to markers, quantitative trait loci (QTL) mapping and marker-assisted selection for crop improvement: The basic concepts.Euphytica2005,142(1):169-196. 4. He G, Meng R, Gao H, Guo B, Newman M, Pittman RN, Prakash CS:Simple
sequence repeat markers for botanical varieties of cultivated peanut (Arachis hypogaeaL.).Euphytica2005,142:131-136.
5. Wei X, Liu L, Cui S, Chen H, Zhang J:Development of EST-SSR markers in peanut (Arachis hypogaea L.).Frontiers of Agriculture in China2011, 5(3):268-273.
6. Hopkins M, Casa A, Wang T, Mitchell S, Dean R, Kochert G, Kresovich S: Discovery and characterization of polymorphic simple sequence repeats (SSRS) in peanut.Crop Science1999,39:1243-1247.
7. He G, Meng R, Newman M, Gao G, Pittman RN, Prakash CS:Microsatellites as DNA markers in cultivated peanut (Arachis hypogaea L.).BMC Plant Biol2003,3:3.
8. Ferguson ME, Burow MD, Schulze SR, Bramel PJ, Paterson AH, Kresovich S, Mitchell S:Microsatellite identification and characterization in peanut (A. hypogaeaL.).Theor Appl Genet2004,108:1064-1070.
9. Moretzsohn MC, Hopkins MS, Mitchell SE, Kresovich S, Valls JFM, Ferreira ME: Genetic diversity of peanut (Arachis hypogaea L.) and its wild relatives based on the analysis of hypervariable regions of the genome.BMC Plant Biol2004,4:11.
10. Moretzsohn M, Leoi L, Proite K, Guimarães P, Leal-Bertioli S, Gimenes M, Martins W, Valls J, Grattapaglia D, Bertioli D:A microsatellite-based,
gene-rich linkage map for the AA genome ofArachis(Fabaceae).Theor Appl Genet2005,111(6):1060-1071.
11. Moretzsohn MC, Barbosa AVG, Alves-Freitas DMT, Teixeira C, Leal-Bertioli SCM, Guimaraes PM, Pereira RW, Lopes CR, Cavallari MM, Valls JFM, et al:A linkage map for the B-genome ofArachis(Fabaceae) and its synteny to the A-genome.BMC Plant Biol2009,9:40.
12. Gimenes M, Hoshino A, Barbosa A, Palmieri D, Lopes C:Characterization and transferability of microsatellite markers of the cultivated peanut (Arachis hypogaea).BMC Plant Biology2007,7(9), doi:10.1186/1471-2229-7-9. 13. Bravo JP, Hoshino AA, Angelici C, Lopes CR, Gimenes MA:Transferability
and use of microsatellite markers for the genetic analysis of the germplasm of someArachissection species of the genusArachis. Genetics and Molecular Biology2006,29(3):516-524.
14. Proite K, Leal-Bertioli S, Bertioli D, Moretzsohn M, da Silva F, Martins N, Guimaraes P:ESTs from a wild Arachis species for gene discovery and marker development.BMC Plant Biol2007,7(1):7.
15. Methylation-filtered and shotgun genomic sequences for diploid and tetraploid peanut taxa.[http://www.ncbi.nlm.nih.gov/].
16. Wang CT, Yang XD, Chen D, Lin Yu SX, Liu GZ, Tang YY, Xu JZ:Isolation of simple sequence repeats from groundnut.Electronic Journal of Biotechnology2007,10:473-480.
17. Cuc LM, Mace ES, Crouch JH, Quang VD, Long TD, Varshney RK:Isolation and characterization of novel microsatellite markers and their application for diversity assessment in cultivated groundnut (Arachis hypogaea L.).BMC Plant Biol2008,8:55.
18. Liang X, Chen X, Hong Y, Liu H, Zhou G, Li S, Guo B:Utility of EST-derived SSR in cultivated peanut (Arachis hypogaeaL.) andArachiswild species. BMC Plant Biol2009,9(1):35.
19. Song GQ, Li MJ, Xiao H, Wang XJ, Tang RH, Xia H, Zhao CZ, Bi YP:EST sequencing and SSR marker development from cultivated peanut (Arachis hypogaeaL.).Electronic Journal of Biotechnology2010,13:7-8. 20. Yuan M, Gong L, Meng R, Li S, Dang P, Guo B, He G:Development of
trinucleotide (GGC)n SSR markers in peanut (Arachis hypogaea L.). Electronic Journal of Biotechnology2010,13:5-6.
21. Koilkonda P, Sato S, Tabata S, Shirasawa K, Hirakawa H, Sakai H, Sasamoto S, Watanabe A, Wada T, Kishida Y,et al:Large-scale development of expressed sequence tag-derived simple sequence repeat markers and diversity analysis inArachisspp.Molecular Breeding2011, online first doi:10.1007/s11032-011-9604-8.
22. Hong YB, Chen XP, Liang XQ, Liu HY, Zhou GY, Li SX, Wen SJ, Holbrook CC, Guo BZ:A SSR-based composite genetic linkage map for the cultivated peanut (Arachis hypogaeaL.) genome.BMC Plant Biol2010,10:1-13. 23. Hong YB, Liang XQ, Chen XP, Liu HY, Zhou GY, Li SX, Wen SJ:Construction
of Genetic Linkage Map Based on SSR Markers in Peanut (Arachis hypogaea L.).Agricultural Sciences in China2008,7(8):915-921. 24. Foncéka D, Hodo-Abalo T, Rivallan R, Faye I, Sall M, Ndoye O, Favero A,
Bertioli DJ, Glaszmann J-C, Courtois B,et al:Genetic mapping of wild introgressions into cultivated peanut: a way toward enlarging the genetic basis of a recent allotetraploid.BMC Plant Biol2009,9(1):103. 25. Leal-Bertioli SCM, Jose ACVF, Alves-Freitas DMT, Moretzsohn MC,
Guimaraes PM, Nielen S, Vidigal BS, Pereira RW, Pike J, Favero AP,et al: Identification of candidate genome regions controlling disease resistance inArachis.BMC Plant Biol2009,9(1):112.
26. Varshney RK, Mahendar T, Aruna R, Nigam SN, Neelima K, Vadez V, Hoisington DA:High level of natural variation in a groundnut (Arachis hypogaea L.) germplasm collection assayed by selected informative SSR markers.Plant Breeding2009,128(5):486-494.
27. Sarvamangala C, Gowda MVC:Varshney RK:. Identification of quantitative trait loci for protein content, oil content and oil quality for groundnut (Arachis hypogaea L.).Field Crop Res2011,122(1):49-59.
28. Varshney RK, Bertioli DJ, Moretzsohn MC, Vadez V, Krishnamurty L, Aruna R, Nigam SN, Ravi K, He G, Knapp SJ,et al:The first SSR based genetic linkage map for cultivated groundnut (Arachis hypogaeaL.).Theor Appl Genet2009,118:729-739.
29. Lynch M:The Similarity Index and DNA Fingerprinting.Mol Biol Evol1990, 7:478-484.
30. Freitas F, Moretzsohn M, Valls J:Genetic variability of Brazilian Indian landraces ofArachis hypogaeaL.Genet Mol Res2007,6:675-684. 31. He G, Prakash C:Evaluation of genetic relationships among botanical
32. Raina SN, Rani V, Kojima T, Ogihara Y, Singh KP, Devarumath RM:RAPD and ISSR fingerprints as useful genetic markers for analysis of genetic diversity, varietal identification, and phylogenetic relationships in peanut (Arachis hypogaea) cultivars and wild species.Genome2001,44:763-772. 33. Grattapaglia D, Sederoff R:Genetic linkage maps ofEucalyptus grandis
andEucalyptus urophyllausing a pseudo-testcross: mapping strategy and RAPD markers.Genetics1994,137:1121-1137.
34. Staden R:The Staden sequence analysis package.Mol Biotechnol1996, 5(3):233-241.
35. Castelo AT, Martins W, Gao GR:TROLL - Tandem Repeat Occurrence Locator.Bioinformatics2002,18(4):634-636.
36. Rozen S, Skaletsky H:Primer3 on the WWW for General Users and for Biologist Programmers.Bioinformatics Methods and Protocols: Methods in Molecular Biology2000,132(3):365-386.
37. Martins W, de Sousa D, Proite K, Guimaraes P, Moretzsohn M, Bertioli D: New softwares for automated microsatellite marker development. Nucleic Acids Res2006,34(4):e31.
38. Creste S, Yulmann-Neto A, Figueira A:Detection of Single Sequence Repeat polymorphisms in denaturing polyacrylamide sequencing gels by silver staining.Plant Molecular Biology Reporter2001,19:299-306. 39. Liu K, Muse S:PowerMarker: an integrated analysis environment for
genetic marker analysis.Bioinformatics2005,21(9):2128-2129. 40. Mantel N:The detection of disease clustering and a generalized
regression approach.Cancer Res1967,27:209-220.
41. NTSYSpc: numerical taxonomy system. ver. 2.21.[http://www. exetersoftware.com/cat/ntsyspc/ntsyspc.html].
doi:10.1186/1756-0500-5-86
Cite this article as:Macedoet al.:Development and characterization of highly polymorphic long TC repeat microsatellite markers for genetic analysis of peanut.BMC Research Notes20125:86.
Submit your next manuscript to BioMed Central and take full advantage of:
• Convenient online submission
• Thorough peer review
• No space constraints or color figure charges
• Immediate publication on acceptance
• Inclusion in PubMed, CAS, Scopus and Google Scholar
• Research which is freely available for redistribution