R E S E A R C H A R T I C L E
Open Access
Selection of reliable reference genes for
quantitative real-time PCR in human T cells and
neutrophils
Carola Ledderose
1,2, Jens Heyn
2, Elisabeth Limbeck
2and Simone Kreth
2*Abstract
Background:The choice of reliable reference genes is a prerequisite for valid results when analyzing gene expression with real-time quantitative PCR (qPCR). This method is frequently applied to study gene expression patterns in immune cells, yet a thorough validation of potential reference genes is still lacking for most leukocyte subtypes and most models of their in vitro stimulation. In the current study, we evaluated the expression stability of common reference genes in two widely used cell culture models-anti-CD3/CD28 activated T cells and
lipopolysaccharide stimulated neutrophils-as well as in unselected untreated leukocytes.
Results:The mRNA expression of 17 (T cells), 7 (neutrophils) or 8 (unselected leukocytes) potential reference genes was quantified by reverse transcription qPCR, and a ranking of the preselected candidate genes according to their expression stability was calculated using the programs NormFinder, geNorm and BestKeeper.IPO8,RPL13A,TBPand SDHAwere identified as suitable reference genes in T cells. TBP,ACTBandSDHAwere stably expressed in
neutrophils.TBPandSDHAwere also the most stable genes in untreated total blood leukocytes. The critical impact of reference gene selection on the estimated target gene expression is demonstrated forIL-2andFIHexpression in T cells.
Conclusions:The study provides a shortlist of suitable reference genes for normalization of gene expression data in unstimulated and stimulated T cells, unstimulated and stimulated neutrophils and in unselected leukocytes.
Background
Due to its high sensitivity, specificity and resolution, quantitative real-time PCR (qPCR) has become the method of choice for gene expression analyses of selected genes [1-3]. However, reverse transcription (RT) qPCR measurements are influenced by a variety of unspecific factors, including the amount and quality of the isolated RNA and efficiencies of reverse transcrip-tion and PCR amplificatranscrip-tion, which makes accurate nor-malization a prerequisite for reliable results [1,4-6]. The most commonly applied normalization strategy involves the use of reference genes as internal controls, whose expression should be constant in all samples under investigation [7]. Since it has become clear, though, that conventional reference genes, such as
glyceraldehyde-3-phosphate dehydrogenase (GAPDH) orb-actin (ACTB), are regulated under certain circumstances leading to invalid results [7,8], it is essential to validate the suitabil-ity of potential reference genes for the specific experi-mental conditions.
The study of gene expression patterns in immune cells is a promising approach to gain insight into complex regulatory mechanisms associated with immune-mediated disease [9]. Although RT-qPCR is frequently employed for gene expression analysis in leukocytes, a thorough validation of reference gene stability has not been described yet. Data are not only missing for the appropriate normalization of mRNA levels in unselected leukocytes, but are also scarce with respect to leukocyte subtypes or activation procedures [10-12]. Stimulating T cells with anti-CD3/CD28 beads to mimic the activation by antigen-presenting cells [13], for example, or treating neutrophils with lipopolysaccharide (LPS) [14-16] are two well-established in vitro models in the investigation * Correspondence: [email protected]
2
Department of Anesthesiology, Ludwig-Maximilians-University Munich, Germany
Full list of author information is available at the end of the article
of inflammatory, infectious or autoimmune disease; a systematic validation of reference gene stability has thus far been lacking for either model, though.
In the present study we investigated the expression stability of potential reference genes in unstimulated and anti-CD3/CD28 activated T cells and in unstimu-lated and LPS-stimuunstimu-lated neutrophils, using the three software applications geNorm [6], NormFinder [4] and BestKeeper [5]. Based on these results, we further iden-tified reference genes that can be used as universal nor-malizers in gene expression studies in unselected leukocyte populations. Furthermore, we show that the use of unstable reference genes is prone to cause highly misleading results, which underlines the importance of a thorough selection and evaluation of reference genes for RT-qPCR experiments in immune cells.
Methods
Isolation and stimulation of T lymphocytes and neutrophils
Blood withdrawal from healthy volunteers was approved by the institutional ethics committee of the Ludwig Maximilians University, Munich, Germany, and written informed consent was obtained. T cells were isolated from peripheral blood mononuclear cells by negative selection using the Pan T cell isolation kit II (Miltenyi Biotec) according to the manufacturer’s instructions. Neutrophils were separated from whole blood by conti-nous percoll gradient density centrifugation as pre-viously described [17]. Cells were cultured in RPMI-1640 medium (Sigma-Aldrich) supplemented with 10% heat-inactivated fetal calf serum (Biochrom) and L-glu-tamine (Gibco) at 37°C in 5% CO2. T cells (1 × 10⁶/ml) were stimulated with anti-CD3/CD28 beads (Invitrogen) at a bead-to-cell ratio of 1:1 and harvested after 24 hours. Neutrophils (1.5 × 10⁶/ml) were stimulated for 6 hours with 100 ng/ml LPS (E.O55.B5, Sigma-Aldrich).
RNA extraction and cDNA synthesis
Total RNA was isolated using the RNAqueous Kit (Ambion) followed by DNase treatment (TurboDNase, Ambion) according to the manufacturer’s instructions. Total blood leukocyte RNA was extracted from 10 ml whole blood by use of the LeukoLOCK system (Ambion) following the suggested protocol. RNA quan-tity and purity were measured with a NanoDrop 2000 spectrophotometer (Thermo Scientific), and only sam-ples with A260/A280 ratios between 1.80 and 2.00 were analyzed further. The integrity of RNA samples was confirmed by electrophoresis on a 1% agarose gel. First-strand cDNA was synthesized from equal amounts of RNA (1000 ng) using Superscript III reverse transcrip-tase (Invitrogen) and random hexamers and oligo(dT) primers as described [17].
Quantitative real-time PCR
17 commonly used reference genes were selected as candidate genes (Table 1). Real-time PCR was per-formed in duplicate on a LightCycler®480 instrument (Roche Diagnostics) using equal amounts (10 ng) of reverse transcribed total RNA and pre-validated probe-based RealTime ready® assays (Roche Diagnostics; see Additional file 1 Table S1 for Assay ID and amplicon location). Interleukin-2 (IL-2) and factor inhibiting hypoxia inducible factor (FIH) were chosen as exemp-lary target genes, using the following primers and Uni-versal ProbeLibrary (UPL) probes (Roche Diagnostics): IL-2: 5’AAGTTTTACATGCCCAAGAAGG 3’(forward primer), 5’ AAGTGAAAGTTTTTGCTTTGAGCTA 3’ (reverse primer), UPL probe #65; FIH: 5’ ACCCT GTTCATCACCCATGT 3’(forward primer), 5’TCTCG TAGTCGGGATTGTCA 3’(reverse primer), UPL probe #21. With the exception of 18S, all assays were designed to span at least one intron. Negative controls without the addition of cDNA were included to verify the absence of contamination. To avoid inter-run variation, the same gene was tested in the same run on different samples [6]. The cycling conditions comprised an inital denaturation phase at 95°C for 5 min, followed by 45 amplification cycles at 95°C for 10 s, 60°C for 30 s and 72°C for 15 s. Quantification cycle (Cq) values were cal-culated employing the “second derivative maximum” method as computed by the LightCycler software. Amplification efficiencies were determined for all qPCR assays by calculating calibration curves from 5- to 10-fold serial dilutions from pooled cDNA using the equa-tion E = 10[-1/slope]. Efficiencies ranged from 89.2% (ALAS) to 107.5% (ACTB) with r2 > 1.98 (see Table S1 forEand r2 values for each assay).
Statistical data analysis
(M) by calculating the average pairwise variation of each control gene from all the other control gene candidates. In addition, it performs a ranking of the candidate genes by stepwise exclusion of the worst scoring gene and repeated recalculation of the average M value. Unlike geNorm and BestKeeper, NormFinder employs a model-based approach, which does not only estimate the over-all variation of the candidate genes but also the variation between sample subgroups. All analyses were done cor-recting for different amplification efficiencies. Cqvalues were transformed into relative quantities for data pro-cessing by geNorm and NormFinder using the compara-tive Cq method and E as base [18]. To assess the expression stability of candidate reference genes in paired samples of unstimulated and stimulated cells, and to evaluate the impact of different normalization strate-gies on target gene expression, relative expression ratios (R) were calculated for reference genes, combinations of reference genes and target genes using the equation R= EΔCq
whereEis the efficiency of the respective real-time PCR assay andΔCq = Cq(stimulated sample)-Cq(unsti-mulated control). These ratios or the geometric means, respectively, were used for calculation of normalized
relative expression ratios as described by Pfaffl et al. [19]. Differences in target gene expression were tested for statistical significance (p < 0.05) using paired t-test and Bonferroni correction to account for multiple comparisons.
Results
Raw Cq values are summarized in Additional File 2 Table S2. Candidate reference genes were evaluated in a stepwise procedure: First, 17 commonly used reference genes were evaluated in unstimulated and stimulated T cells. Second, candidate genes stably expressed in T cells were further evaluated in unstimulated and stimulated neutrophils. Finally, candidate reference genes stably expressed in both T cells and neutrophils were analyzed in total blood leukocytes in order to identify universal leukocyte normalizers.
Reference gene evaluation in unstimulated and anti-CD3/ CD28 stimulated T cells
[image:3.595.57.539.100.413.2]The expression of 17 commonly used reference genes (Table 1) was measured by RT-qPCR in paired samples (n = 6) of unstimulated and anti-CD3/CD28 stimulated
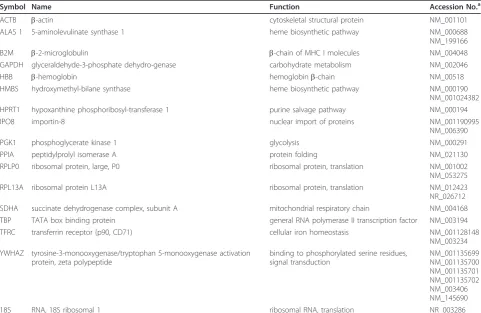
Table 1 Candidate reference genes evaluated in this study.
Symbol Name Function Accession No.a
ACTB b-actin cytoskeletal structural protein NM_001101
ALAS 1 5-aminolevulinate synthase 1 heme biosynthetic pathway NM_000688
NM_199166
B2M b-2-microglobulin b-chain of MHC I molecules NM_004048
GAPDH glyceraldehyde-3-phosphate dehydro-genase carbohydrate metabolism NM_002046
HBB b-hemoglobin hemoglobinb-chain NM_00518
HMBS hydroxymethyl-bilane synthase heme biosynthetic pathway NM_000190
NM_001024382
HPRT1 hypoxanthine phosphoribosyl-transferase 1 purine salvage pathway NM_000194
IPO8 importin-8 nuclear import of proteins NM_001190995
NM_006390
PGK1 phosphoglycerate kinase 1 glycolysis NM_000291
PPIA peptidylprolyl isomerase A protein folding NM_021130
RPLP0 ribosomal protein, large, P0 ribosomal protein, translation NM_001002
NM_053275
RPL13A ribosomal protein L13A ribosomal protein, translation NM_012423
NR_026712 SDHA succinate dehydrogenase complex, subunit A mitochondrial respiratory chain NM_004168
TBP TATA box binding protein general RNA polymerase II transcription factor NM_003194
TFRC transferrin receptor (p90, CD71) cellular iron homeostasis NM_001128148
NM_003234 YWHAZ tyrosine-3-monooxygenase/tryptophan 5-monooxygenase activation
protein, zeta polypeptide
binding to phosphorylated serine residues, signal transduction
NM_001135699 NM_001135700 NM_001135701 NM_001135702 NM_003406 NM_145690
18S RNA, 18S ribosomal 1 ribosomal RNA, translation NR_003286
a
T cells. Attention was paid to selecting candidate genes whose proteins belong to different functional classes to reduce the risk of coregulation. Particularly for valid NormFinder analysis, it is important that the candidates are chosen from a set of genes with no prior expectation of expression differences between subgroups [4]. Genes that differed significantly in their Cq values between unstimulated and stimulated T cells (paired t test, p < 0.05;HPRT1, HMBS, PGK1, PPIA, ACTB,RPLP0, B2M, ALAS,TFRC,YWHAZ), and thus had a high chance of being differentially regulated upon stimulation, were therefore excluded from further analysis (Figure 1A), leaving a set of seven candidate genes (18S, HBB, IPO8, RPL13A, SDHA, TBP, GAPDH). The observed Cqvalues were distributed over a wide range, including highly expressed (18S, Cq± SD, 10.4 ± 0.6) as well as far less transcribed genes (HBB, 29.0 ± 0.9), which violated the assumption of equal variances as a prerequisite for valid
Pearson correlation analysis [5]. We therefore restricted BestKeeper analysis to Cq variation analysis. RPL13A, TBP and IPO8 showed the lowest standard deviations (Table 2) and were thus considered the most stable reference genes according to BestKeeper. In good agree-ment, they were also listed among the three or four most stable genes by NormFinder and geNorm, respec-tively (see Table 3), whereas GAPDH andHBB were consistently ranked the least stable candidates by all three programs. The stability values of the geNorm (individual M values for each gene) and NormFinder analyses are given in Table 2.
Reference gene evaluation in unstimulated and LPS-stimulated neutrophils
It was one aim of our study to identify potential refer-ence genes that could be used to normalize gene expres-sion data in as many leukocyte subtypes as possible.
10 15 20 25 30 35
TBP
SDHA
18S
R
P
L13A ACTB B2M
GAPDH ALAS
HBB IPO8
HPRT1 HMBS PGK1 PPIA RPLP0 TFRC YWHAZ
p < 0.05 p > 0.05
p < 0.05 p > 0.05
18S
RPL1
3A
ACTB SDHA TBP
GAPDH
IPO8
C
q [image:4.595.59.539.325.673.2]A
B
Figure 1Individual Cqvalues of the candidate reference genes in untreated and stimulated T cells and neutrophils. Shown are the
Therefore, when selecting potential reference genes for the cell culture model of unstimulated and LPS-treated neutrophils (n = 7 paired samples), we focused on the set of seven pre-selected genes that we had evluated in T cells, with one slight modification: instead of HBB, which had been consistently ranked last in T cells by all three analyzing programs (Table 3),ACTBwas included, as it is one of the most commonly used reference genes [6] and has previously been suggested for normalization of gene expression in untreated neutrophils [12].IPO8 expression differed significantly between unstimulated and stimulated neutrophils (paired t test, Figure 1B), andIPO8 was therefore excluded from further analysis, which was finally restricted to 18S, RPL13A, SDHA, TBP, GAPDHand ACTB. As compared to the results obtained in T cells, the ranking of the candidate genes in neutrophils differed slightly more between the three programs (Table 3). However, ACTB, TBPand SDHA were consistently ranked among the three (NormFinder) or four (geNorm, BestKeeper) most stable genes. The BestKeeper statistics and NormFinder and geNorm sta-bility values are given in Table 4.
[image:5.595.56.290.124.234.2]Reference gene evaluation in total blood leukocytes Given that neutrophils and T cells together represent more than 80% of peripheral blood leukocytes, genes that proved to be suitable for normalization of gene expression in T cells as well as neutrophils should be promising “universal normalizer” candidates in unse-lected leukocytes. To test this hypothesis, we assessed the expression stability of the pre-selected candidate genes (TBP,ACTB,SDHA,18S,RPL13A,HBB,GAPDH, IPO8) in n = 12 samples of untreated total blood leuko-cytes from healthy volunteers (Table 5). In good agree-ment with the results obtained separately for the leukocyte subtypes,SDHAandTBPwere ranked among the two or three best candidates by all three programs,
Table 3 Stability ranking of candidate reference genes in T cells, neutrophils and unselected blood leukocytes by NormFinder, geNorm and BestKeeper
T cells
Rank NormFinder geNorm BestKeeper
1 RPL13A RPL13A/IPO8 RPL13A
2 IPO8 TBP
3 TBP 18S IPO8
4 18S TBP SDHA
5 SDHA SDHA 18S
6 GAPDH GAPDH GAPDH
7 HBB HBB HBB
Neutrophils
Rank NormFinder geNorm BestKeeper
1 ACTB SDHA/RPL13A TBP
2 TBP 18S
3 SDHA TBP SDHA
4 GAPDH ACTB ACTB
5 18S GAPDH GAPDH
6 RPL13A 18S RPL13A
Total Blood Leukocytes
Rank NormFinder geNorm BestKeeper
1 SDHA SDHA/TBP 18S
2 TBP TBP
3 IPO8 18S SDHA
4 GAPDH RPL13A RPL13A
5 RPL13A IPO8 IPO8
6 18S GAPDH GAPDH/ACTB
7 ACTB ACTB
8 HBB HBB HBB
Ranking is based on the stability values (NormFinder), the average expression stability during stepwise exclusion of the least stable gene (geNorm), or SD ± Cq(BestKeeper). Rank 1 represents the most stable reference gene or
combination of reference genes. GeNorm analysis does not allow the ranking of the two most stable genes because its gene-stability measurements require the use of gene ratios.
Table 4 Results of BestKeeper, geNorm and NormFinder analyses in unstimulated and LPS-stimulated neutrophils
TBP SDHA 18S RPL13A GAPDH ACTB
GM [Cq]# 29.27 30.03 11.94 28.60 24.54 20.37 AM [Cq]
#
29.28 30.06 11.96 28.64 24.57 20.40 min [Cq]
#
28.47 28.54 10.96 26.12 22.20 18.21 max [Cq]
#
30.80 33.17 13.60 31.63 26.54 21.80 SD [± Cq]
#
0.56 0.87 0.60 1.19 1.07 0.92
CV [% Cq]# 1.90 2.90 5.05 4.14 4.35 4.53
M 0.810 0.879 0.969 0.968 0.935 0.800
S 0.170 0.204 0.229 0.230 0.218 0.155
Expression stability of potential reference genes was calculated for n = 7 paired samples of unstimulated and LPS-stimulated neutrophils. GM, geometric mean; AM, arithmetic mean; Cq, quantification cycle; SD,
standard deviation; CV, coefficient of variation;#
[image:5.595.56.292.349.682.2]BestKeeper statistics;M, stability value determined by geNorm;S, stability value determined by NormFinder; expression stability decreases with increasingMandSvalues.
Table 2 Results of BestKeeper, geNorm and NormFinder analyses in unstimulated and anti-CD3/CD28 stimulated T cells
TBP IPO8 SDHA RPL13A GAPDH HBB 18S
GM [Cq]# 26.99 28.29 24.62 19.31 24.05 29.00 10.44 AM [Cq]# 26.99 28.30 24.63 19.31 24.08 29.02 10.46 min [Cq]# 25.99 27.23 23.58 18.76 22.09 26.60 9.35 max [Cq]
#
27.91 29.36 25.76 20.25 25.52 30.24 11.22 SD [± Cq]
#
0.45 0.52 0.55 0.40 0.81 0.94 0.58 CV [% Cq]
#
1.68 1.82 2.22 2.07 3.35 3.25 5.53 M 0.941 0.873 1.035 0.793 1.203 1.508 0.920 S 0.168 0.142 0.204 0.083 0.252 0.384 0.169
Expression stability of potential reference genes was calculated for n = 6 paired samples of unstimulated and anti-CD3/CD28 activated T cells. GM, geometric mean; AM, arithmetic mean; Cq, quantification cycle; SD,
standard deviation; CV, coefficient of variation;#
[image:5.595.305.539.566.678.2]as opposed to HBB, ACTB and GAPDH, which had before turned out to be less stably expressed in T cells and/or neutrophils. Table 3 summarizes the ranking of the respective candidate genes in T cells, neutrophils and total blood leukocytes according to the three differ-ent analyzing tools.
Optimal number of reference genes
Normalization by using a normalization factor (NF) based on multiple reference genes rather than a single gene is likely to provide more robust and reliable results [6]. To assess the optimal number of reference genes, geNorm calculates the pairwise variations Vn/Vn+1 between two sequential NFs to determine the effect of adding the next stable reference gene to the NF. As shown in Figure 2, using more than two reference genes
[image:6.595.57.538.99.211.2]would not reduce variation in T cells. Similarly, normal-izing to two reference genes would be sufficient in total blood leukocytes showing very low variation values well below the arbitrary threshold of 0.15. In contrast, adding up to six reference genes led to further reduction in var-iation in neutrophils. We used NormFinder to corrobo-rate the results. NormFinder calculates stability values S for each candidate gene and the best combination of two genes based on intra- and intergroup variation. After the selection of suited genes based on the esti-mated intergroup expression variation, the intragroup variance estimates can be used to determine the number of reference genes to include into the NF. The optimal number is reached when addition of a further gene leads to a negligible reduction in the average of gene variance estimates [4]. In T cells using a NF including
Table 5 Results of BestKeeper, geNorm and NormFinder analyses in total blood leukocytes (n = 12)
TBP IPO8 SDHA RPL13A GAPDH HBB ACTB 18S
GM [Cq]# 28.45 29.33 27.84 20.39 23.23 17.55 20.34 11.17
AM [Cq]# 28.46 29.36 27.86 20.41 23.26 17.62 20.38 11.19
min [Cq]# 27.06 27.06 26.08 19.05 20.60 15.23 18.21 10.17
max [Cq]# 30.53 31.30 29.62 22.54 26.12 20.86 21.80 12.31
SD [± Cq]# 0.66 0.85 0.67 0.72 1.01 1.24 1.01 0.45
CV [% Cq] #
2.33 2.90 2.40 3.51 4.32 7.03 4.98 3.98
M 0.555 0.629 0.550 0.717 0.720 1.178 0.719 0.668
S 0.173 0.322 0.145 0.378 0.333 0.781 0.407 0.387
GM, geometric mean; AM, arithmetic mean; Cq, quantification cycle; SD, standard deviation; CV, coefficient of variation; #
BestKeeper statistics;M, stability value determined by geNorm;S, stability value determined by NormFinder; expression stability decreases with increasingMandSvalues.
[image:6.595.57.538.459.689.2]RPL13A and IPO8 led to a reduction in S (0.057 vs. 0.083) and the avarage of intragroup variance estimates (Vintra; 0.019 vs. 0.046) as compared to using RPL13A
alone. Addition of TBP to the NF did not further improve results (S = 0.120,Vintra = 0.055). In
neutro-phils the combination ofACTBandTBP(S= 0.061;V
in-tra = 0.019) performed better than ACTBalone (S =
0.155; Vintra= 0.099). A NF includingACTB,TBP and SDHA meant no improvement (S = 0.086; Vintra = 0.052). In the single group of total blood leukocytes inter- and intragroup variance estimates were not calcu-lated. Based on the S values, including multiple refer-ence genes into a NF was not superior to using SDHA alone (SDHA: 0.145;SDHA+TBP: 0.167).
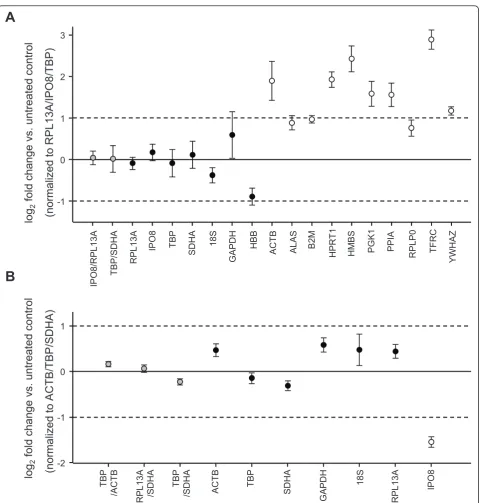
Regulation of reference gene expression in T cells and neutrophils upon stimulation
Gene expression regulation of unstable reference genes during stimulation will directly influence the estimation of target gene expression. None of the above mentioned programs uses an algorithm that specifically considers paired samples. We therefore validated our results by assessing the expression stability of single candidate reference genes or selected combinations in our experi-mental setting of paired samples of unstimulated and stimulated cells (Figure 3). Taking into account that most authors recommend the use of multiple reference genes to minimize variation [3-6], we normalized our data to the geometric mean of the three best-performing candidate genes according to the results of all three pro-grams (RPL13A/IPO8/TBPin T cells,ACTB/TBP/SDHA in neutrophils) as an attempt to use the presumably optimal normalization strategy. Overall, the results of the statistical analyses were supported, with the top-ranking genes in T cells (RPL13A, IPO8, TBP, 18S, SDHA) showing little regulation upon stimulation. In neutrophils slightly higher expression changes were seen. These, however, clearly remained below a 2-fold change in the top-ranking genes (ACTB, TBP, SDHA, RPL13A). The extent of expression variation tended to further decrease when analyzing the combined expres-sion of two reference genes. As expected, the candidate genes that had been ruled out from the beginning due to significant intergroup differences in Cq values dis-played the highest variation, with most of them being regulated more than 2-fold.
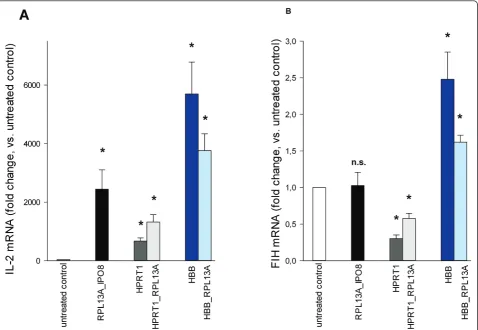
Influence of the normalization strategy on the estimated target gene expression
In order to evaluate the impact of different normaliza-tion strategies, we determined the relative change in the expression of two target genes,IL-2 and FIH, in anti-CD3/CD28 stimulated T cells (n = 4). We applied three different normalization approaches: (i) normalizing to
the geometric mean ofIPO8andRPL13A, the best com-bination of two genes according to NormFinder and geNorm; (ii) normalizing to HBB orHPRT1, both of which are candidate reference genes frequently used for normalization of RT-qPCR data and had performed poorly in our analyses; (iii) normalizing to the geometric mean of top ranking RPL13A and HBB or HPRT1. As expected,IL-2 mRNA levels strongly increased in acti-vated T cells, and this up-regulation was significant with all tested normalization strategies (Figure 4A), though considerably varying in its extent. Assuming that nor-malizing to IPO8 andRPL13A provided the most reli-able results, using HPRT1 led to a 3.6-fold underestimation and using HBB to a 2.3-fold overesti-mation of the expression change. While the tendency, i. e. up-regulation, of IL-2expression was observed irre-spectively of the normalization approach, this was not the case when analyzing FIH expression (Figure 4B): while no significant change in gene expression could be detected when using the recommended reference gene combination ofRPL13Aand IPO8, normalization strate-gies involving HPRT or HBBresulted in a significant down- or up-regulation, respectively. There is general consensus that normalizing to a single reference gene should be avoided [6]. In agreement, using the combina-tion of a stable and an unstable reference gene for nor-malization indeed reduced the distorting effect, however the differences in gene expression remained significant.
Discussion
Quantitative real-time PCR has become a standard method for gene expression analysis, allowing accurate quantification of mRNA levels over a wide dynamic range [2]. If handled improperly, however, the results can be misleading. One of the most critical points is the selection of appropriate reference genes to control for experimental error between samples [3,7]. In the current study, we evaluated, to our knowledge for the first time, the expression stability of common reference genes separately in two widely-used cell culture models of sti-mulated leukocyte subtypes: T cells activated by anti-CD3/CD28 beads, and LPS-stimulated neutrophils. A major finding of our study was that several conventional
[23]). These findings underscore the necessity of careful individual validation of reference genes for every leuko-cyte subtype and every experimental condition.
BestKeeper, geNorm and NormFinder outputs pro-vided very similar stability rankings of the candidate
genes, especially in T cells. As the programs are based on different algorithms [4-6], the consensus between them increases the reliability of the results. In neutro-phils, there was some discrepancy in the ranking order: geNorm identified RPL13A as one of the two most
log
2
fold change
vs. untreated control
-1 0 1 2 3
TB
P
SDHA 18S
RPL13A ACT
B
GAPDH
T
BP/SDHA
IPO8
IPO8/RPL13A
HPRT
1
HBB ALAS B2M
HMBS PGK1 PPIA RPLP0 TF
R
C
YWHAZ
A
(normalized to RPL13A/IPO8/TBP)
-2 -1 0 1
B
TB
P
SDHA 18S
ACT
B
GAPDH
TB
P
/SDHA IPO8
TB
P
/ACT
B
R
PL13A
R
PL13A /SDHA
log
2
fold change
vs. untreated control
(normalized to ACTB/T
BP/SD
[image:8.595.59.541.84.588.2]HA)
stable genes, whereasRPL13Awas assigned the last rank by NormFinder and BestKeeper analyses. In contrast to NormFinder, the pairwise comparison approach applied by geNorm is sensitive to co-regulation and shows a tendency to top rank candidates with correlated expres-sion rather than minimal variation [4], which could be an explanation for differing results. In the present study, the combinations of the two most suitable genes pro-posed by geNorm (SDHA/RPL13A) and NormFinder (ACTB/TBP) showed a similarly low expression variation in paired samples of untreated and stimulated neutro-phils, suggesting the suitability of both normalization approaches. Consistent with the recently published MIQE (minimum information for publication of quanti-tative real-time PCR experiments) guidelines [1], these results support the use of a normalization strategy that is based on several stably expressed genes, not just a
[image:9.595.60.539.89.419.2]single gene, to reduce variation. The number of refer-ence genes used in a particular experiment will be a compromise between minimizing variability and consid-erations of practicability [4,6]. NormFinder and geNorm consistently suggested the use of two reference genes (RPL13A and IPO8) for normalizing gene expression data in unstimulated and activated T cells. In neutro-phils, results differed between geNorm and NormFinder with geNorm indicating the optimal number of refer-ence genes with six, whereas according to NormFinder the combination of ACTB andTBPwas sufficient. It is important to note that neither geNorm nor NormFinder claim absolutness of their results but recommend them as a guideline which has to be interpreted individually when selecting the number of reference genes to be used [4,6]. Based on the results in paired samples, and considering that NormFinder, unlike geNorm, takes Figure 4Influence of different normalization strategies on the estimated target gene expression. The relative change in mRNA expression ofIL-2(A) andFIH(B) in T cells activated by anti-CD3/CD28 microbeads was assessed by applying and comparing different
intergroup differences into account and is less suscepti-bel to co-regulation of genes, we recommend the use of at least two genes out of ACTB, TBP, SDHA and RPL13A for normalization in LPS-stimulated neutro-phils.18S, which is commonly used for normalization of qPCR data in various cell types [24], including leuko-cytes [25,26], belonged to the stably expressed candi-dates in T cells. Due to its high expression, though, it will likely be inappropriate for the expression normaliza-tion of most genes of interest, as similar abundances of target and reference gene are important to ensure that they are both subject to the same PCR kinetics [6].
We intended to identify potential“universal leukocyte normalizers” (suitable for as many leukocyte subtypes as possible). Therefore, we limited the reference genes eval-uated in neutrophils to those candidates that had per-formed well in T cells. As a consequence of this sequential procedure, it cannot be excluded that a sub-set of reference genes not tested in our study would be suitable for normalizing gene expression in neutrophils. Studying gene expression in total blood leukocytes, thereby circumventing the time-consuming purification of single leukocyte subtypes, appears as an attractive approach in the search for diagnostic or therapeutic tar-gets in immune-mediated disease [9], although one has to be aware of its inherent limitations: changes in expression levels may not only be due to regulation of transcriptional activity but also reflect relative changes in the abundance of single cell populations with con-stant expression levels. The bias introduced will be espe-cially pronounced if the control genes used for normalization show variable expression stabilities in dif-ferent leukocyte subtypes. The expression stability of potential reference genes should therefore ideally be assessed in the single cell types prior to using them in mixed-cell approaches. Our results identified the combi-nation of SDHAandTBPas a suitable normalizer in T cells as well as in neutrophils. In good agreement, a recent study recommends the use of SDHAas a refer-ence gene in LPS stimulated porcine T cells [27]. Furthermore,TBPhas recently been reported to be sta-bly expressed in LPS stimulated monocytes [11]. We therefore hypothesized that TBP and SDHA could be suitable“universal” reference genes in unselected leuko-cytes. In support of our results, SDHA and TBP were listed among the three most stable genes in total blood leukocytes by all three analyzing softwares. Although NormFinder analyses found the use of a single reference gene (SDHA) to be sufficient in total blood leukocytes, we recommend as a general rule the use of at least two reference genes, and thus normalization to SDHA and TBP, as suggested by geNorm.
Whether a chosen normalization strategy is considered suitable or not in a given experimental setting also
depends on the extent and required resolution of expression differences. When analyzing the expression ofIL-2, a target gene that undergoes a strong upregula-tion in activated T cells, even the use of considerably instable reference genes correctly indicated an increase in IL-2 transcripts, which may be sufficient if only an on-/off response is to be detected. Usually, however, the investigated regulatory effect is much smaller, and esti-mating the exact expression change is important. In this case, the use of inappropriate reference genes leads to unreliable results and may even produce artificial changes, as is demonstrated by the comparison of differ-ent normalization approaches for the expression ofFIH, a key component of the cellular oxygen-sensing machin-ery that controls the activity of the transcriptional regu-lator HIF-1a[28], but is not known to be regulated in T cells activated by anti-CD3/CD28 beads under nor-moxic conditions. Of note, adding a stable reference gene for normalization did considerably compensate for the distorting effect of using a single unstable reference gene, thus supporting the use of more than one refer-ence gene [6]. However, even when combined with the most stable gene, using an unstably expressed gene led to erronousFIHexpression results; a careful selection of all the reference genes used for normalization is there-fore required.
Conclusions
Our study clearly demonstrates the need to carefully select appropriate reference genes for normalization of gene expression data obtained by RT-qPCR. We recom-mend the use of two genes out ofRPL13A, IPO8, TBP and SDHAand at least two genes out of ACTB, TBP,
SDHA and RPL13A as RT-qPCR control genes in T
cells and neutrophils, respectively. Furthermore, SDHA and TBP were shown to be suitable gene expression normalizers in unselected leukocytes.
Availability of supporting data
The data sets supporting the results of this article are included within the article and its additional files.
Additional material
Additional file 1: Table S1-Real-time PCR assay characteristics. This table summarizes the characteristics of the qPCR assays used in this study, including assay ID, amplicon start and end point, amplification efficiency E and r2.
Additional file 2: Table S2-Cqvalues of candidate reference genes.
Single Cqvalues of all candidate reference genes evaluated in this study in T cells, neutrophils and total blood leukocytes are listed.
Acknowledgements
Author details
1Department of Anesthesiology and Intensive Care Medicine, Clinical Faculty
Mannheim, University of Heidelberg, Germany.2Department of Anesthesiology, Ludwig-Maximilians-University Munich, Germany.
Authors’contributions
CL designed and performed the experiments, analyzed the data, performed the statistical analysis and wrote the paper. JH and EL participtated in performing experiments and discussing results. SK concieved of the study, participated in its design and helped to draft the manuscript. All authors read and approved the final manuscript.
Competing interests
The authors declare that they have no competing interests.
Received: 2 August 2011 Accepted: 20 October 2011 Published: 20 October 2011
References
1. Bustin SA, Benes V, Garson JA, Hellemans J, Huggett J, Kubista M, Mueller R, Nolan T, Pfaffl MW, Shipley GL,et al:The MIQE guidelines: minimum information for publication of quantitative real-time PCR experiments.
Clin Chem2009,55(4):611-622.
2. Bustin SA, Benes V, Nolan T, Pfaffl MW:Quantitative real-time RT-PCR–a
perspective.J Mol Endocrinol2005,34(3):597-601.
3. Thellin O, ElMoualij B, Heinen E, Zorzi W:A decade of improvements in quantification of gene expression and internal standard selection.
Biotechnol Adv2009,27(4):323-333.
4. Andersen CL, Jensen JL, Orntoft TF:Normalization of real-time quantitative reverse transcription-PCR data: a model-based variance estimation approach to identify genes suited for normalization, applied
to bladder and colon cancer data sets.Cancer Res2004,64(15):5245-5250.
5. Pfaffl MW, Tichopad A, Prgomet C, Neuvians TP:Determination of stable housekeeping genes, differentially regulated target genes and sample
integrity: BestKeeper–Excel-based tool using pair-wise correlations.
Biotechnol Lett2004,26(6):509-515.
6. Vandesompele J, De Preter K, Pattyn F, Poppe B, Van Roy N, De Paepe A, Speleman F:Accurate normalization of real-time quantitative RT-PCR
data by geometric averaging of multiple internal control genes.Genome
Biol2002,3(7):RESEARCH0034.
7. Huggett J, Dheda K, Bustin S, Zumla A:Real-time RT-PCR normalisation;
strategies and considerations.Genes Immun2005,6(4):279-284.
8. Thellin O, Zorzi W, Lakaye B, De Borman B, Coumans B, Hennen G, Grisar T, Igout A, Heinen E:Housekeeping genes as internal standards: use and
limits.J Biotechnol1999,75(2-3):291-295.
9. Chaussabel D, Pascual V, Banchereau J:Assessing the human immune
system through blood transcriptomics.BMC Biol2010,8:84.
10. Maess MB, Sendelbach S, Lorkowski S:Selection of reliable reference
genes during THP-1 monocyte differentiation into macrophages.BMC
Mol Biol2010,11:90.
11. Piehler AP, Grimholt RM, Ovstebo R, Berg JP:Gene expression results in lipopolysaccharide-stimulated monocytes depend significantly on the
choice of reference genes.BMC Immunol2010,11:21.
12. Zhang X, Ding L, Sandford AJ:Selection of reference genes for gene
expression studies in human neutrophils by real-time PCR.BMC Mol Biol
2005,6(1):4.
13. Trickett A, Kwan YL:T cell stimulation and expansion using anti-CD3/
CD28 beads.J Immunol Methods2003,275(1-2):251-255.
14. Malcolm KC, Arndt PG, Manos EJ, Jones DA, Worthen GS:Microarray
analysis of lipopolysaccharide-treated human neutrophils.Am J Physiol
Lung Cell Mol Physiol2003,284(4):L663-670.
15. Tsukahara Y, Lian Z, Zhang X, Whitney C, Kluger Y, Tuck D, Yamaga S, Nakayama Y, Weissman SM, Newburger PE:Gene expression in human neutrophils during activation and priming by bacterial
lipopolysaccharide.J Cell Biochem2003,89(4):848-861.
16. Zhang X, Kluger Y, Nakayama Y, Poddar R, Whitney C, DeTora A, Weissman SM, Newburger PE:Gene expression in mature neutrophils:
early responses to inflammatory stimuli.J Leukoc Biol2004,75(2):358-372.
17. Kreth S, Ledderose C, Kaufmann I, Groeger G, Thiel M:Differential
expression of 5’-UTR splice variants of the adenosine A2A receptor gene
in human granulocytes: identification, characterization, and functional
impact on activation.FASEB J2008,22(9):3276-3286.
18. Livak KJ, Schmittgen TD:Analysis of relative gene expression data using
real-time quantitative PCR and the 2(-Delta Delta C(T)) Method.Methods
2001,25:(4):402-408.
19. Pfaffl MW:A new mathematical model for relative quantification in
real-time RT-PCR.Nucleic Acids Res2001,29(9):e45.
20. Kreth S, Heyn J, Grau S, Kretzschmar HA, Egensperger R, Kreth FW: Identification of valid endogenous control genes for determining gene
expression in human glioma.Neuro Oncol2010,12(6):570-579.
21. Pilbrow AP, Ellmers LJ, Black MA, Moravec CS, Sweet WE, Troughton RW, Richards AM, Frampton CM, Cameron VA:Genomic selection of reference
genes for real-time PCR in human myocardium.BMC Med Genomics2008,
1:64.
22. Watson S, Mercier S, Bye C, Wilkinson J, Cunningham AL, Harman AN: Determination of suitable housekeeping genes for normalisation of quantitative real time PCR analysis of cells infected with human
immunodeficiency virus and herpes viruses.Virol J2007,4:130.
23. Valceckiene V, Kontenyte R, Jakubauskas A, Griskevicius L:Selection of reference genes for quantitative polymerase chain reaction studies in
purified B cells from B cell chronic lymphocytic leukaemia patients.Br J
Haematol2010,151(3):232-238.
24. Goidin D, Mamessier A, Staquet MJ, Schmitt D, Berthier-Vergnes O: Ribosomal 18S RNA prevails over glyceraldehyde-3-phosphate dehydrogenase and beta-actin genes as internal standard for quantitative comparison of mRNA levels in invasive and noninvasive
human melanoma cell subpopulations.Anal Biochem2001,295(1):17-21.
25. Baines KJ, Simpson JL, Gibson PG:Innate immune responses are increased
in chronic obstructive pulmonary disease.PLoS One2011,6(3):e18426.
26. Ear T, Fortin CF, Simard FA, McDonald PP:Constitutive association of TGF-beta-activated kinase 1 with the IkappaB kinase complex in the nucleus and cytoplasm of human neutrophils and its impact on downstream
processes.J Immunol2010,184(7):3897-3906.
27. Facci MR, Auray G, Meurens F, Buchanan R, van Kessel J, Gerdts V:Stability of expression of reference genes in porcine peripheral blood
mononuclear and dendritic cells.Vet Immunol Immunopathol2011,
141(1-2):11-15.
28. Kaelin WG Jr, Ratcliffe PJ:Oxygen sensing by metazoans: the central role
of the HIF hydroxylase pathway.Mol Cell2008,30(4):393-402.
doi:10.1186/1756-0500-4-427
Cite this article as:Ledderoseet al.:Selection of reliable reference genes for quantitative real-time PCR in human T cells and neutrophils.
BMC Research Notes20114:427.
Submit your next manuscript to BioMed Central and take full advantage of:
• Convenient online submission
• Thorough peer review
• No space constraints or color figure charges
• Immediate publication on acceptance
• Inclusion in PubMed, CAS, Scopus and Google Scholar
• Research which is freely available for redistribution
![Figure 1 Individual Cindividual quantification cycle (C[black circles]) were tested for statistical significance (p < 0.05) by paired t-test or Wilcoxon signed rank test, if data were normally or notq values of the candidate reference genes in untreated an](https://thumb-us.123doks.com/thumbv2/123dok_us/8266653.279400/4.595.59.539.325.673/individual-cindividual-quantification-statistical-significance-wilcoxon-candidate-untreated.webp)