OPTIMISATION AND APPLICATION OF PNEUMATIC
MODULATION TECHNIQUES FOR COMPREHENSIVE
TWO-DIMENSIONAL GAS CHROMATOGRAPHY
by
Samuel Douglas Hewitt Poynter
BSc (Hons)
A thesis submitted in fulfilment of the
requirements for the degree of:
Doctor of Philosophy
I
Declaration of Originality
To the best of my knowledge, this thesis contains no material which has been accepted for the award of any other higher degree or graduate diploma in any other tertiary institution, and to the best of my knowledge, contains no material previously
published or written by another author, except where due reference is made.
II
Acknowledgements
I am very thankful to my parents and close friends for their continued and unwavering support throughout my project. They have been a constant source of morale, patience, inspiration and reassurance and have helped me through every step of the process.
I am grateful of the encouragement shown by my uncle, Mr. Alan Poynter, who has offered continual interest in my studies.
The skills that I have learnt from my supervisors will prove valuable for my future career. They provided me with the space and freedom I needed to pursue my goals.
III
List of publications arising from the research
program
1. P.Q. Tranchida, L. Mondello, S.D.H. Poynter and R.A. Shellie.
Comprehensive two-dimensional gas chromatography combined with mass
spectrometry. Chapter in: L. Mondello (ed.) 2011. Comprehensive Chromatography in Combination with Mass Spectrometry. John Wiley and Sons, Inc., Hoboken NJ. p. 171-242.
2. S.D.H. Poynter and R.A. Shellie. High-speed, low-pressure gas chromatography–mass spectrometry for essential oil analysis. J. Chromatogr. A 1200 (2008) 28-33.
3. P.D. Morrison, P.J. Marriott, S.D.H. Poynter, R.A. Shellie. Selection of columns for GC×GC analysis of essential oils. LC-GC Eur. 23 (2010) 76-80. 4. R.A. Shellie, S.D.H. Poynter, J. Li, J.L. Gathercole, S.P. Whittock, A.
Koutoulis. Varietal characterisation of hop (Humulus lupulus L.) by GC–MS analysis of hop cone extracts. J. Sep. Sci. 32 (2009) 3720-3725.
IV
Statement of Co-Authorship
The following people and institutions contributed to the publication of the work undertaken as part of this thesis:
P.Q. Tranchida, L. Mondello, S.D.H. Poynter and R.A. Shellie. Chapter in: L. Mondello (ed.) 2010. Comprehensive Chromatography in Combination with Mass Spectrometry. John Wiley and Sons, Inc., Hoboken NJ. p. 171-242.
P.Q. Tranchida (40%), L. Mondello (10%), S.D.H. Poynter (25%), R.A. Shellie (25%)
Details of the Authors roles:
L. Mondello proposed the work and edited the manuscript. P.Q. Tranchida, S.D.H Poynter and R.A. Shellie reviewed literature and prepared the manuscript.
S.D.H. Poynter and R.A. Shellie. J. Chromatogr. A 1200 (2008) 28-33.
S.D.H. Poynter (50%), R.A. Shellie (50%) Details of the Authors roles:
S.D.H. Poynter and R.A. Shellie prepared the manuscript and performed laboratory analysis.
P.D. Morrison, P.J. Marriott, S.D.H. Poynter, R.A. Shellie. LC-GC Eur. 23 (2010) 76-80
P.D. Morrison (33%), P.J. Marriott (1%), S.D.H. Poynter (33%), R.A. Shellie (33%) Details of the Authors roles:
V
R.A. Shellie, S.D.H. Poynter, J. Li, J.L. Gathercole, S.P. Whittock, A. Koutoulis.
J. Sep. Sci. 32 (2009) 3720-3725.
R.A. Shellie (50%), S.D.H. Poynter (20%), J. Li (3%), J.L. Gathercole (2%), S.P. Whittock (12.5%), A Koutoulis (12.5%)
Details of the Authors roles:
R.A. Shellie proposed the research, collected the samples, performed sample preparation and prepared the manuscript. S.D.H Poynter assisted with sample preparation, analysed and interpreted the samples and assisted with manuscript preparation. J. Li and J.L. Gathercole performed chemometric interpretation of collected data for publication1. S.P. Whittock contributed to research planning and sample collection. A. Koutoulis contributed to the research proposal and coordinated collaboration between all parties.
P. McA. Harvey, S.D.H. Poynter, R.A. Shellie. LC-GC Eur. 24 (2011) 548-555.
P. McA. Harvey (25%), S.D.H. Poynter (15%), R.A. Shellie (60%). Details of the Authors roles:
P. Mc.A. Harvey performed modelling and laboratory work. S.D.H. Poynter performed laboratory work. R.A. Shellie proposed the research, performed laboratory work and prepared the manuscript.
VI
We the undersigned agree with the above stated “proportion of work undertaken” for each of the above published (or submitted) peer-reviewed manuscripts contributing to this thesis.
Signed: __________________ ______________________
Robert Shellie Greg Dicinoski
Supervisor Head of School
School Of Chemistry School of Chemistry
University of Tasmania University of Tasmania
VII
Authority of Access
VIII
Abstract
Gas chromatography is the logical choice for the separation of volatile and semi-volatile mixtures and can provide exceptional peak capacity, particularly when used in a comprehensive two-dimensional configuration. Furthermore, coupling with a mass spectrometer provides a powerful tool for identification of components in complex mixtures. The key component in a comprehensive two-dimensional GC system is the modulation interface between the two separation dimensions, the primary purpose of which is to trap and release fractions of primary column effluent onto the secondary column whilst conserving the resolution of separated components from the first dimension throughout the two-dimensional separation.
This thesis explored the use of pneumatic modulation interfaces for comprehensive two-dimensional gas chromatography coupled to a quadrupole mass spectrometer. Little research had been conducted into the use of pneumatic modulation with mass spectrometric detection due to a conflict between the high carrier gas flow required for pneumatic modulation and the requirement for high vacuum in the mass analyser.
two-IX
dimensional separation approach. This stationary phase was only available in narrow-bore dimensions and was highly satisfactory for cryogenic modulation but the internal diameter was not appropriate for pneumatic modulation due to the high head pressure required for operation. Next, a long, narrow-bore column was used to evaluate the conditions at which optimum efficiency could be generated for a translatable method. Use of fundamental relationships revealed a simple technique for determining a suitable column length based on a desired head pressure which provides the best trade-off between speed and efficiency optimisation. To conclude these one-dimensional investigations, an application is presented. Metabolite extracts from hop (Humulus lupulus L.) were obtained and separated using a GC–MS approach. Simple statistical analysis techniques were performed to establish the suitability of the separation approach for generating sufficient information to allow varietal classification of the samples.
X
XI
List of Abbreviations
APC Auxiliary Pressure Controller
DC Direct Current
df Film Thickness
EO Essential Oil
EOF Efficiency Optimised Flow rate
EOV Efficiency Optimised linear Velocity
FID Flame Ionisation Detector
GC Gas Chromatography
GC×GC Comprehensive two-dimensional gas chromatography GC×MS Comprehensive gas chromatography mass spectrometry
GRAM Generalised Rank Annihilation Method
I Retention Index
i.d. Internal Diameter
L Length
LN2 Liquid Nitrogen
LOOCV Leave-One-Out Cross Validation
LRI Linear Retention Index
MR Modulation Ratio
MS Mass Spectrometry
N Efficiency (Number of plates)
Nmax,theor Nominal maximum theoretical efficiency
OFN Octafluoronaphthalene
PARAFAC Parallel Factor Analysis
XII
PLS Partial Least Squares
PFM Pulsed Flow Modulation
PM Modulation period
rf Radio Frequency
Rs Resolution
RTL Retention Time Locking
SOF Speed Optimised Flow rate
SOV Speed Optimised linear Velocity
SMB Supersonic Molecular Beam
TOF Time Of Flight
tM Void time
tR Retention time
̅ Average linear velocity of carrier gas
1
X Parameter concerning the first dimension, eg. 1df 2
X Parameter concerning the second dimension, eg. 2df
XIII
Table of Contents
DECLARATION OF ORIGINALITY ... I
ACKNOWLEDGEMENTS ... II
LIST OF PUBLICATIONS ARISING FROM THE RESEARCH PROGRAM ... III
STATEMENT OF CO-AUTHORSHIP ... IV
AUTHORITY OF ACCESS ... VII
ABSTRACT ... VIII
LIST OF ABBREVIATIONS ... XI
TABLE OF CONTENTS ... XIII
CHAPTER 1: INTRODUCTION ... 1
1.1 LITERATURE REVIEW ... 1
1.1.1GCGC–MS ... 1
1.1.2INSTRUMENT REQUIREMENTS FOR GCGC–MS ... 5
1.1.3QUADRUPOLE MS ... 11
1.1.4TIME-OF-FLIGHT MS ... 12
1.1.5DATA PROCESSING OF GCGC–TOFMSRESULTS ... 17
1.1.6METHOD TRANSLATION IN GCGC–MS ... 18
1.1.7GCMS ... 20
1.1.8MODULATION TECHNIQUES FOR GCGC ... 24
XIV
1.2.1THE EARLY YEARS ... 33
1.2.2GC×GC–MS LANDMARK YEAR:2003 ... 37
1.2.32004-2006 ... 40
1.2.42007-2009 ... 43
1.2.52010-2011 ... 44
1.3CONCLUDING REMARKS ... 49
1.4SCOPE OF THE THESIS ... 50
CHAPTER 2: EXPERIMENTAL ... 53
2.1STANDARDS ... 53
2.2INSTRUMENTATION ... 53
2.3STATIONARY PHASES ... 54
2.4MODULATION ... 54
2.5DATA ANALYSIS ... 56
2.5.1GC–MS ... 56
2.5.2GC×GC ... 56
CHAPTER 3: SELECTION OF COLUMNS FOR GC–MS AND GC×GC APPROACHES ... 58
3.1 HIGH SPEED, LOW PRESSURE GAS CHROMATOGRAPHY-MASS SPECTROMETRY FOR ESSENTIAL OIL ANALYSIS ... 58
3.1.1.INTRODUCTION ... 58
3.1.2EXPERIMENTAL ... 61
XV
3.1.4CONCLUDING REMARKS ... 79
3.2HIGH TEMPERATURE WAX COLUMN FOR GC×GC ANALYSIS OF ESSENTIAL OILS ... 81
3.2.1INTRODUCTION ... 81
3.2.2EXPERIMENTAL ... 83
3.2.3RESULTS AND DISCUSSION ... 85
3.2.4CONCLUDING REMARKS ... 91
3.3 INVESTIGATION OF HIGH EFFICIENCY, HIGH RESOLUTION COLUMNS FOR GC–MS APPROACHES ... 92
3.3.1INTRODUCTION ... 92
3.3.2EXPERIMENTAL ... 94
3.3.3RESULTS AND DISCUSSION ... 95
3.3.4CONCLUDING REMARKS... 112
3.4.VARIETAL CHARACTERISATION OF HOP FROM METABOLITE EXTRACTS... 113
3.4.1INTRODUCTION ... 113
3.4.3EXPERIMENTAL ... 115
3.4.4RESULTS AND DISCUSSION ... 118
3.4.5CONCLUDING REMARKS ... 134
3.5.SUMMARY ... 135
CHAPTER 4: DEVELOPMENT, APPLICATION AND COMPARISON OF GC×GC– MS / FID APPROACHES FOR THE ANALYSIS OF PLANT ESSENTIAL OIL AND METABOLITE SAMPLES ... 140
XVI
4.1.1INTRODUCTION ... 140
4.1.2EXPERIMENTAL ... 145
4.1.3RESULTS AND DISCUSSION ... 146
4.1.4CONCLUDING REMARKS ... 156
4.2.PREPARATION OF A PNEUMATIC-MODULATED GC×GC–QMS APPROACH ... 157
4.2.1INTRODUCTION ... 157
4.2.2EXPERIMENTAL PARAMETERS ... 158
4.2.3.MS SENSITIVITY TESTING ... 159
4.2.4.THEORETICAL CONSIDERATIONS AND GC×GC SYSTEM DEVELOPMENT ... 165
4.2.5RESULTS AND DISCUSSION ... 171
4.3ANALYSIS OF ESSENTIAL OIL SAMPLES WITH VALVE MODULATED GC×GC–MS/FID .. 172
4.3.1INTRODUCTION ... 174
4.3.2EXPERIMENTAL ... 177
4.3.3RESULTS AND DISCUSSION ... 177
4.3.4CONCLUDING REMARKS ... 189
4.4.SUMMARY ... 189
CHAPTER 5: CONCLUSIONS AND FURTHER RESEARCH ... 193
5.1SUMMARY ... 193
5.2FURTHER RESEARCH ... 201
REFERENCES ... R1
Chapter 1: Introduction
1.1 Literature ReviewThis literature review has been adapted from the following publication:
P.Q. Tranchida, L. Mondello, S.D.H. Poynter and R.A. Shellie. Comprehensive two-dimensional gas chromatography combined with mass spectrometry. Chapter in: L. Mondello (ed.) 2011. Comprehensive Chromatography in Combination with Mass Spectrometry. John Wiley and Sons, Inc., Hoboken NJ. p. 171-242.
1.1.1 GCGC–MS
two-Chapter 1
dimensional separation, although it is noteworthy that corresponding parts of the overlapping spectra can be very successfully apportioned to individual compounds by using MS deconvolution software, such as the freely available Automated Mass Spectral Deconvolution and Identification System (AMDIS) from NIST [2]. GCGC very clearly produces a two-dimensional separation with the potential for compounds to be chromatographically resolved in each of the first- and second-dimensions respectively. It is also possible to perform a two-dimensional separation with a GC–MS instrument. This experiment, known as GC×MS, relies on soft ionisation to produce a single ion for each compound and when this criterion is met, compounds are separated according to their mass/charge ratio in the mass analyser. If the entire sample is subjected to these two separation dimensions, then these separation dimensions fit the definition of being comprehensively coupled [3] and GCMS is denoted using the multiplex sign. This GCMS concept is discussed in more detail later in the chapter.
Figure 1.1. Comparison of two multidimensional approaches: GC×GC vs GC–MS (adapted from Phillips and Beens [1]). The GC×GC approach demonstrates a two-dimensional separation, whereas the GC–MS approach represents a two-two-dimensional analysis.
Sample Inlet
Column 1
Interface
Column 2
Detector
Sample Inlet
Column
Interface
Mass Analyzer
Detector
[image:20.595.182.457.74.464.2]Chapter 1
outside optimum separation parameters. Combined, these enhancements greatly assist qualitative analysis of complex samples. By utilising selected ion monitoring or by careful use of extracted ion chromatograms it is possible to reveal the presence or absence of key target compounds or compound classes. Married to the highly praised “structured chromatogram” that is typical of a well-designed GCGC separation, the combination of group patterns and MS information often provides undisputable confirmation of peak identity. Similarly, the technique is highly applicable to quantitative analysis via the enhancements available through the combination of three analytical dimensions. At the time of writing, implementation of this strategy has been limited in the literature [5-11], of which many approaches focus on a limited number of target components, generally less than twenty. The details of these applications are discussed in more detail toward the end of this chapter. This limited implementation may be due, in part, to slower development of data processing software in comparison to the analytical techniques, creating a perception of difficulty for analysts performing routine analyses. It is anticipated that simplified software solutions will become available in the near future.
1.1.2 Instrument requirements for GCGC–MS
In order to provide effective sampling of the first-dimension effluent, the second-dimension separation speed in GCGC has to be very fast. It is desirable to obtain 3-4 samples of each individual component for analysis on the second-dimension column to enable correct peak reconstruction in the two-second-dimensional chromatogram for accurate identification and/or quantification [12].
Chapter 1
related to the slow acquisition rate of the MS used in the experiments, the first approach for implementing the GCGC–MS system was realised by slowing the typical analysis speed of the first-dimension separation by a factor of approximately seven times, with concomitant reduction of second dimension throughput in the order of five times. The first reported GCGC–MS chromatogram depicting the separation of a marine diesel sample is shown in Figure 1.2. The separation was achieved using a 13 m 0.10 mm i.d. first-dimension column with a thick film (3.5 m) 100% dimethylpolysiloxane stationary phase coupled to a 2 m 0.10 mm 14% cyanopropyl methylpolysiloxane stationary phase column installed in a thermally modulated GCGC system.
The experimental difficulties that Frysinger and Gaines described clearly portray the importance of high-speed detectors for GCGC–MS. Notwithstanding the valuable illustration of GCGC–MS, the detection rate of 2.43 full-scan spectra/s meant that the nearly 1 s wide second-dimension peaks were severely under-sampled. In the example given here an average of only one full-scan mass spectrum was recorded for each second-dimension peak. Although the reconstructed two-dimensional separation space provides a representation of the GCGC separation there are insufficient data points recorded to faithfully portray the chromatographic result and permit measurement of important chromatographic metrics such as peak-area, height, width, asymmetry and resolution.
Chapter 1
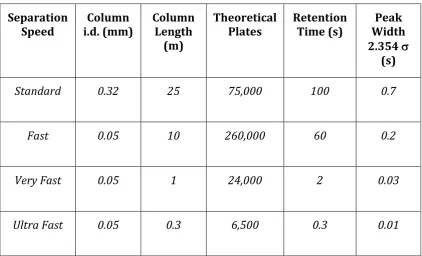
Table 1.1 Characteristic figures of merit for fast GC analysis. The second-dimension separation speed for GCGC–MS typically fits the very-fast category [13].
Separation
Speed i.d. (mm) Column Column Length (m)
Theoretical
Plates Retention Time (s) Width Peak 2.354
(s)
Standard 0.32 25 75,000 100 0.7
Fast 0.05 10 260,000 60 0.2
Very Fast 0.05 1 24,000 2 0.03
1.1.3 Quadrupole MS
Chapter 1
quadrupole duty cycle divided by the mass range. The absolute data acquisition rate will be less than this because the inter-scan delay must also be considered. By using a mass analyser with a maximum scan speed of 4,000 m/z/s and a mass scan range of 188 m/z, a data acquisition rate of approximately 20 scans/s is attainable [19]. Whilst the data acquisition rate was relatively slow compared to conventional GCGC applications with fast detection, giving only ~ 4 data points for each narrow second-dimension peak, the quality of the spectra for the separated components was reportedly very high [17, 19].
Interestingly, by speeding up the detection rate as descried above, the total GCGC–MS analysis times reported by Shellie and co-workers were only about 30% longer than the programmed solvent delay of the GCGC–MS system reported by Frysinger and Gaines using rather similar equipment. The GCGC–MS chromatogram of Pelargonium graveolens essential oil analyzed using a 30 m 0.25
mm i.d. non-polar (5% diphenyl 95% polydimethylsiloxane) first-dimension column coupled to a 0.5 m 0.32 mm i.d. polar (polyethylene glycol) second-dimension column is shown in Figure 1.4. The research performed in these early studies, combined with the continual speed improvements being made to contemporary quadrupole instruments themselves have provided impetus for further application of GCGC–MS using quadrupole MS instrumentation [5, 20-23]. The key results from these investigations are further expanded later in this chapter.
1.1.4 Time-of-flight MS
Chapter 1
transit time of the heaviest ion in the mass spectrum, so very fast data acquisition is possible. Consider an ion of 800 m/z with an applied acceleration potential of 2,000 V; the ion will take approximately 90 s to travel from the source to the detector in a 2 m flight tube [14]. In this example the instrument could acquire a full spectrum from 0 to 800 m/z every 90 s, which equates to a spectral acquisition rate in excess
of 11,000 spectra/s.
The first illustration of GCGC–TOFMS confirmed the suitability of this detection system for GCGC analysis [24]. In a preliminary investigation, van Deursen and co-workers performed a sub-1 s separation of a mixture of compounds spanning the volatility range C5-C8 in a one-dimensional approach to simulate a
second-dimension separation. A cryogenic focussing system was employed in the injection system based on previous research [25] and peak widths as narrow as 12 ms were reported. Using a very high scan rate of 500 Hz, good agreement was observed between sample and library spectra, suggesting that the chromatographic speed and acquisition speed were in agreement. The same authors followed this research with the first illustration of GC×GC–TOFMS to perform group-type identification of petroleum samples [24]. The column set consisted of a 10 m × 0.25 mm i.d. DB-1 column in the first dimension and a 0.7 m × 0.10 mm i.d. BPX-50 column in the second dimension. A Zoex thermal sweeper modulator was employed in conjunction with a 0.7 m × 0.10 mm i.d. SE-30 modulation capillary. The TOFMS was obtained from Leco and was operated at 50 Hz. This frequency was reportedly sufficient and avoided generating file sizes too large to be handled properly.
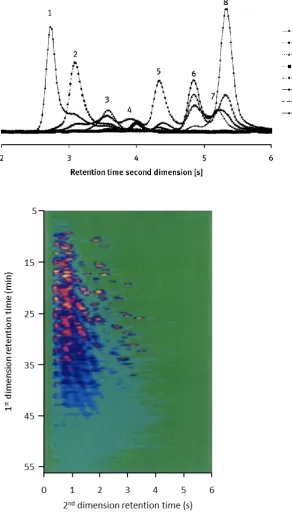
developed software. A second-dimension chromatogram from the GCGC–TOFMS separation of kerosene is also shown in Figure 1.5 illustrating the class separation of alkanes (1), mono- (2) and di-naphthenes (3,4) from mono-aromatics (5-8). Of particular interest here is the residual peak-overlap in the second-dimension column, because the synergistic relationship between chromatographic and mathematical separation is highlighted. Even the best GCGC separation will not separate the most complex sample; likewise the best de-convolution algorithm will fail if there is no chromatographic separation (with the caveat being that we are speaking of low-resolution MS). Fortunately in this example, the carrier gas velocity in the second-dimension column was close to optimum and the column efficiency was calculated to be approximately 4000 plates. This is significantly lower than the theoretical plate number of such a column, but it was thought that this resulted from insufficient zone focusing of the re-injected analyte plug on the second column delivered by the thermal sweeper modulator. Despite this deviation from the optimum efficiency, the response from eight partially resolved second-dimension peaks could still be successfully deconvolved from the separation, based on the highly reproducible spectra generated.
In 2001, Shellie and co-workers discussed the separation of an essential oil sample using GCGC–TOFMS [26]. They utilised cryogenic modulation to generate the two-dimensional separation and reported excellent applicability of the approach to their sample.
Chapter 1
Figure 1.5. An example of a second-dimension chromatogram from the analysis of kerosene using GC×GC–MS with the unique ion traces of each compound shown separately (top). Full GCGC–TOFMS chromatogram of kerosene (below).
1.1.5 Data Processing of GCGC–TOFMS Results
Following the first demonstration of a GCGC–TOFMS analysis, Dalluge and co-workers optimised and characterised the technique [27]. Temperature programming, column selection, modulation temperature, time and frequency and reported analytical performance data were discussed in detail. A key part of their findings incorporated the difficulties imposed by the quantity of data generated from separations and how these are handled. Early GCGC–TOFMS studies were plagued by troubles associated with large data files. A 73 min GCGC–TOFMS analysis was reported to have collected 2.1 × 10⁵ mass spectra (over 100 Mb of data), where a data acquisition rate of 50 spectra/s was used [24]. At the time of publication, no automated data handling was available and the screening of analysis results was laborious.
Chapter 1
technique. The group based the research on a 30-year-old algorithm used for the automatic range estimation in multiple pulse radar [31]. The algorithm was examined both theoretically and experimentally through a series of one-dimensional and two-dimensional separations to verify the predicted retention time values. The group showed that the use of the algorithm in conjunction with a slight increase in the modulation period of a two-dimensional separation allowed accurate determination of the second-dimension retention time. In one extreme example, the retention time of a compound undergoing six wrap-around cycles could be accurately determined by repeating the injection with a 14% increase in modulation time.
Hoggard and co-workers have investigated an automated method for applying parallel factor analysis (PARAFAC) to complete GCGC–TOFMS chromatograms for peak assignment and resolution [32]. The use of chemometrics techniques in comprehensive multidimensional GC is covered later in this chapter, but in brief, the group could correctly identify and assign both fully and partially resolved peaks without resorting to a labour-intensive manual approach. This greatly reduces the time required for comprehensive analysis and processing the large data files and is a step towards routine application of the technique.
1.1.6 Method translation in GCGC–MS
detection. The key unit for method translation is the void time and effective translation can be achieved by scaling the temperature program to this value. Naturally, there are a number of essential criteria that must be fulfilled, the mathematical underpinnings of which are discussed at length in the literature [33-36]. To briefly summarise, translatable methods must have the same stationary phase coating and phase ratio, the column cannot be overloaded and the inlet and outlet pressure of the column cannot change during the run [33]. It is the final point of this summary which is of most interest in the current study. To generate a pressure gradient through the column that does not change with time (and therefore temperature, for temperature programmed separations), it is imperative that constant pressure mode be used for the separation. It is for this reason that constant pressure mode has been predominantly adopted for separations performed in this thesis.
Chapter 1
at the interface between the first and second-dimension columns and can make it more difficult to retention-time-lock GCGC chromatograms. This challenge is exacerbated when dissimilar carrier gases are used to perform the GCGC–FID and GCGC–MS separations and retention time locking requires careful adjustment of the pressure drop across each section of a GCGC coupled column set [37]. In practice this can be achieved by using a tee-union at the end of the second-dimension column and provide electronic pressure control of BOTH the inlet and outlet of the GCGC column set. Under this arrangement it is possible to obtain near-matching retention in GCGC–FID and GCGC–MS [37].
1.1.7 GCMS
The use of soft ionisation allows a two-dimensional GC×MS separation without recourse to specialised modulation instrumentation. Hard ionisation techniques frequently generate multiple ion fragments for each analyte. In the case of similar members of a compound class, the fragmentation pattern may be conserved between analytes, providing little, if any, separation information from the MS for such compounds. In contrast, soft ionisation techniques produce fewer fragments for each compound reaching the detector; in many cases only a molecular ion is generated. The potential for the fragmentation pattern to be retained between members of a compound class is greatly reduced. This is reflected as a comparable separation step to a non-polar second-dimension column in a comprehensive two-dimensional system, as the higher mass analytes in a complex mixture generally have lower boiling points [38].
and selective ionisation methods for gaseous compounds are: i) Chemical Ionisation, where the analyte molecules are ionised by ion-molecule chemical reactions, ii) Field Ionisation, wherein very high electric fields in close proximity of an emitter needle ionises gas phase molecules, and iii) Photo-Ionisation, where ionisation is achieved by means of absorption of ultraviolet photons. Zimmermann and co-workers recently reviewed the use of photo-ionisation mass spectrometry as a detection method for one-dimensional and comprehensive two-dimensional gas chromatography [39].
Wang and co-workers presented the first example of this comprehensively-coupled approach in 2005 [40] based on the groundwork provided by coupling of GC and soft ionisation MS in 2002 [41]. Wang utilised a TOFMS equipped with field ionisation coupled to a GC for the separation of a diesel sample. A modulation device is not required in this technique as there is only a single chromatographic separation step.
In simplified terms, the use of a soft ionisation MS generates a separation of molecules based on their size. Should a non-polar column be used for the GC dimension, which possesses selectivity for analyte boiling point, a strong correlation would be witnessed between the two dimensions due to the relationship between boiling point and molecule size. Such an approach would not be orthogonal, and the resultant chromatogram would show negligible information in the second dimension separation space.
Chapter 1
Figure 1.6. Experimental results from a GC–laser SPI-TOFMS coupling. (A) Demonstration of the separation-similarity of a gas chromatogram using a non-polar column (TIC of Diesel GC–MS chromatogram with EI ionisation, top) and a soft ionisation mass spectrum (SPI mass spectrum of diesel obtained by summing up all mass spectra of a GC–SPI–MS run, bottom): the homologue row of the alkenes is indicated by asterisks, respectively. (B) Two-dimensional retention time/molecular mass-representation of a GC–SPI–TOF–MS run. The course of the n-alkanes is indicated by the continuous line. By transformation of the representation according to the indicated arrows one obtain the GC×GC–plot shown in (C). (C) Comprehensive two-dimensional GC×MS representation generated from (B) by “linearisation” of the
A transformation is required to plot the data in a manner which resembles a typical GCGC separation obtained using an apolar-polar column set. The conversion of GCMS data in this way allows the visualisation of the compound classes in a manner that is not possible with conventional GC–MS techniques, permitting a simpler fingerprinting method for class identification to essentially the same degree as a GCGC separation. The procedure follows the illustration presented in Figure 1.6. In essence, the retention time axis is transformed in a way that the n-alkanes present in the sample are aligned parallel to the x-axis. By plotting the results according to time vs. mass, compound class separation information can be revealed.
Wang reported that the separation of individual compound groups within classes is easier using GCMS than GCGC due to the similarity in relative polarity provided by the latter technique. Furthermore, because only the molecular ions of many compounds are collected, individual chromatograms of sulfur or nitrogen containing compounds can be extracted in a similar manner to the single ion monitoring mode used in GC–MS. This feature would require the use of an element specific detector in conventional GCGC–MS as established by Ochiai and colleagues in 2007 [23].
Chapter 1
carbowax column in the first dimension for separation according to “polarity”, a 50% phenyl 50% methyl polysiloxane second-dimension column for separation according to “polarisability” and soft-ionisation MS mimicking a “volatility” separation [42]. The primary limitation observed with the technique was the frequency of the ionisation laser, which limited spectral acquisition to 5 Hz and was not sufficient to generate five data points per peak for the early eluting compounds. As such, optimisation of the technique was hampered and the chromatographic steps were operated outside the most desirable parameters but the feasibility of such an application was critically examined. It was proposed that the use of a vacuum UV photo-ionisation method would enable continuous data acquisition and eliminate the problems encountered in the published study.
While the publication of further applications of this technique have been limited in comparison to the abundance of traditional two-dimensional GC techniques, research is continuing especially in the area of novel applications for the technology [43].
1.1.8 Modulation techniques for GCGC
For a GC×GC separation to be differentiated from a coupled column separation, the information collected from the separation of the sample on the first-dimension column must be retained throughout the experiment [44]. This process is carried out by the modulation interface.
Figure 1.7. (A) Experimental setup of the gas chromatography SPI-oaTOF-MS instrument. SPI is performed in a separated ionisation chamber with 126 nm photons from the Ar filled EBEL VUV lamp. (B) Comprehensive two-dimensional GC×MS representation obtained from a gas chromatographic analysis of a diesel sample with EBEL VUV-lamp for SPI. (C) If GC×GC is combined with soft SPI-TOF-MS, a three-dimensional comprehensive separation can be realised. The figure depicts a section of a GC×GC×SPI-MS separation of a diesel sample using the EBEL VUV lamp technology (Ar, 126 nm) for SPI. The position of the n-alkanes is indicated.
Chapter 1
‘packets’ of first-dimension effluent either in a transfer line between the first- and second-dimensions or on the head of the second-dimension column. Reheating the transfer line by cessation of cryogen flow or movement of the modulator causes rapid remobilisation of trapped analytes onto the second-dimension column. At the time of writing, cryogenic modulators are commercially available from companies including Thermo Scientific, Zoex, Leco and Chromatography Concepts. No doubt this list will grow as the uptake of the technology increases.
The strength of thermal modulation is the inherent focussing of trapped analyte plugs within the modulator. This involves the concentration the effluent fraction from the first-dimension column prior to reinjection and allows the injection band width to be very low (typically under 60 ms) and band broadening on the second column to be minimised. These factors are highly beneficial for analysis of complex samples as the reduction of band broadening increases the potential resolution between components. Sensitivity may also be increased by a factor of 10-30 fold [45].
Chapter 1
spots generated by increased thermal mass around the electrical contacts were initially eliminated by the use of a hairdryer, and a subsequent modification to the way in which the contact was attached to the capillary generated even better results. Injection bands were in the order of 60 ms wide, with peak widths of 120 ms at half height. For reference, earlier methods [45, 54] reported peak widths of approximately 350 ms at half height. The robustness of the modulator was excellent, with an expected lifespan of up to 3 months if used for around 8 h per day.
With the current trend towards smaller, more economical instrumentation, traditional “total-loss” cryogenic modulators may not be appropriate for many applications in the modern laboratory. This has pushed the focus of hardware development towards consumable-free GC×GC systems, such as those presented by Panic [53]. Additionally, the use of pneumatic modulation devices has provided further avenues for research.
Bruckner and co-workers presented a paper in 1998 detailing the novel use of a 6-port nitrogen-actuated diaphragm valve to transfer 50 ms wide pulses of effluent from the first dimension to the second-dimension column [55]. The valve was operated twice per second and sampled approximately 10% of the column effluent. Seeley’s group presented a seminal publication in 2000 which further developed the idea of a multi-port diaphragm valve as a modulation device [56] based on a previous application in two-dimensional liquid chromatography [44]. He utilised all six ports of the valve (unlike Bruckner’s use of four ports) and incorporated a sample loop to collect column effluent prior to transferral to the second-dimension column. This allowed the first-dimension column sampling to increase to approximately 80%.
aspect of the technique. To effectively modulate the first-dimension effluent, the secondary column flow must be maintained at least 20 times higher than the primary flow. This requirement comes about because valve based modulation techniques are inherently lacking in the zone focussing effects witnessed with thermal modulation. Upon switching the valve from the ‘collect’ to the ‘inject’ position, the contents of the sample loop are transferred as a discrete package with a width of around 5% of the collection time. Seeley suggested that if moderate band broadening is assumed, the peak flux eluting from the second-dimension column is still greater than that of the first-dimension column as a result of the flow differential [56]. This high flow rate is not compatible with the vacuum systems of common mass spectrometers, suggesting the technique may be unsuitable for such an application.
A further limitation of this modulator is the temperature sensitivity of the valve which forces it to be located outside the oven and not be subjected to temperatures above 125 °C [56]. Sinha and co-workers presented the application of a valve-based modulator for GCGC–MS in 2003, using careful valve placement allowing the working temperature range of the instrument to be increased to 250 °C [58]. It was necessary to utilise a mere 10% of the primary column effluent for second-dimension analysis, which naturally had an adverse effect on the available sensitivity. Detection limits were still acceptable however. Diehl and Di Sanzo [59] also used an open split arrangement in their valve-based modulator.
Chapter 1
columns emanating from a tee union after the modulation device) and total transfer of primary column effluent to the secondary columns was observed. Further development of the device ensued [61], with the authors also introducing a less complex form of the device [62].
To circumvent the low carrier flux dictated by conventional mass spectrometers, Amirav and co-workers examined the performance capabilities of a unique kind of differential flow modulated GCGC–MS based on direct coupling with a supersonic molecular beam (SMB) interface in 2007 [63]. Unlike most GC– MS interfaces, SMB-MS requires a high helium flow (typically 90 mL/min) for proper operation [64]. Under this general interface configuration the coupling of GCGC with tandem mass spectrometry was later introduced with practical demonstration of the analysis of pesticides in vegetable matrices [65]. While the application of this technique was a resounding success, it was duly noted that it was primarily a target method, which is not suitable for all samples, and the technique was incompatible with library detection. In Figure 1.8, Amirav’s GCGC modulator is shown inside the oven of a Varian 3800 GC which is hyphenated with a Varian 1200-I triple quadrupole-based MS with SMB. Amirav called his technique ‘pulsed flow modulation’.
time of the second dimension was at least double that of a comparable thermally modulated GC×GC system, causing broader peaks and increased analysis time. A detector acquisition rate of 33.33 Hz was utilised and this provided sufficient for peak detection and qualitative identification. While this research clearly showed the potential of pulsed flow modulated GC×GC–qMS, the separations obtained could be described as satisfactory at best and certainly not possessing comparable efficiency or resolution of similar thermally modulated separations. Additionally, Harvey and co-workers have recently published a dynamic flow model which is capable of predicting carrier gas flow rates and pressure requirements for pulse flow modulated GC×GC [67]. Their research suggests improvements to current modulator design, including the use equal internal diameter tubing for modulator construction, which improves baseline stability and improved robustness and modulation period flexibility through appropriate selection of restrictors at both ends of the first-dimension column. A separation of Special Antarctic Blend diesel was presented using the optimised system at two different modulation periods exhibiting the flexibility available with restrictors in place.
Chapter 1
Figure 1.8. Pulsed flow modulation set-up for GC×GC–MS (and GC×GC–MS–MS) with supersonic molecular beams inside a Varian 3800 GC. The bottom schematic diagram shows the SMB interface and its fly-through ion source at the entrance to the 1200 triple quadrupole MS system.
remainder of this chapter covers applications of GC×GC–MS techniques in a chronological fashion.
1.2 Applications of GC×GC–MS
1.2.1 The early years
One of the first observations made about comprehensive two-dimensional chromatograms was the sheer quantity of resolved components. The nature of the separation space is naturally dictated by the column choices and operating parameters selected by the analytical chemist, hence relying solely upon an x,y
coordinate to identify a peak is often inaccurate and imprecise. Mondello compiled a review in 2008 and remarked that the coupling of mass spectrometry is an almost obliged choice to allow identification and structural elucidation of components and is the most powerful tool available at the current time for the separation of complex volatiles and semi-volatiles [68].
For this reason, it is unsurprising that the technique of GC×GC–MS has been thoroughly, if not completely, explored since its inception in 1999. A total of nine publications were released in the early years of the technique (1999-2002), before a veritable explosion of interest in the topic. Over sixty studies were published between 2002 and 2005 and interest has only increased in the five years preceding the current day, with a considerable amount of progress.
Chapter 1
Dalluge et al. [69] described the GC×GC–TOFMS analysis of cigarette smoke, a very complex sample and described the difficulties of data processing; an affliction that continues to hamper the mainstream use of the technique. To perform the study, the constituents of the smoke were adsorbed in a sample tube, re-concentrated onto a cold trap then thermally desorbed and injected onto the first dimension. A six second modulation time was used for focussing onto the second-dimension column. It would appear that a less than optimal column selection was made, as the relatively thick film selected for the first-dimension stationary phase caused elution temperatures to be excessive, which limited the application range due to the relatively low temperature stability of the polar column used in the second dimension. This led to the observation that independent temperature control over the two dimensions would prove useful.
A two-dimensional chromatogram from this study is shown in Figure 1.9. It is evident that the resolving power was insufficient for the sample. Mass spectral deconvolution proved particularly useful for this application and when used in conjunction with automated library matching, 7500 components were resolved of which 152 were successfully library matched with adequate accuracy. It is noteworthy that while this process was automated, the data processing took seven hours of computing time.
resolution was observed for the sample. It was also observed that an optimal modulation period existed. Too long a period and the first-dimension separation is not conserved; too short and the sensitivity and separation space is compromised. Towards the end of 2002, Shellie and Marriott performed an interesting study into the use of an enantioselective stationary phase in a GC×GC separation [15]. While the separation of volatile chiral flavour and fragrance compounds using multidimensional techniques was not new, the group sought to increase the optimum linear velocity of the carrier gas to allow a faster separation whilst maintaining efficiency. While the use of hydrogen as a carrier gas moves towards this goal, inducing sub-atmospheric pressure throughout the entirety of the second-dimension column may offer better results by increasing the diffusion coefficient and decreasing the retention time on the second column.
Chapter 3 is dedicated to the investigation of appropriate column choices for GC×GC separations. The use of a column under low pressure conditions was investigated in detail in this chapter. Furthermore, Shellie’s recommendation of a short length of 0.25 mm i.d. capillary column as a secondary column for a GC×GC– MS separation was followed in the research presented in Chapter 4 where setup and optimisation of a GC×GC system with pneumatic modulation and qMS detection is presented.
1.2.2 GC×GC–MS landmark year: 2003
A significant advance in the facilitation of the widespread use of GC×GC– MS was achieved in 2003 with the introduction of the Pegasus 4D instrument from LECO. This incorporated a dual stage quad-jet cryogenic modulator, independent temperature control for first- and second-dimension columns and a time of flight mass spectrometer. The software package was capable of fully automated data processing and instrument control. Dimandja’s group made use of this [71] and demonstrated the separation of a diesel sample. A concomitant decrease in sensitivity was also recorded and it was concluded that reducing the acquisition rate from 100 Hz to 50 Hz yielded a satisfactory separation.
Chapter 1
Figure 1.10. A separation achieved by Shellie et. al on a test mixture, containing chiral compounds. While wrap-around is evident, the low data acquisition rate (8.33 Hz) was a good partnership for the large bandwidth. The achievement of rapid second-dimension enantiomer separations was successful.
the TOFMS via a polar 3 m 180 µm second-dimension column. For the system to function, an external gas supply was necessary to drive the second dimension. At constant pressure, the flow rate dropped from approximately 7 mL/min to 3 mL/min during the course of the temperature programmed run.
It was interesting to note that the primary column effluent was not continuously sampled. Instead, the sample loop was filled for 0.25 s then flushed for 2.25 s, during which time the first-dimension column effluent was not sampled. This corresponded to 90% of the sample running to waste. At the first International Symposium on Multidimensional Gas Chromatography (March 2003, Volendam, The Netherlands), there was some debate as to whether this type of separation may constitute a true two-dimensional comprehensive separation. It was concluded that as long as a faithful representation of the primary separation is realised, the technique can be considered to be comprehensive [72]. The present results show that no loss of first-dimension sample information is incurred due to the high sampling frequency (2.5 s) and the technique fulfils the requirements of GC×GC.
Chapter 1
While the TOFMS is arguably the best suited to GC×GC separations, numerous authors produced some exceptional work during 2003 [17, 20, 74] highlighting the potential applications for quadrupole hardware driven at or close to the maximum duty cycle of the apparatus. The Agilent 5973 mass selective detector was selected for investigation as it allowed scanning at around 20 Hz with a narrow mass scan range. Quantitative analysis still proved difficult as under-sampling of components prevailed, although qualitative analysis was more than satisfactory.
1.2.3 2004-2006
The period between 2004 and 2006 saw the technique of GC×GC–MS take hold in both industrial and research laboratories. Twenty papers were published in 2004, covering both quadrupole and TOF detection. Ryan et al. [21] compared and contrasted the methodologies using solid phase microextracted coffee samples. An unorthodox polar-apolar column combination was used following successful results obtained by Mondello’s group [75]. As with the preceding studies (and several subsequent ones), it was shown that while the quadrupole instrument was adequate for identification of components, quantification was unsatisfactory. Debonneville and Chaintreau [5] attempted quantification using a quadrupole MS operated in selected ion monitoring (SIM) mode at an acquisition rate of approximately 30 Hz. This was satisfactory for analysis of known analytes possessing large (> 200 ms) peak widths, but unsuitable for other components.
Adahchour et al. [22] reported an investigation on the principles, usefulness, and potential of rapid-scanning qMS instrumentation in GC×GC. The performance of a new generation qMS system (Shimadzu QP2010), which provided acquisition speed approaching GC×GC requirements, was studied for qualitative and quantitative purposes. The detector could reach the ultimate (GC×GC) goal of 50 spectra per second, albeit at a restricted mass range (95 amu). To avoid peak skewing, it was determined that the instrument should be operated such that acquisition rate approaches this maximum value. To determine the point where useful data may be collected, the peak area precision was examined at several acquisition rates between 20 and 50 Hz. The two highest acquisition rates were generated by restricting the MS scan ranges to 195 and 100 amu, respectively. Reliable quantification was obtained for scan rates above 33 Hz, where at least 7 data points per peak were recorded. Should the mass range required to reach this speed be insufficient, a smaller rate was necessary although this invoked difficulty in peak reconstruction. Should peak width drop below 200 ms, the use of the maximum acquisition rate of the instrument was necessitated but for general operation, 30 Hz was the most suitable.
Chapter 1
complex mixture by generating a normalised function of the retention time which can be cross referenced in the spectral library [77].
Shellie and co-workers [37] sought to match the output of GC×GC–FID and GC×GC–TOFMS experiments to allow direct comparison of retention times for identification and quantification purposes. This work followed on from the method translation theory of Blumberg and Klee [33] for adaption to the comprehensive two-dimensional separation. A first-dimension 30 m 0.25 mm i.d. column and a second-dimension 0.5 m 0.10 mm i.d. column with both atmospheric and vacuum outlet were used in this study. An equivalent 0.25 mm i.d. capillary can be derived for the second-dimension column for a nominal outlet pressure, allowing the correct column and injector split flow values to be determined. Through careful manipulation of outlet pressures and determination of average linear velocity and viscosity of carrier gas flows, a difference in absolute retention time for a mixture of 18 compounds of 3.7 s in the first dimension and 42 msec in the second dimension was calculated. The group made mention that to date, typical flow conditions for GC×GC experiments are almost always non-optimal [78]. This theme has continued throughout the research presented in this thesis and is discussed in more detail in Chapter 3 and 4.
1.2.4 2007-2009
Throughout this period the use of TOF detection for comprehensive analysis became more popular despite the occasional flirtation with current generation qMS technology. Research branched out into the investigation of TOF devices which traded resolution for high data acquisition rates, and those with high mass accuracy and concomitantly reduced collection frequency [27]. A veritable explosion of work was carried out in this period, with 24 papers published in 2007; 38 in 2008 and 27 in 2009. While discussion of all these publications would be of interest, two stood out as being an excellent representation of the direction in which GC×GC research is travelling.
Ochiai and co-workers [23] employed the GC×GC–TOFMS for the investigation of nanoparticulate atmospheric pollutants and were able to determine the presence of 9H-fluorene-9-one (-0.0007 Da mass error: 4 mg/L), 1H-phenalene-1-one (0.0046 Da mass error: 26 mg/L), 9(10H)-anthracenone (0.0005 Da mass error: 3 mg/L), naphto(1,2-c)furan-1,3-dione (0.0031 Da mass error: 16 mg/L), 7H-benz(de)anthracene-7-one (0.0016 Da mass error: 7 mg/L), and 11H-benzo(a)fluorine-11-one (0.0039 Da mass error: 17 mg/L) in a sample acquired from near a busy road.
Chapter 1
1.2.5 2010-2011
GC×GC continued to be an area of interest in 2010 and the current year. A variety of GC×GC–MS methods for the analysis of petrochemicals were reported [85-90] and investigation of environmental contaminants, including organohalogens [91-95] and pharmaceutical/personal care products (PPCPs) [96, 97] were also widely discussed. The use of comprehensive analysis techniques for metabolite analysis and biological ‘fingerprinting’ techniques proved popular, with many reports in the literature [98-106], some of which included quantitation.
Tranchida and co-workers performed an interesting investigation into the use of a high efficiency 0.05 mm i.d. column in the second dimension at optimum flow rate [107]. A quadrupole mass spectrometer was used as a follow-up to previous FID experiments [108]. The rationale behind this investigation considered the desirability for wide first-dimension peaks and a concomitant compensation of a fast, high resolution separation in the second dimension. Considering around 10,000 theoretical plates can be obtained from a 1 m 0.10 mm i.d. second-dimension column, it stands to reason that greater efficiency can be afforded by a narrower column if operated close to optimum. The authors noted that using this column in a conventional instrument configuration, only a limited range of the available peak capacity could be exploited and very few peaks could be successfully identified, leading to the suggestion that this avenue was not suitable for separation of complex mixtures. However, when used in an optimised split flow arrangement with independent temperature control over the two separation dimensions, good performance was available.
20,000 amu/s scan speed, corresponding to a frequency of 50 Hz over the range 40-330 m/z for comprehensive two-dimensional separations. The result was particularly pleasing with highly satisfactory repeatability, accuracy, linearity and sensitivity observed for the separation of a perfume sample. The authors reported that the instrument and method were suitable for routine analysis of perfume allergens. This observation overturned the previous paradigm that qMS is only suitable for identification purposes and cannot yield accurate peak reconstruction.
Vallejo and co-workers also investigated a comprehensive two-dimensional system with a valve-based modulator, splitting effluent via a tee union to FID and qMS detectors [110]. A similar method to this research was investigated in Chapter 5
of this thesis. Vallejo’s method involved the identification of components present in octyl- and nonylphenol isomer test mixtures using mass spectral data, and quantification of analytes of interest using the FID channel. A factorial experimental design was implemented to optimise the separation, based primarily on peak symmetry across the separation space. A HP5 MS column (30 m × 0.25 mm i.d.) was used in the first dimension, coupled to a DB-17 MS column (5 m × 0.25 mm i.d.) in the second dimension. The splitter was installed after the second dimension column, directing flow to the FID via a 0.7 m × 0.32 mm i.d. transfer line while the MS flow passed through a 0.45 m × 0.1 mm i.d. transfer line. Under these conditions, the group concluded that optimum separation was obtained using 1 mL/min in the first dimension and 17.75 mL/min in the second, with a 1.5 s modulation period and 0.12 s modulator flush time.
Chapter 1
compromise in sensitivity inherent by not analysing the majority of the sample, the carrier gas linear velocities were operated under optimised conditions in both dimensions. This outcome is difficult to achieve, as under normal circumstances with a ‘traditional’ (long 0.25 mm first-dimension/short 0.10 mm second-dimension) column set, the second dimension flow rate is usually pushed above optimum. The group sought to acquire at least 10 spectra/peak, enabling the potential for quantitation based on the calculations of Adachour [112]. This outcome was successfully obtained using a 25 Hz data acquisition rate and a mass range of 40-360
m/z.
a resistively heated transfer line coupled to a high-speed diaphragm valve, the peak capacity production rose from 40 peaks/min to some 120 peaks/min.
Utilising hardware contemporaneous to that discussed in this thesis, Harvey and Shellie investigated peak shapes evolving from non-focussing modulation devices. Considering that diffusion of analyte packets occurs within the sample loop of a pulsed-flow modulator, in addition to the partial preservation of the first-dimension concentration profile of the analyte throughout the second-first-dimension separation, a model establishing these influences on the second-dimension peak shape could be created. Validation of the model was successful and appropriate parameters for flow ratio between the two dimensions were presented.
Of particular interest to the current study, van Geem and co-workers [116] presented a novel system setup allowing the online qualitative and quantitative analysis of complex hydrocarbon mixtures by incorporating a two-way valve to allow switching between FID and TOFMS detection without venting of the instrument. The group used a dual jet cryogenic modulator in conjunction with a 50 m 0.25 mm i.d. non-polar first-dimension column and two 2 m 0.15 mm i.d. polar second-dimension columns feeding each detector. While the aim of the project was based on an industrial application, the ‘online’ coupling of the two systems was a novel approach and certainly worthy of further investigation.
second-Chapter 1
dimension column (1,12-di(tripropylphosphonium)dodecane bis(trifluoromethansulfonyl)amide coating). Both of these columns are produced by Supelco. The group reported highly satisfactory separation of the toxic ‘dioxin-like’ congeners available from the particular selectivity available with the selected column set.
A subsequent publication evaluated the use of two other Supelco ionic liquid columns, namely SLB-IL 82 and SLB-IL 100 in GC–MS and GC×GC–FID applications for the analysis of fatty acid methyl esters (FAMEs) from algae [119]. In comparison to polyethylene glycol and cyanopropyl columns tested under the same conditions, the Supelco ionic liquid columns showed improved sensitivity arising from increased stability of the coating and less column bleed. A similar resolution was obtained, affirming the suitability of the selection for this application.
perceived deficiency in available separation space with ‘less orthogonal’ column choices.
The use of chemometric data analysis approaches in conjunction with GC×GC–MS techniques also featured highly during this period. Due to the ever-increasing amount of information accessible with this approach, evolution of appropriate results interpretation becomes important. Appropriate use of the diverse ‘toolbox’ of interpretation strategies available to the analyst ensures the presentation of meaningful conclusions. Almstetter and co-workers investigated the use of the Statistical Compare alignment algorithm developed by LECO for profiling bacterial metabolites separated with GC×GC–TOFMS and compared the results to those obtained using an in-house method [105]. Their results showed that the commercial approach improved quantitative precision and provided a satisfactory fingerprinting technique for the application. Whilst only investigating a one-dimensional approach, Jalali-Heravi et al. applied several chemometric techniques to deconvolute components of interest in mandarin and lemon essential oil samples [122]. The group reported that their preferred technique of mean field independent component analysis (MF-ICA) provided satisfactory results for the samples investigated. Synovec and collaborators published several manuscripts during this period detailing a series of in-depth approaches [123-126]. The use of Principal Component Analysis (PCA) as a data comparison tool featured heavily in these publications.
1.3 Concluding remarks
Chapter 1
through zone focussing and enhanced separation power as a result of the large peak capacity afforded. As the first decade of the 21st century draws to a close, an interesting analogy may be drawn between the technique of GC×GC–MS and the increase in popularity of ‘lifestyle’ technology reaching the consumer market. It would not be unreasonable to expect the initial scepticism surrounding this analytical methodology to be swept away with the tide of reduced initial and on-going expenditure, open source software packages and the thirst for information as witnessed in so many areas throughout recent years, yielding a constant expansion and uptake of the technique in the very near future.
1.4 Scope of the thesis
The continued development of gas chromatographic techniques and technology has generated multiple approaches for the separation of complex samples. Generally speaking, there is always a degree of compromise when pairing a particular sample with a separation technique. This is witnessed in areas such as separation time, efficiency and peak capacity, and to a lesser degree in secondary separation aspects including the size and complexity of the collected data.
efficiency for potential use as a second-dimension column. A high temperature stable wax column was investigated as another potential second-dimension stationary phase, although the available column dimensions did not suit this application. To contrast this study, very long narrow-bore columns were also investigated for potential use in the first dimension, leading to discussion on selection of column length based on desired pressure parameters and required efficiency.
The development of a pneumatic modulator for GC×GC–qMS and GC×GC– FID is discussed in Chapter 4. The study began with the determination of the limitations of the quadrupole mass spectrometer under different flow conditions. Development and optimisation of a modulator ensued, and a partial modulation interface was deemed to be the most appropriate to operate the instrument and stationary phases at close to optimum values. To conclude the chapter, a study was conducted using the information collected in Chapter 3 to select an appropriate column set for the system. This involved data collection across a broad combination of conditions to determine the optimum trade-off between available sensitivity, efficiency and analysis time.
Chapter 1
Chapter 2: Experimental
This chapter describes an overview of the experimental parameters utilised throughout this thesis. Full experimental details are provided in the relevant discussion chapters.
2.1 Standards
A C8-C20 n-alkane standard mix and individual C21-C30 standards were
purchased from Sigma-Aldrich (Castle Hill, Australia). The concentration of each alkane was 40 mg/L in hexane. For the calculation of retention indices, a 20 mg/L mix of C8-C20 n-alkanes was prepared by dilution of the stock solution with
dichloromethane.
2.2 Instrumentation
Chapter 2
range 40-455 m/z (70 ms scan period) for one-dimensional separations and at a data acquisition frequency of 25 Hz over the mass range 35-350 m/z for two-dimensional separations, unless otherwise stated.
For GC×GC–FID separations, the FID was held at a temperature of 260 °C and was operated at an acquisition rate of 250 Hz. Nitrogen was used as the make-up gas and was supplied either from a cylinder (BOC, Tasmania) or via the reticulated N2 gas system within the laboratory.
Either hydrogen or helium was used as the carrier gas for all experiments. Hydrogen was supplied by a Parker Balston Hydrogen Generator (Restek Distributor, Baulkham Hills, Australia) and ultra-high purity helium delivered from a cylinder (BOC, Hobart, Tasmania).
Some confirmatory GC×GC analyses were carried out using an Agilent 6890 GC (Agilent Technologies, Forest Hills, Australia) equipped with a custom dual-jet cryogenic (CO2) modulation system based on the design of Beens et al. [127] and a
flame ionisation detector.
2.3 Stationary phases
The stationary phases selected for this study are shown in Table 2.1.
2.4 Modulation
![Figure 1.1. Comparison of two multidimensional approaches: GC×GC vs GC–MS (adapted from Phillips and Beens [1])](https://thumb-us.123doks.com/thumbv2/123dok_us/8426293.330886/20.595.182.457.74.464/figure-comparison-multidimensional-approaches-gc-adapted-phillips-beens.webp)
![Figure 1.2. GCGC–MS total ion current chromatogram of a marine diesel fuel sample. Reprinted with permission from [4], copyright 1999, Wiley-VCH Verlag GmbH & Co](https://thumb-us.123doks.com/thumbv2/123dok_us/8426293.330886/24.595.149.526.73.352/figure-current-chromatogram-marine-reprinted-permission-copyright-verlag.webp)
![Figure 1.4. GCGC–MS analysis of P. graveolens. Reprinted with permission from [17], copyright 2003, The Royal Society of Chemistry](https://thumb-us.123doks.com/thumbv2/123dok_us/8426293.330886/30.595.116.512.72.381/figure-analysis-graveolens-reprinted-permission-copyright-society-chemistry.webp)