“CHANGES OF BRAINSTEM AUDITORY EVOKED POTENTIAL AND VISUAL EVOKED POTENTIAL IN VERTEBROBASILAR TRANSIENT ISCHEMIC ATTACK PATIENTS”
Dissertation submitted to
THE TAMIL NADU DR. M.G.R. MEDICAL UNIVERSITY In partial fulfilment of the
Regulations for the award of the degree of
(M.D. PHYSIOLOGY) BRANCH-V
THANJAVUR MEDICAL COLLEGE HOSPITAL THE TAMILNADU Dr. M.G.R. MEDICAL UNIVERISTY
CHENNAI, INDIA APRIL – 2016
CERTIFICATE
This dissertation entitled “ CHANGES OF BRAINSTEM
AUDITORY EVOKED POTENTIAL AND VISUAL EVOKED POTENTIAL IN VERTEBROBASILAR TRANSIENT ISCHEMIC ATTACK PATIENTS ”
is submitted to The Tamil Nadu Dr. M.G.R. Medical University, Chennai in partial
fulfilment of the regulations for the award of M.D., Degree in physiology in the
Examinations to be held during April 2016.
This Dissertation is a record of fresh work done by the candidate
Dr. R.MOHAN, during the course of the study (2013-2016). This work was carried
out by the candidate himself under my supervision.
Dr.M. Singaravelu M.D., D.C.H., Prof. Dr.R.Vinodha, M.D.,
The Dean, Professor & HOD
Thanjavur Medical College, Department of Physiology,
Thanjavur - 613004 Thanjavur Medical College,
Thanjavur - 613004
,
:
DECLARATION
I solemnly declare that the Dissertation titled “CHANGES OF
BRAINSTEM AUDITORY EVOKED POTENTIAL AND VISUAL EVOKED POTENTIAL IN VERTEBROBASILAR TRANSIENT ISCHEMIC ATTACK PATIENTS” is done by me at Thanjavur Medical College, Thanjavur
The Dissertation is submitted to the Tamil Nadu Dr. M.G.R. Medical
University, Chennai, in partial fulfilment of requirements for the award of M.D.
Degree (Branch V) in physiology
Dr. R.Mohan
Post Graduate in Physiology,
Thanjavur Medical College,
ACKNOWLEDGEMENT
I express my sincere thanks to my guide PROF. DR. R. VINODHA, M.D.,
Professor and Head of the Department of Physiology, Thanjavur Medical College,
Thanjavur for the constant guidance, suggestions and for being a great source of
inspiration for my entire duration of the study.
I would like to thank the Dean, Thanjavur Medical College,
Thanjavur, for permitting me to do this work at Thanjavur Medical College,
Thanjavur.
I thank, Dr. Nagarajan, M.D., H.O.D., of Internal Medicine,
Thanjavur Medical College, Thanjavur for helping me to recruit patient for this
study.
I would like to thank all of my subjects who participated and for their
kind co-operation for this study.
I owe my sincere gratitude to my ever loving and ever supporting
parents, my wife and my children.
Finally, I thank almighty God for completion of this study.
CONTENTS
S. No. TITLE PAGE NO
1. ABSTRACT
2. INTRODUCTION 1
3. AIM AND OBJECTIVES 4
4. REVIEW OF LITERATURE 5
4. MATERIAL & METHODS 38
5. RESULTS 47
6. DISCUSSION 72
7. CONCLUSION AND LIMITATION 75
8. BIBLIOGRAPHY
9.
ANNEXURES
Proforma
Abbreviations used
Informed consent form
ABSTRACT
The Aim of the study is to compare the changes in Brainstem Auditory Evoked Potential
and Visual Evoked Potential in VertebroBasilar Transient Ischemic Attack patients to
the normal subject.
For this study, Auditory Evoked Potential and visual evoked potential were recorded in
40 patients with Vertebrobasilar Transient Ischemic Attack and 40 normal control
group. This study was conducted at Research Laboratory , Department of
Physiology,Thanjavur Medical College, Thanjavur. The Study group was from the
Thanjavur Medical College & Hospital, Thanjavur.
Exclusion criteria were mainly Stroke, other Neurological diseases or Hearing loss.
Informed written consent from the patients of Thanjavur Medical College & Hospital
and control group was obtained.
In Brainstem Auditory Evoked Potential ,the Absolute Latency of Wave V
was prolonged and amplitude reduction was observed in Wave V of Vertebrobasilar
Transient Ischemic Attack patient and was found to be statistically significant.
In Visual Evoked Potential , no changes were observed in the Absolute Latency
and amplitude of Vertebrobasilar Transient Ischemic Attack patient and was found to
INTRODUCTION
Transient Ischemic Attack describes the symptoms of nervous system due to
ischemic origin that lasts for less than 24 hours. Indeed most of the attacks last
only few minutes to an hour. (1)
This transient attack is based on more than one mechanism. If any stenosis is
present in the vertebrobasilar system, Transient ischemia will be caused by
reduction of blood distally. The Transient ischaemia is mainly because of
inadequate collateral bloodflow. VB TIA may have a hemodynamic basis which
includes transient hypotension or cardiac arrhythmia. (1)
In clinical medicine Ischemia is the common form of cell injury which results from hypoxia that is induced by reduction in blood flow mostly it is due to
mechanical obstruction of artery.(2)
So in ischemic tissues not only the aerobic metabolism is compromised, but also
the energy generation by anaerobic metabolism stops having all glycolytic
substances are exhausted. The accumulated metabolites will lead to inhibition of
glycolysis. The biochemically altered reactions occur following ischemia, which
will be summarized here. When the oxygen tension falls inside the cell, there will
be loss of oxidative phosphorylation and the ATP generation will be decreased.
This ATP depletion leads to sodium pump failure causes potassium efflux sodium
1
Influx of calcium also occurs which have many detrimental effects. Progressive
loss of the glycogen, and reduction in protein synthesis occur. (2 )
Attacks may be due to embolism from the heart or atherosclerotic plaque from the
proximal large vessel. Because of the responsiveness of the TIA to calcium channel
blockers, it suggests that the etiology is due to vasospasm. Lipohyalinosis and
atherosclerotic plaques are caused by long standing hypertension ,diabetes or other
vascular risk factors. (1)
It also has been associated with anemia,hyperviscosity,polycythemia,
thrombocytosis, bacterial endocarditis,cerebral venous thrombosis,and
it may clear with correction of the underlying disorder. (1)
TRANSIENT ISCHEMIC ATTACK:
It is an indicator of stroke. Twenty to twenty five% of the Ischemic stroke is due
to a defect in the vertebrobasilar arterial Circulation.(3)
It is a temporary Neurological deficit of sudden onset. The onset of symptoms in
TIA is sudden and it reaches its maximum intensity immediately. If it had not
follow a complete clinical recovery, then it would not be a TIA.
Following are the symptoms that confirm the typical TIA in the posterior
Circulation System. (3)
2
1. Bilateral dysfunction of the motor or sensory system.
2 .Either Complete loss of vision or partial loss of vision in the homonymous
field of both eyes.
3. Vertigo, Diplopia, Dysphagia, Dysarthria and Ataxia.
To consider this as a TIA, the above symptoms should be present as an isolated or
two or more combination of the symptoms.
Isolated presence of the above symptoms won‟t be consider as TIA.(3)
Changes of cerebral blood flow in VB TIA patients had studied by
Drake ME et al on the basis of brainstem auditory evoked potential and visual
evoked potential by P Benna et al. (4,5)
3
AIM AND
AIMS AND OBJECTIVES
This study was undertaken to compare the electrophysiological parameters between
VB TIA patients and the control.
To evaluate the changes in blood flow in VB TIA patients by doing the
electrophysiological parameters like brainstem auditory evoked potential and visual
4
REVIEW OF
REVIEW OF LITERATURE
CEREBROVASCULAR ANATOMY
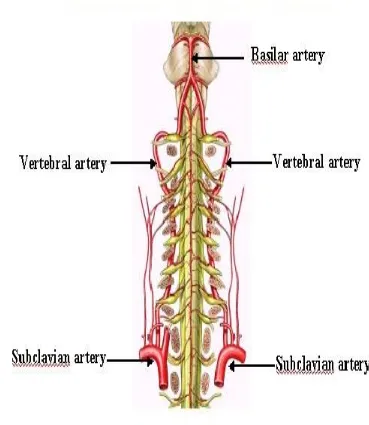
:VERTEBROBASILAR ARTERY:
[image:13.595.88.457.286.711.2]
5
The brain receives blood supply from two pairs of arteries ,the right and left
internal carotid arteries .Two vertebral arteries combines to form basilar artery .
The basilar artery supply brainstem and posterior portion of cerebral hemisphere .
This artery and the two internal carotid arteries unite to form the circle of Willis. (7)
CIRCLE OF WILLIS:
6
SUBCLAVIAN ARTERY
:The two vertebral arteries arise from the subclavian artery just proximal to the
thyrocervical trunk in the neck. This subclavian artery also gives the following
branches . They are internal thoracic artery, thyrocervicaltrunk,and costocervical
trunk. (7)
COURSE IN CERVICAL VERTEBRAE:
It ascends and pass through the foramina of the transverse processes of the cervical
vertebrae and enter into the skull via the foramen magnum. There will be a
variations in the level of entry of the vertebral artery into the foramina of cervical
vertebrae. This left subclavian artery arises directly from the aorta while the left
subclavian artery arises from the Brachio -cephalic trunk. (7)
COURSES IN THE BRAIN:
Then it course along the anterolateral surface of the medulla where it gives
branches that supply the medulla and the inferior aspect of the cerebellum before it
forms the basilar artery at the pontomedullary junction. The basilar artery occupy the anterior surface of the brainstem and supplies the pons ,cerebellum and
midbrain. Then it bifurcates into two posterior cerebral arteries which supply the
7
CORTICAL VASCULAR TERRITORIES:
8
CAUSES OF CEREBRAL ISCHEMIA: (6) VASCULAR DISORDER:
Atherosclerosis
Migraine
Connective tissue disorders
Drugs (Sympathomimetics)
Infective arteritis
Sickle cell anemia vasculopathy
Vascular dissection
Vascular trauma
Venous thrombosis
Vasculitis
Vasospasm
SYSTEMIC EMBOLISM:
Cardiac thrombus (Atrial Fibrillation, atrial myxoma, Dilated
9
Fat Embolism.
Infective endocarditis
Valvular Heart disease
HAEMATOLOGICAL DISORDERS:
Hypercoagulable states (Disseminated Intravascular Coagulation ,Paroxysmal
Nocturnal Hemoglobinuria ,Thrombotic Thrombocytopenic Purpura)
Hyperviscosity syndromes (PolyCythemiaVera , Myeloproliferative
disorders,thrombocytosis)
OTHERS:
Nephritic Syndrome
Oral contraceptive pills
The causes of cerebral ischemia will be divided mainly into two categories. The
one that cause Global ischemia and the others that cause ischemia of the focal
area.Focal ischemia results from a local disturbances in the vascular system. The
10
Primary diseases of the cerebral vasculature, embolism arising from the
extracerebral areas and disorders of the haematological system.Vascular
compromise is the ultimate common pathway that results in inadequate supply of
blood to a specific region in the brain, regardless of the aetiology. (6)
The alteration in the integrity of the endothelial wall initiate the formation of
thrombus and it lead to disruption in the normal laminar blood flow. These changes
will activate the coagulation cascade and subsequent thrombus production. The
primary regulator of the thrombosis is thrombin, which activates the aggregation of
the platelet and the formation of fibrin from the cleavage of the fibrinogen. (6)
This fibrin then forms the clot matrix by crosslinkage.This thrombus either
can block the vessel wall at the injured site of the endothelium or embolize distally
by shear stress and the action of antithrombotic intrinsic mechanism.
When the time progresses, these thromboemboli to the cerebral vasculature
lyses spontaneously. Often this will occur too late to prevent the formation of
permanent infarction.Atherosclerosis is the most common cause for the focal
ischemia formation. It is formed by the multifactorial process and lead to the
11
This atheroma contains cholesterol inflammatory cells, lipid laden
macrophages,
abnormally proliferated endothelial smooth muscle cells and connective tissue
forms within the vasculature. One of the key factors in the pathogenesis of
atherosclerosis is the injury of endothelium which causes the formation of fatty
streak and contributes to proliferation of smooth muscle cells. (6)
The source of thrombi which occlude the small cerebral blood vessels is the
thrombus that is formed at the site of atheromatous plaque.
The factors which determines the formation of
the atherosclerotic plaque will produce the symptoms of ischemia.
The basis for the atherosclerosis induced ischemia is the alteration in the local
hemodynamic forces , luminal narrowing which exposes the thrombogenic contents
of the necrotic core area.
Atherosclerosis may has a predilection for the vessel wall bifurcation
and curves in vasculature. In the cerebrovascular system, the atherosclerosis occurs
commonly at the beginning of internal carotid artery in neck area, distal part of
vertebral artery, carotid siphon and in the basilar artery. The prevalence of
atherosclerosis increases when the age advances. It affects younger men when
12
ATHEROSCLEROSIS RISK FACTORS
: .( 8) Old age
Family history of thrombotic stroke
Hypertension
Diabetes mellitus
Abnormal blood cholesterol level ( low HDL, High LDL)
Tobacco smoking
PATHOPHYSIOLOGY
:
Based on the previous discussion ischemia will be defined as an impairing tissue
perfusion with a view to reduction in blood flow relative to the metabolic demand.
Vessel occlusion produces a massive reduction in blood flow to the central core of
the tissue and a less reduction in the surrounding zone.
This surrounding tissue perfusion is maintained by the collateral
circulation. There will be no change in brain metabolism as long as cerebral blood
flow remains above 20 ml /100 gm / min .When the perfusion level reduces, the
brain electrical activity fails and the neurological symptom arises. (6)
13
Since the oxygen supply becomes insufficient to maintain the normal cellular
biochemical reaction, the high energy phosphate stores are quickly depleted.
Because of the meager supply of glucose to the tissue,
anaerobic metabolism occurs which results in excessive lactate production.
By the time the CBF is more severely reduced to 10-12 ml/100 gm/min
, the cell membrane integrity is lost and the depolarization leads to efflux of
potassium ions and influx of calcium ions into the neurons. This increased extra
cellular calcium results in increased energy consumption and the activation of the
sodium-potassium ATP -ase pump in an attempt to restore intracellular potassium.
Because the increased demand of the substrate cannot be compensated by increases
in CBF, ischemia results.(6)
CLINICAL FEATURES:
Vertebrobasilar system ischemia will produce motor and
sensory deficit. In addition to this, there will be a dysfunction of cranial nerve or
cerebellum.
Small lesions of the brainstem produces unilateral isolated motor deficit. PCA
14
Ischemia of the terminal branches of the vertebral basilar branches to the
cerebellum produces ataxia. (6)
DEFINITION :
TRANSIENT ISCHEMIC ATTACK:
Abrupt loss of neurologic function occurred due to reduction in blood supply that
persists for < 24 hours and resolves without residual disability. .(6)
ISCHEMIA :
A constant supply of the oxygen and glucose will need for the brain‟s function
which is supplied by cerebral blood vessel. Even though the brain weighing 1 to 2
percent of the body weight, it receives the resting cardiac output of fifteen percent.
It receives about 20 percent of total oxygen consumption of our body. (6)
Because of the autoregulation of the cerebral vascular resistance, the cerebral
blood flow remains constant over a broad range of blood pressure.
Brain is an aerobic organ so that the other metabolic substrate use is limiting. The
transient ischemia is due to interruption in the normal cerebral blood flow.
This cessation of blood flow will result from a reduction of
perfusion pressure .Impaired tissue function caused by reduction in blood supply
15
DIAGNOSTIC STUDIES:
Diagnostic studies include neuroimaging techniques , and CSF analysis are
very much useful. The neuroimaging findings of the cerebral ischemia will
significantly vary with time.
Within twenty four hours of the onset of the symptoms, the CT
Scan will detect subtle signs of the infarction. The changes are blurring of the
border between white and gray matter and loss of the sulci due to edema.
Magnetic resonance imaging of the brain is most sensitive to the ischemia. (6)
TREATMENT: .( 6)
The aim of the treatment of the ischemic stroke is to
limit the extent of the infarction and disability reduction.
It can be achieved by
I. Augmentation of fibrinolysis ( thrombolytic drugs)
II. Salvation of neurons in the region of ischemic penumbra ( agents with
neuroprotective property)
16
The antiplatelet drugs and anticoagulant drugs role to prevent the progression of
stroke is very much limited. The main goal of treatment in patients with ischemic
stroke and the patients of TIA is to minimize the risk of subsequent stroke.
This is achieved through
1. To reduce the thrombotic potential by antiplatelet or the anticoagulant
agents.
2. Modification of risk factors.
I . THROMBOLYTIC AGENTS :
Because the extent of brain injury which is induced by stroke is closely related to
the severity and duration of ischemia, the clot lysing agents restore cerebrovascular
perfusion eventually control the degree of injury. So that the outcome will improve
by these agents.
In acute ischemic stroke ,intravenous streptokinase was tested. Because of the
excessive haemorrhage, the trials were stopped.
Tissue plasminogen activator was trialled and it was accepted by the United states
Food and drug administration. tPA was associated with excellent recovery,
provided when it was administrated within first three hours of the onset of the
symptoms. These thrombolytic agents shall be injected directly into the occluded
17
It had the extensive advantage of higher recanalization rate and safety
improvement. The drug dose requirement in this situation is very much lower.
II. NEUROPROTECTIVE AGENTS:
The major goal of this therapy is to curtail the cellular death in the region of
ischemic penumbra. So that the size of the infarct will be limited and the outcome
will be improved.
Time is the important factor in efficient neuroprotective effect , since ischemia will
irreversible within minutes to hours of the onset.
Anticoagulant and Antiplatelet therapy:
The role of aspirin in the treatment of acute stroke is limited. A randomized
controlled trial was conducted with aspirin which revealed a reduction in early
mortality among the patients. Heparin has no consistent benefit in stroke patients.
Even though the risk of recurrent stroke was reduced by heparin, it had the
disadvantage to increase the extra cranial haemorrhage and haemorrhagic stroke.
III. PREVENTION OF THE COMPLICATIONS OF STROKE:
They are the major cause of morbidity and mortality among the stroke patients. The
18
Primary and secondary prevention of stroke and TIA:
General principles:
There are large number of strategies available to prevent the occurrence of stroke .
They are medical therapies and surgical techniques as well as modification of life
style.
Some of these techniques are applied in large extent on account of their low cost
and with minimal risk. Others costs a lot of money and carry considerable risk but
may be very useful for high risk patients. Identificationand prevention of the
modifiable risk factors is the best way of planning to minimize the burden of
stroke. .(6)
Hypertension is the most important risk factor. So all the hypertension must be
treated. The Statin drugs are used to reduce the risk of stroke in patients even
without the elevated level of cholesterol , which has confirmed by several trials.
SPARCL: (8)
(Stroke prevention by Aggressive reduction in cholesterol levels)
It showed usefulness in secondary reduction in stroke for patients with TIA.
Atorvastatin 80 mg/ day was prescribed for this patient. Therefore statin must be
19
ANTIPLATELET AGENTS:
.( 8)Atherothrombotic events like TIA and stroke can prevented by using
antiaggregation
agents by inhibit the formation of platelet aggregates in the intraarterial system.
In the diseased artery the platelet aggregates formed ,which either occlude the
artery or lead to distal embolization.
Agents to be used for this purpose are,
Aspirin
Clopidogrel
Aspirin + Extended release Dipyridamole
The most widely studied antiplatelet drug is aspirin.It activates the enzyme platelet
cyclooxygenase, which inhibit the formation of Thromboxane A2 in platelets
irreversibly. It is a prostaglandin produced from the pathway of cyclo-oxygenase
with a property of powerful platelet aggregation.
This effect is permanent and its lasts for the life of the platelet. Aspirin also inhibit
the production of Prostacyclin paradoxically. This Prostacyclin is an
antiaggregating and vasodilating agents. When compared to aspirin, ticlopedine is
20
This study was undertaken to identify the changes of electrophysiological
parameters in VB TIA patients when compared to normal subjects.
The electrophysiological parameters used in this study were VEP & BAEP.
The VEP represent the mass response of the cortical and subcortical areas.
If the entire visual system is intact, then only the normal cortical responses are
obtained and the abnormal VEP will be produced by the disturbances anywhere in
the visual system . Because of this property, localizing value of the VEP is
limited.(9)
VEP is an electrical response recorded from the visual cortex
in response to a change in visual stimuli such as multiple flashes of light ( Flash
visual evoked potential). It can identify the functional loss in the visual pathway
from the visual cortex.
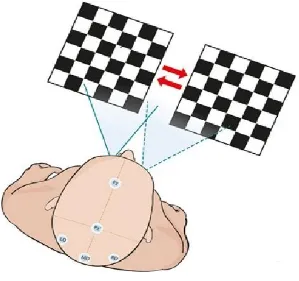
The visual stimuli may be unstructured as in a flashing light, or structured ,as in
some form of pattern to the flash stimuli or the stimuli may be patterned, as in
checkerboard presented on a video display unit. The essential feature is that while
the pattern changes, the overall illumination remain the same. Black squares go
white and white become black and this will occur alternatively. The rate of the dark
square become lightening being the same as that of the darkening of the light
21
FLASH VISUAL EVOKED RESPONSE:
This is a most crude test and it indicates that light has been perceived. It is a fovea
dominated response and is relatively unaffected by opacities in the cornea and the
lens. It is therefore a useful test to grossly assess the intactness of the macula or the
optic nerve. ( 11)
PATTERN REVERSAL VISUAL EVOKED RESPONSE :
This depends on the form sense and may give a rough estimate of visual acuity. It is
more of fovea specific response .the timing of responses are more reliable than the
amplitude. The preferred stimulus for the visual evoked potential testing is a
checkerboard pattern of black and white squares.(11)
NORMAL VEP FINDINGS:
The VEPs consists of a series of forms opposite polarity. The negative waves are
denoted by N and positive waves by P ,which is followed by the approximate
latency in ms. The commonly seen wave forms are N75,P100,and N145. The peak
latency and peak to peak amplitudes of these waves are measured. (9)
22
VISUAL EVOKED POTENTIAL:
FIGURE:4
BASIS OF VEP ABNORMALITIES:
The VEP abnormalities may be latency prolongation, amplitude reduction and
combined latency and amplitude abnormalities. The commonest cause of prolonged
P100 latency is demyelination in the optic pathways where the
amplitude of P100 remains normal. (9)
CLINICAL USES OF VEP:
The VEP study is a sensitive method for detecting the abnormalities in visual
pathways especially anterior to the optic chiasma.It should be regarded as
complementary to clinical examination and neuro-ophthalmological
investigations.(9)
CHECKER BOARD PATTERN OF VEP:
FIGURE:5
[image:32.595.156.455.280.561.2]
BRAINSTEM AUDITORY EVOKED POTENTIAL:
Brainstem auditory evoked potentials (BAEP) are the potentials recorded from
the ear by placing the electrodes in the scalp in response to a brief auditory
stimulation to assess the conduction through the auditory pathway upto midbrain.
The evoked potentials that appear following transduction of the acoustic stimulus
by the ear cells create an electrical signal that is created through the auditory
pathway to the brainstem and from there to the cerebral cortex. BAEPs comprise
five or more waves within 10 ms of the stimulus. It may describe in terms of
duration of onset of response. (12)
WAVE I – Cochlear nerve
WAVE II – Cochlear nucleus
WAVE III – Superior Olivary Nucleus
WAVE IV – Lateral Lemniscus
WAVE V – Inferior Colliculus
FIGURE:7
AUDITORY PATHWAY:
In human being the sound reaches the brain through the ear. The frequency
of sound that humans can hear ranges from 20 - 20,000 Hz.
Then it travels through the outer, middle, and inner ear. In the Organ of Corti the
mechanical sound waves are converted into electric neural signal.
Then, the dendrites of primary auditory neurons communicate with these signal.
Later they are bundled into cochlear nerve after which they join the vestibular
nerve to form Vestibulo cochlear nerve. Information is transferred through
cochlear nuclei reaches the Superior Olivary complex and finally through the
Inferior Colliculus , Lateral Lemniscus to the thalamus. At the level of cochlear
nucleus this sound waves cross to the opposite side. (13,14)
The Inferior Colliculus within the midbrain is divided into dorsal
part nucleus and the central nucleus. The dorsal part receives both somatosensory
and auditory input. The central nucleus is involved in auditory localization. Within
the thalamus, there is an oval structure found within diencephalon which conveys
sensory input to the Medial Geniculate Nucleus (MGN).As it act as a primary
sensory area it represents a major relay station for auditory system. The Medial
Geniculate Nucleus ( MGN) consists of three subdivisions. Among which, the
principal nucleus receives the auditory input. (13,14)
From MGN, information is relayed to the primary auditory cortex which is
otherwise called us A1.It is located on transverse Gyrus of Heschl situated within
temporal lobe. This auditory cortical area allows the sensation of auditory
characteristics like pitch.
This primary auditory cortex is composed of many functional columns
Neurons found within same column process sounds of the same frequency.
Further, they are tonotopically organized in similar to all the previous stages of
auditory processing mentioned above. (15)
Auditory neurons are spatially arranged in an order– according to auditory
frequencies they process. There is more evidence that its distinction into two
different pathways with peculiar functions like in the visual cortex can be found in
auditory cortex. ( 16 )
VISUAL PATHWAY:
FIGURE: 8
VISUAL PROCESSING AND VISUAL PATHWAY
:
FIGURE: 9
The ganglion cell‟s axon of the retina passes caudally in the optic nerve fibre and
optic tract which eventually end in the lateral Geniculate body. The fibers from
each nasal half of retina crosses in the optic chiasm and leaves as optic tract
whereas the temporal fibers will not decussate.(17)
In the lateral geniculate body, the nasal half of one retinal fibers and the other
temporal half of the fibers synapse on the cells. The axons of these geniculate
bodies form the geniculocalcarine tract.This geniculocalcarine tract passes to the
occipital lobe of the cortex. Brodmann classify the visual cortex into 17,18 and 19.
Brodmann‟s area 17is the primary visual cortex, Which is also known as V1.This
primary visual cortex is located principally in the sides of the calcarine fissure .
The organization of the primary visual cortex is summarized in the following.
Pretectal region of the midbrain also receives Some of the axons of ganglion
cell.(17)
BAEPs are much more useful to study in assess the objective
function of the auditory system and also noninvasively. It specifically assess the
cochlea-auditory nerve – brainstem pathway resulting in an extensive development
of recording of both ear by placing the electrodes over the scalp and the far field
electric potentials.
EARLY AUDITORY EVOKED POTENTIALS:
Early auditory evoked potentials have also been reported to as short-latency
auditory evoked potentials and corresponding to the responses recorded within the
initial twelve millisecond after the given auditory stimulus. .(18)
MIDDLE LATENCY AUDITORY EVOKED POTENTIALS:
Middle latency Auditory evoked potentials are potentials occurring between
12 and 50 msec after an acoustic stimulation.. They can be recorded from
transient or from high frequency stimuli. Middle latency Auditory evoked potential
has been clinically applied in the assessment of hearing threshold in infants and
children, the identification of dysfunction in central auditory pathways, and the
evaluation of the central auditory pathways in candidates for cochlear implants. .(18)
LATE AUDITORY EVOKED POTENTIALS:
Evoked potentials occurring 50 msec after an acoustic stimulation are called slow
or late auditory evoked potentials. These potentials can be subdivided into
exogenous components. N1,P1 and P2 which are primarily dependent on
characteristics of the
external stimulus ,and endogenous components such as P300,N400,CNV,
and the mismatch negativity, which are more dependent on internal cognitive
processes. (18)
NORMAL BAEP FINDINGS:
The BAEP consists of five or more distinct wave forms recorded within 10
msec of the auditory stimulus and they are generated in different regions of the
peripheral and central auditory pathways. Wave I is originated from the
peripheral portion of the auditory system adjacent to the Cochlea.
Wave II originates from the cochlear nucleus, wave III from the
superior olivary nucleus Wave IV from the Lateral lemniscus , and Wave V
from inferior colliculi. The Absolute Latencies and Interpeak latencies I-III,III-V
and ,I-V were measured. Amplitude of Wave I and Wave V were measured.(18)
INTERPRETATION OF BAEPS:
BAEP interpretation requires identification and measurement of waves I,III,and V ,
the measurement of I-V and I-III intervals. These values could be compared with
the normal values of the patients.
First the absence of wave I with normal Wave V will probably
reflects the technical problem in recording. Then absence of wave III is significant
only when wave V is also missing or delayed. Finally BAEP s cannot be interpreted
without considering the patients hearing status; conductive hearing loss and
cochlear pathology may profoundly affect BAEP wave late latency and amplitude.
.(19)
FINDINGS OF EVOKED POTENTIALS IN VB TIA PATIENTS:
Drake ME et al Conducted a study of BAEP changes in vertebrobasilar transient
ischemic attacks patients . The study was recorded after resolution of symptoms ,
Some of the patient in this study still had resolving symptoms or signs. The
findings
in TIA patients were longer I-III, III-V, and I-V interpeak latencies , but these
were not significant when compared to controls. Absolute latency of Wave V was
significantly longer and amplitude of wave V is lower in TIA patients.(4)
P Benna et al conducted a study of brainstem evoked auditory response and visual
evoked potentials of pattern reversal in patients suffering from vertebrobasilar
TIA
with a view to obtain the functions of cortical-subcortical areas. BAEPs
alterations occur in patients with vertebrobasilar TIA .The parameters of VEPs
are normal in both group.(5)
Stewart A et al conducted Brain-stem auditory evoked response (BAER) at about
few days to two weeks after a vertebrobasilar transient ischemic attack (VB TIA) .
Initially it showed absence of all waveforms, prolongation of I –III , III –V and
I-V inter-peak latencies and reduction of amplitude . Some of the patients showed
reversal of latencies and amplitude to normal. Normalization of the waves
occurred 6 to 24 days after the VB TIA. The result of this studies are different
from other reported studies. (25)
Factor S A et al studied Brain-stem auditory evoked response in
vertebrobasilar transient ischemic attack (VB TIA) patients . In the beginning , all
showed, prolonged interpeak latencies, absence of waveforms and reduction in
amplitude . 5 out of 6 patients showed reversal of the changes to normal.In rest of
the patients it returned to near normal. 6 to 24 days after the VB TIA attack the
results came to normal. These results are very much different from other reported
studies.(20)
Meier U et al Studied the value of brain stem auditory evoked potentials in
vertebrobasilar circulation to diagnose the circulatory disorders. The evoked brain-
stem potential in patients of vertebrobasilar insufficiency showed variation in
diagnostic evaluation in the literature. Their examination revealed an advantage in
subdividing the BAEP changes into normal , slight and pronounced, within this
group of patients of the vertebrobasilar region blood supply disorders. Depending
upon the extent of the damage, the changes of BAEP varied .(21)
Ferbert A et al studied the Evoked potentials in diagnosis of brain
stem ischemia. They presented the impact of evoked potentials in diagnosis of
ischemic lesions of the brainstem. They found Prolonged interpeak latency of
Wave I-III of Brainstem auditory evoked potentials in patients with caudal
occlusions, whereas visual evoked potentials were normal in most of the cases.
The Brainstem Auditory Evoked potential changes are found in patients with
basilar artery thrombosis and primary hemorrhage of the pontine area indicating
the location of the lesion. Further they are of prognostic value. Depending on the
location of the infarction , the evoked potential changes are found in basilar artery
occlusive stroke.(22)
Thorwirth V et al studied the Brain stem Auditory evoked
potentials and visual pattern evoked in transient ischemic attacks.
Auditory-evoked brainstem potentials, visual pattern-Auditory-evoked and somatosensory-Auditory-evoked
potentials in transitory ischemic attacks (TIA). They found that without any
diagnostic risk , the combination of visual evoked potentials and auditory
brainstem-evoked can detect the functional lesions in regions of cerebrum with
different blood flow .
Their results showed that there was a delay in the peak of
Wave III of the BAEP in TIA in patients and possibly of specific importance in
brainstem lesion.(23)
Zhang X. J et al studied the Clinical Value of Brainstem Auditory Evoked
Response in the Diagnosis of Vertebrobasilar Ischemia. They found an abnormal
value of BAEP in the patients of vertebrobasilar ischemia (VBI).
BAEP is an easy and effective means for the examination of VBI patients and
providing objective evidence to diagnose Vertebro basilar ischemia which may
be useful for future application.(24)
MATERIALS AND
MATERIALS AND METHODS
This study was conducted in the department of physiology, Thanjavur medical
college & Hospital, Thanjavur. The study was case control type and conducted
between January 2015 and July 2015. The patients were selected from the
department of Internal medicine.
In the 40 VB TIA Patients , 24 males and 16 females were selected in the age group
of 50-70. VB TIA was confirmed by the Neuroimaging technique MRI . History
of the patient was asked and complete examination including general and systemic
examination was done. In the control group 23 males, 17 females of age group
50-70 years were selected.
Exclusion criteria :
Neurological diseases
Hearing defects
Stroke
Hypertension
Diabetes mellitus
Meniere 's disease
Migraine
The Procedure was explained to all the persons who were participated . Informed
written consent was taken from both the controls and subjects . The ethical
committee was given an approval to this study.
The following electrophysiological parameters were studied:
Visual Evoked Potential (VEP)
Brainstem Auditory Evoked Potential ( BAEP )
All the parameters were recorded using four channel Digital Polygraph. Digital
Intex colour Monitor, 17” Model no : IT – 173 SB.
Medicaid neuroperfect plus Instrument was used in this study .
METHOD OF RECORDING VEP,BAEP:
Electrodes were placed using 10-20 electrode placement system.(26)
VISUAL EVOKED POTENTIAL
:
Pre test instructions:
(9)1. The subject was explained about the procedure of this test .
2. Informed consent were obtained.
3. The subject is instructed to avoid applying hair oil after their last hair Wash.
4. The subject can use their Optical lenses/Glasses during the test.
5 .The subject is instructed not to use any mydriatics or miotics during the
test.
6. Complete Ophthalmological examination was carried out to determine the
visual acuity , field of vision.
7.The Room should be quite and comfortable.
RECORDING OF VEP:
Settings for VEP:
SETTINGS
UNITS
Sweep 20 msec
Sensitivity 10 µV
Low cut 2 Hz
High cut 200 Hz
Pulse 1/sec
Pulse Width 0.1 msec
Notch On
Recordings 100 average was recorded using Checker Board
pattern stimulus
PROCEDURE
:
The visual evoked potential which was tested by pattern reversal was measured
separately for both eyes by the following steps,
1.The skin is prepared by degreasing.
2. The Recording electrode is placed at Oz using Ten 20 CONDUCTIVE
Neurodiagnostic electrode Paste as per 10-20 international system of EEG
electrode placement. (26)
3.Reference electrode is placed at FPz.
4. The Ground electrode is placed at Cz.
5. The procedure is conducted in dark room with subject sitting at a distance of
1 meter from the VEP screen which is showing pattern reversal stimuli in
Checker board pattern with reversal rate 2/sec contrast 50-80% check size 28-32 of
arc and number of trails is 100.
6.Values are marked in the obtained waveform.
BRAINSTEM AUDITORY EVOKED POTENTIAL:
Pre test instructions:
(9)1.The Subject was explained about the procedure of the test.
2.Informed consent was obtained from the subjects.
3. The subject is asked to avoid applying hair spray or hair oil after the last
hair wash.
4.Examination of the external ear was done & if any wax was found it was
removed.
4.Tunning fork test were carried out examples are Rinne‟s, Weber‟s &
Absolute bone conduction test.
5.Subject is made to relax completely.
6.Room should be quite and comfortable.
RECORDING OF BAEP:
Instrument settings for BAEP:
SETTINGS
BAEP
Sweep 5 msec
Sensitivity 10µV
Low cut 100 Hz
High cut 10 Hz
Pulse 11/sec
Pulse Width 0.1 msec
Notch ON
Decibels 60 Db
Recordings 100 average was recorded using click
sound as a stimuli
PROCEDURE:
1.The skin is prepared by abrading and degreasing
2.The electrode is placed at
Channel 1 = Cz-Ai (ipsilateral ear)
Channel 2 = Cz – Ac ( contralateral ear)
Ground electrode is placed at 20% from the nasion Fz
3. Head phones are placed on the ears for delivery of the auditory stimuli.
Clicks are delivered at the rate of 8-10/sec.Intensity is to set at 60 db. About
100 Averages are taken.
4. Wave I to V are marked in the obtained wave form. Wave I is the first major
upgoing peak following a stimuli.
5.Wave V is appear at approximately 6 ms and is often combined with wave IV
into a single complex waveform. Wave III is the major peak between wave I and V.
Wave II is typically the first major upward deflection in the Cz – Az waveform as
Wave I is markedly attenuated or absent.
6. From the above wave form interpeak latency I-III, III-V , and I – V is obtained.
Statistical method:
Electrophysiological parameters were analysed by using statistical package SPSS
version 18 and statistical analysis was done by student “ t ” test.
VEP RECORDING
VEP WAVEFORM
BAEP RECORDING
RESULTS:
In this study 80 subjects were included. 40 VB TIA patients were in study group
and rest of the 40 normal subjects were in control group.
In this study , 40 VB TIA study group were in the age of 50-70 years, mean
58.725 ± 4.272 and control groups were in the age group of 50-70 years, mean
58.975 ± 4.457.
The two groups differ significantly in BAEP. P value was derived from data
analysis using statistical package SPSS version and statistical analysis was done by
student „t‟ test. The statistical significance was considered when P value < 0.05 .
.
DESCRIPTIVE STATISTICS
TABLE 1: BAEP LATENCY Findings –CONTROL (n = 40)
LATENCY
(ms)
SIDE MINIMUM MAXIMUM MEAN STANDARD
DEVIATION
WAVE
I
RIGHT 1.6 1.9 1.71575 0.075035
LEFT 1.6 1.85 1.7125 0.064639
WAVE
III
RIGHT 3.55 4.08 3.776 0.105704
LEFT 3.45 4 3.76275 0.101829
WAVE
V
RIGHT 5.42 5.85 5.703 0.09962
LEFT 5.42 6.02 5.74575 0.133607
WAVE
I-III
RIGHT 1.85 2.46 2.06025 0.126054
LEFT 1.6 2.3 2.05025 0.128731
WAVE
III-V
RIGHT 1.57 2.25 1.927 0.154691
LEFT 1.6 2.5 1.983 0.173104
WAVE
I-V
RIGHT 3.7 4.2 3.98725 0.106962
LEFT 3.67 4.27 4.03325 0.157046
TABLE 2 : BAEP LATENCY Findings –SUBJECT (n = 40)
LATENCY
(ms)
SIDE MINIMUM MAXIMUM MEAN STANDARD
DEVIATION
WAVE
I
RIGHT 1.62 1.87 1.7295 0.057197
LEFT 1.62 1.88 1.7275 0.076149
WAVE
III
RIGHT 3.6 4.02 3.77925 0.103686
LEFT 3.62 3.98 3.78125 0.101633
WAVE
V
RIGHT 5.42 6.08 5.74125 0.13915
LEFT 5.52 5.98 5.7985 0.114635
WAVE
I-III
RIGHT 1.81 2.3 2.04975 0.11652
LEFT 1.85 2.33 2.06025 0.127192
WAVE
III-V
RIGHT 1.58 2.4 1.962 0.187195
LEFT 1.66 2.3 2.01725 0.162969
WAVE
I-V
RIGHT 3.73 4.39 4.01175 0.137204
LEFT 3.8 4.22 4.071 0.118013
TABLE 3 : BAEP Findings – P value
LATENCY
(ms)
SIDE CONTROL SUBJECT P-VALUE
WAVE- I LEFT 1.7125 1.7275 0.18
RIGHT 1.71575 1.7295 0.13
WAVE-III LEFT 3.76275 3.78125 0.09
RIGHT 3.776 3.77925 0.39
WAVE-V LEFT 5.74575 5.7985 0.02 **
RIGHT 5.703 5.74125 0.04 **
WAVE
I-III
LEFT 2.05025 2.05375 0.44
RIGHT 2.06025 2.04975 0.25
WAVE
III-V
LEFT 1.983 2.01725 0.13
RIGHT 1.927 1.962 0.11
WAVE I-V LEFT 4.03325 4.071 0.09
RIGHT 3.98725 4.01175 0.16
TABLE 4 :BAEP Amplitude Findings – SUBJECT
AMPLITUDE
(µV)
SIDE MINIMUM MAXIMUM MEAN STANDARD
DEVIATION
WAVE
I
RIGHT 3.02 22.15 9.972 5.401
LEFT 3.58 13.42 8.3375 2.630
WAVE
V
RIGHT 8.01 31.64 17.146 6.971
LEFT 8.28 37.84 17.449 6.882
TABLE 5 :BAEP Findings – CONTROL
AMPLITUDE
(µV)
SIDE MINIMUM MAXIMUM MEAN STANDARD
DEVIATION
WAVE
I
RIGHT 3.31 15.64 9.482 3.61
LEFT 4.12 18.26 8.978 3.619
WAVE
V
RIGHT 7.05 42.31 20.498 9.359
LEFT 8.75 36.58 19.95 5.670
TABLE 6 :BAEP Findings – „P‟ Value
AMPLITUDE(µV) SIDE SUBJECT CONTROL
P
VALUE
WAVE
I
RIGHT 9.972 9.482 0.32
LEFT 8.337 8.978 0.19
WAVE
V
RIGHT 17.146 20.498 0.05 **
LEFT 17.449 19.95 0.04 **
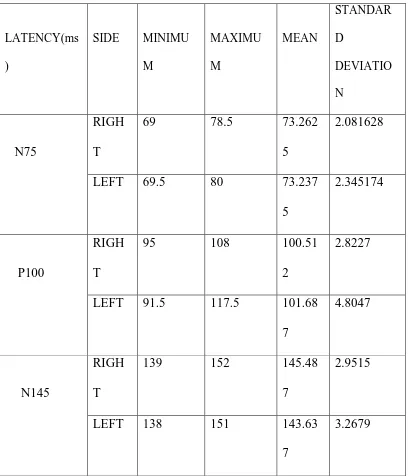
TABLE 7 :VISUAL EVOKED POTENTIAL – CONTROL (n=40)
LATENCY(ms )
SIDE MINIMU M MAXIMU M MEAN STANDAR D DEVIATIO N N75 RIGH T
69 78.5 73.262
5
2.081628
LEFT 69.5 80 73.237
5
2.345174
P100
RIGH
T
95 108 100.51
2
2.8227
LEFT 91.5 117.5 101.68
7
4.8047
N145
RIGH
T
139 152 145.48
7
2.9515
LEFT 138 151 143.63
7
3.2679
TABLE 8 :VISUAL EVOKED POTENTIAL – SUBJECT (n
= 40)
LATENCY(ms)
SIDE MINIMUM MAXIMUM MEAN
STANDARD
DEVIATION
N75
RIGHT 70 77 73.037 1.677
LEFT 69.5 78 72.95 2.0933
P100
RIGHT 97 105 100.775 1.822
LEFT 95 115 101.812 3.553
N145
RIGHT 138.5 152 145.475 2.832
LEFT 137.5 149.5 144.1 2.539
TABLE 9 : VISUAL EVOKED POTENTIAL
– P VALUELATENCY(ms) SIDE SUBJECT CONTROL P VALUE
N75
RIGHT 73.037 73.2625 0.21
LEFT 72.95 73.2375 0.14
P100
RIGHT 100.775 100.512 0.22
LEFT 101.812 101.687 0.38
N145
RIGHT 145.475 145.487 0.44
LEFT 144.1 143.637 0.07
TABLE 10 : VISUAL EVOKED POTENTIAL -
CONTROL
AMPLITUDE
(µV)
SIDE MINIMUM MAXIMUM MEAN STANDARD
DEVIATION
P 100 RIGHT 3.02 22.15 11.433 1.919383
LEFT 3.58 13.42 11.358 2.221044
TABLE 11 : VISUAL EVOKED POTENTIAL - SUBJECT
AMPLITUDE(µV) SIDE MINIMUM MAXIMUM MEAN STANDARD
DEVIATION
P 100 RIGHT 3.02 22.15 11.477 1.834364
LEFT 3.58 13.42 11.345 2.142257
TABLE 12
:
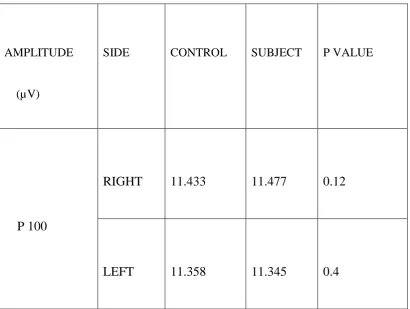
VISUAL EVOKED POTENTIAL - P VALUE
AMPLITUDE
(µV)
SIDE CONTROL SUBJECT P VALUE
P 100
RIGHT 11.433 11.477 0.12
LEFT 11.358 11.345 0.4
[image:71.595.101.512.162.471.2]
FIGURE:10
The Absolute Latency of Wave I of left side in VB TIA patients show the mean
value of 1.7275±0.076149 and in the control group it is 1.7125±0.064639 with
a P value of 0.18 showing the difference insignificant.
The Absolute Latency of Wave I of right side inVB TIA patients show the mean
value of 1.7295±0.057197 and in the control group it is 1.71575±0.075035 with
a P value of 0.13 showing the difference insignificant.
60
1.7 1.705 1.71 1.715 1.72 1.725 1.73 1.735
I L C I L S I R C I R S
I L C
I L S
I R C
FIGURE:11
The Absolute Latency of Wave III of left side in VB TIA patients show the mean
value of 3.78125±0.101633 and in the control group it is 3.76275±0.101829
with a P value of 0.09 showing the difference insignificant.
The Absolute Latency of Wave III of right side in VB TIA patients show the mean
value of 3.77925±0.103686 and in the control group it is 3.776±0.105704 with a
P value of 0.39 showing the difference insignificant.
61
3.75 3.755 3.76 3.765 3.77 3.775 3.78 3.785
III L C III L S III R C III R S
III L C
III L S
III R C
FIGURE:12
The Absolute Latency of Wave V of left side in VB TIA patients show the mean
value of 5.7985±0.114635 and in the control group it is 5.74575±0.133607 with
a P value of 0.02 showing the difference significant.
The Absolute Latency of Wave V of right side in VB TIA patients show the mean
value of 5.74125±0.13915 and in the control group it is 5.703±0.09962 with a P
value of 0.04 showing the difference significant.
62
5.64 5.66 5.68 5.7 5.72 5.74 5.76 5.78 5.8 5.82
V L C V L S V R C V R S
V L C
V L S
V R C
FIGURE:13
Interpeak latency Wave I-III of left side in VB TIA patients show the mean value
of 2.06025 ±0.127192 and in the control group it is 2.05025 ±0.128731 with a P
value of 0.44 showing the difference insignificant.
Interpeak latency Wave I-III of right side in VB TIA patients show the mean value
of 2.04975 ± 0.11652 and in the control group it is 2.06025 ± 0.126054 with a P
value of 0.25 showing the difference insignificant.
63
0 0.5 1 1.5 2 2.5 3 3.5 4
I - III L C I - III L S I - III R C I - III R S
I - III L C
I - III L S
I - III R C
FIGURE:14
Interpeak latency Wave III - V of left side in VB TIA patients show the mean value
of 2.01725 ± 0.162969 and in the control group it is 1.983±0.173104 with a P
value of 0.13 showing the difference insignificant.
Interpeak latency Wave III - V of right side in VB TIA patients show the mean
value of 1.962 ± 0.187195 and in the control group it is 1.927±0.154691 with
a P value of 0.11 showing the difference insignificant
64
1.88 1.9 1.92 1.94 1.96 1.98 2 2.02 2.04
III - V L C III - V L S III - V R C III - V R S
III - V L C
III - V L S
III - V R C
FIGURE:15
Interpeak latency Wave I-V of left side in VB TIA patients show the mean value of
4.071 ± 0.118013 and in the control group it is 4.03325 ± 0.157046 with a P
value of 0.09 showing the difference insignificant.
Interpeak latency Wave I-V of right side in VB TIA patients show the mean value
of 4.01175 ± 0.137204 and in the control group it is 3.98725 ± 0.106962
with a P value of 0.16 showing the difference insignificant
65
0 1 2 3 4 5 6 7
I - V L C I - V L S I - V R C I - V R S
I - V L C
I - V L S
I - V R C
FIGURE:16
Amplitude of Wave I of left side in VB TIA patients show the mean value
of 8.3375±2.630 and in the control group it is 8.978±3.619 with a P value of
0.19 showing the difference insignificant.
Amplitude of Wave I of right side in VB TIA patients show the mean
value of 9.972±5.401 and in the control group it is 9.482±3.61 with a P value of
0.32 showing the difference insignificant.
Amplitude of Wave V of left side in VB TIA patients show the mean
value of 17.449±6.882 and in the control group it is 19.95±5.67 with a P value of
0.04 showing the difference significant.
66 0 5 10 15 20 25 AMP I L C
AMP I L S
AMP V L C
AMP V L S
AMP I R C
AMP I R S
AMP V R C
AMP V R S
AMP I L C
AMP I L S
AMP V L C
AMP V L S
AMP I R C
AMP I R S
AMP V R C
Amplitude of Wave V of right side in VB TIA patients show the
mean value of 17.146±6.971 and in the control group it is 20.498±9.359 with a P
value of 0.05 showing the difference significant.
FIGURE:17
VISUAL EVOKED POTENTIALS:
The Absolute Latency of N 75 of left side in VB TIA patients show the mean value
of 72.95±2.0933 and in the control group it is 73.2375± 2.345174 with a P value
of 0.14 showing the difference insignificant.
The Absolute Latency of N 75 of left side in VB TIA patients show the mean value
of 73.037±1.677 and in the control group it is 73.2625±2.081628 with a P value
of 0.21 showing the difference insignificant.
68 72.75 72.8 72.85 72.9 72.95 73 73.05 73.1 73.15 73.2 73.25 73.3
N75 L C N75L S N75 R C N75R S
N75 L C
N75L S
N75 R C
FIGURE:18
VISUAL EVOKED POTENTIALS:
The Absolute Latency of P 100 of left side in VB TIA patients show the mean
value of 101.812 ± 3.553 and in the control group it is 101.687±4.8047 with a P
value of 0.38 showing the difference insignificant.
The Absolute Latency of P 100 of Right side in VB TIA patients show the mean
value of 100.775±1.822 and in the control group it is 100.512±2.8227 with a P
value of 0.22 showing the difference insignificant
69
99.5 100 100.5 101 101.5 102
P 100 L C P100L S P 100 R C P100R S
P 100 L C
P100L S
P 100 R C
FIGURE:19
VISUAL EVOKED POTENTIALS:
The Absolute Latency of N 145 of left side in VB TIA patients show the mean
value of 144.1± 2.539 and in the control group it is 143.637±3.2679 with a P
value of 0.07 showing the difference insignificant
The Absolute Latency of N 145 of Right side in VB TIA patients show the mean
value of 145.475 ± 2.832 and in the control group it is 145.487± 2.9515 with a P
value of 0.44 showing the difference insignificant
70
142.5 143 143.5 144 144.5 145 145.5 146
N 145 L C N145L S N 145 R C N145R S
N 145 L C
N145L S
N 145 R C
FIGURE:20
VISUAL EVOKED POTENTIALS:
Amplitude of P 100 of left side in VB TIA patients show the mean value of
11.345 ± 2.142257 and in the control group it is 11.358±2.221044 with a P
value of 0.19 showing the difference insignificant.
Amplitude of P 100 of right side in VB TIA patients show the mean value of
11.477 ± 1.834364 and in the control group it is 11.433± 1.919383 with a P
value of 0.32 showing the difference insignificant.
71 11.25 11.3 11.35 11.4 11.45 11.5
AMP P100 L C
AMP-P100 L S
AMP - P100 R C
AMP-P100 R S
AMP P100 L C
AMP-P100 L S
AMP - P100 R C
DISCUSSION:
In this study, the electrophysiological parameters were evaluated in patients with
VB TIA. The results of the electrophysiological study were compared between 40
patients with VB TIA and 40 healthy subjects.
In this study, the Absolute Latency of Wave V is prolonged and reduction in
Amplitude of Wave V in patients with VB TIA and is found to be statistically
significant. It suggested that the diminished blood flow and alteration in cerebral
metabolism during the course of transient ischemic attack may be the possible
explanation for the amplitude reduction of BAEP. The amplitude depends on the
intactness of the blood flow which is essential for the function of the brain.
In this study, no changes were found in the Interpeak latency of brainstem auditory
evoked potential I-III,III-V ,and I-V in patients with VB TIA and statistically it
was not significant.
This study showed that the symptoms relating to the VB TIA may be due to the
reduction in blood flow to the brain especially the cerebellar cortex.
In the present study , empathized with the study of Benna P et al showed no
changes were observed in the VEP parameters N75, P100 & N145.Similar
Results were observed by Benna P et al. (5)
Stroke is an important consequence of VB TIA . TIA is a chronic process , in this
disease there will be a formation of atherosclerotic plaque. The symptoms are
mainly due to the formation of emboli which may originate from other systemic
organs. The resolution of symptom is due to collateral formation or lysis of emboli.
However the clinical observation and neuroimaging suggested that TIA
had a deleterious effect and it will further lead to the development of stroke. Since
the electrophysiological studies are useful to identify the changes in VB TIA
patients, we could prevent them to develop the full blown stroke.
Measurement of stimulus conduction by means of evoked potentials is
sensitive and reliable in the earlier detection of subclinical changes.
This study results are consistent with DRAKE ME et al, PENNA B et al
showed significant reduction in amplitude of wave V and normal parameters of
VEP suggested that there has been a reduction in blood flow in posterior
circulation. In this study, there was a reduction in amplitude of wave V and
Prolongation of Absolute Latency of Wave V of BERA in patients with VB TIA
and it was statistically significant (P Value < 0.05) . These patients had a
subclinical changes in vessel wall so that the blood flow was reduced. (4,5)
Mills JA et al evaluated brainstem auditory evoked potential in patients of
reduced cerebral blood circulation and found that a significant change in absolute
latency of wave V( P <0.05). and it was concluded that there is an alteration in
myelination. (37)
Rossi L et al evaluated brainstem auditory evoked
potential in VB TIA patients. They found a significant change in prolongation in
Wave V latency (P< 0.05) and it was concluded that there is an alteration in
myelination in VB TIA patients. (41)
CONCLUSION
Electrophysiological parameter like absolute latency of I,III,V and interpeak
latencies of I-III, III-V, I-V , amplitude of wave I & V were evaluated. In the
present Study , Amplitude reduction in Wave V and prolongation of Latency of
Wave V of BERA were observed.
In VEP, No changes were observed in Latency and Amplitude. This study is very
much useful to identify the early detection of progression of stroke in VB TIA
Patients.
Finally further studies are required to evaluate the correlation between the
electrophysiological parameters & progression into stroke . So that preventive
measures can be used to prevent early involvement of Stroke.
BIBLIOGRAPHY:
1. Merritt's neurology Lewis P.Rowland MD,Timothy A Padley editors 12th
edition Chapter 39, Transient Ischemic Attack Philadelphia page 266-67.
2. Robbins and Cotran, Pathologic Basis of Disease cellular Responses to Stress
Toxic Insults:Adaptation,Injury,and Death, cerebrovascular disease South asia
edition vinay kumar MD, Abdul K Abbas MBBS,Jon C.Aster Ph D. Elsevier pages
50-52,1263-1267.
3. Neurology in clinical practice Volume II Neurological disorders 5th edition
Walter. G. Bradley, Robert B Daroff, Gerald M.fenichel,Joseph Jankovic Editers
Ischemic cerebrovascular disease,Elsevier pages 1170-1172.
4. Drake ME , Pakalnis A, Padamadan H, Hietter SA Clin. Electro Encephalogr,
Auditory evoked potentials in Vertebrobasilar TIA .1990 Apr; 21(2): 96-100.
5. P Benna , Visual evoked potentials and brainstem auditory evoked potential in
migraine and transient ischemic attacks cephalalgia (Impact Factor: 4.12).
06/1985; 5 Suppl 2:53-8.
6. Encyclopedia of the human brain, V.S.Ramachandran Editor volume 4 stroke,
Elsevier pages 475-85.
7. Carmine D.Clemente , Anatomy, A regional atlas of the Human Body, carotid
and vertebral arteries,Variations of vertebral arteries. 6th edition,Wolters
8. Harrison‟s principles of internal medicine, Dan L. Longo, Dennis L. Kasper,
J.Larry Jameson, Anthony S. Fauci, Stephen L. Hauser,Joseph Loscalzo
Editors,cerebrovascular diseases, 18th edition,Mc Graw Hill, pages 3271-83.
9 .UK Misra, J. Kalita Visual evoked potential, Brainstem Auditory Evoked
Potential , Clinical neurophysiology, 2nd edition .India:Elsevier pages 309-344.
10.Parson. Assessment of visual function.In:Ramanjit sihota,Radhika Tandon.
Parson‟s Diseases of the Eye.19th
edition.NewDelhi:Butterworth-Heinemann;2003.pages 107.
11. Dr.R.D.Ravichandran.Electrophysiology of the retina and visual
pathway.In:Dr.G.Natchiar,editor.Neuro-ophthalmology – a manual of
postgraduate,Aravind Eye Hospital.India:2003.pages 43-44
12.Sharmila V. Srireddy,colleen E.Ryan and John K.Niparko,Lloyd B minor,David
S Zee,editor.Clinical Neurology.London:Martin Dunitz,Taylor &Francis
Group;2003 pages 70-75
13. Kandel, E.R., Schwartz, J.H., & Jessell, T.M.. (2000). Principles of Neural
Science. NeWYork: McGraw-Hill Companies
14. Pinel, J.P.J. (2001). Biopsychologie. (Wolfram Boucsein, Ed.). Spektrum
Akademischer Verlag: Heidelberg.
15. Schreiner, C. E. (1992). Functional organization of the auditory cortex: maps
16. Kaas, J. H., & Hackett, T. A. (1999). 'What' and 'where' processing in auditory
cortex. Nature Neuroscience, 2(12), 1045-1047
17. Ganong‟s Review of Medical Physiology , central and peripheral
neurophysiology, 23rd edition,Mc Graw Hill Lange, page 184.
18.Ernst Niedermeyer Metabolic centrl nervous syste