Simulating Demand for Electrical Vehicles using Revealed
Preference Data
Áine Driscoll,
aSeán Lyons,
a,bFranco Mariuzzo,
c,dand
Richard S.J. Tol
e,f,gSubsequently published in “Simulating Demand for Electric Vehicles Using Revealed Preference Data", Energy Policy, Vol. 62, November 2013, pp. 686-696, Published online 7 August 2013
Abstract
: We have modelled the market for new cars in Ireland with the aim of
quantifying the values placed on a range of observable car characteristics. Mid-sized
petrol cars with a manual transmission sell best. Price and perhaps fuel cost are
negatively associated with sales, and acceleration and perhaps range are positively
associated. Hybrid cars are popular. The values of car characteristics are then used to
simulate the likely market shares of three new electrical vehicles. Electrical vehicles
tend to be more expensive even after tax breaks and subsidies are applied, but we
assume their market shares would benefit from an “environmental” premium similar
to those of hybrid cars. The “environmental” premium and the level of subsidies
would need to be raised to incredible levels to reach the government target of 10%
market penetration of all-electric vehicles.
Corresponding Author: [email protected]
a Economic and Social Research Institute, Dublin b Department of Economics, Trinity College Dublin c School of Economics, University of East Anglia d Centre for Competition Policy, University of East Anglia e Department of Economics, University of Sussex
f Institute for Environmental Studies, Vrije Universiteit, Amsterdam, The Netherlands g Department of Spatial Economics, Vrije Universiteit, Amsterdam, The Netherlands
ESRI working papers represent un-refereed work-in-progress by researchers who are solely responsible for the content and any views expressed therein. Any comments on these papers will be welcome and should be sent to the author(s) by email. Papers may be downloaded for personal use only.
Simulating Demand for Electrical Vehicles using Revealed
Preference Data
1.
Introduction
The Irish government provides incentives for purchase of electrical vehicles in pursuit of climate and energy targets, following the directions set out in the EU Climate and Energy Package and the Renewable Energy Directive (2009/28/EC). Ireland has set as own target that 10% of all vehicles will be electric by 2020.1
Electrical vehicles reached the Irish market in 2008. In that first year just five electrical cars were sold, and by 2011 that number was only up to 44 units. Considering the ambitious plans for the electrification of Irish motoring through government policy such as grants and favourable taxation since 2008, these sales are disappointing. Leaving aside the question of whether national targets for electrical vehicles are a good or bad idea, we attempt to cast light on whether electrical vehicles will succeed in gaining the level of market share specified in government objectives without further intervention. By using automobile differentiated product-level characteristics (with price one of them) and unit sales, this article estimates a demand system for the Irish automobile market. The estimated demand coefficients are then used to simulate the demand from the introduction of new electrical vehicles in the economy.
Using a Lancastrian model of demand (Lancaster (1971, 1991)), the vehicle is considered as a bundle of differentiated attributes rather than a homogeneous single product. Market shares of new electrical vehicles can be simulated by multiplying each of their characteristics (e.g. price, range, etc.) by the marginal valuation of the same or similar attributes in existing cars. One difficulty in simulating the introduction of a new model in the characteristics space is that some of its observable attributes may not have existed before. This possible limitation in the dimensions of the characteristics space makes any evaluation of the product introduction harder, for no marginal valuation is available for the innovative attributes of the innovative model. Thanks to the availability of hybrid automobiles we do not have to worry much about this issue.
Public policy may affect the uptake of electrical vehicles. The effects of different pricing scenarios on electric vehicles’ market shares are presented. The current policy whereby electrical vehicles benefit from a grant and do not incur a Vehicle Registration Tax (VRT) is taken as the base scenario. Two other scenarios are shown: one that removes the grant and
1 These EU targets are the 20-20-20 targets and include a 20% reduction in EU greenhouse gas levels on 1990
a second that both removes the grant and imposes VRT. A further possible avenue for public policy intervention is through informational advertising; that is, to raise ecological awareness through an energy efficiency campaign and thus to stimulate demand for electric vehicles indirectly. The effect of varying levels of ecological awareness on the base results is illustrated.
The paper continues as follows. Section 2 examines the existing literature in the areas of consumer vehicle choice and electric vehicles. The methodology and data used are detailed in Sections 3 and 4. The results are presented in Section 5. Section 6 provides a discussion and conclusion.
2.
Previous research on the Car Market
There has been much written on the car market and consumer choice but there is little literature specific to electrical cars. Nolan (2010) gives a recent review of research in the car ownership area.
Emissions have been the focus of a number of Irish papers relating to the car market. O'Gallachoir et al. (2009) utilise new car data from 2000 to 2006 and show how purchasing trends over this period counter the efficiency benefits of improved engine performance. The paper also examines the 2008 vehicle registration and motor tax reforms that were put in place to change these trends; it is discovered that the resultant drop in emissions is not from a shift to smaller cars but to diesel cars. Hennessy and Tol (2011) confirm these results using data over a longer time period. Analysing the impact of Irish government policy on car ownership, following the 2008 tax reforms, they note the shift from petrol to diesel cars led to a decrease in carbon emissions but an increase in car usage, due to cheaper operating costs of diesel. The net decrease in emissions is small and the government is not on track to meet emission targets. Furthermore the increasing stock and preference for larger cars suggest emissions will increase over the next 15 years.
private and social benefits. It is also emphasised that, while privately financially profitable, this does not mean electric cars are more attractive than other cars as characteristics such as acceleration, engine power, range, and battery power matter.
Another approach by Brandon et al. (2011) involves behaviour analysis in examining the adoption of electric, hydrogen fuel cells and hybrid vehicles in the UK. Car type, car size and distance driven can be regarded as behavioural variables, depending on car user choices. Policy, such as fuel and car taxation, alters car users’ choices but evidence on these influences is often incomplete. Unintended responses and rebound effects can complicate analysis and make forecasting future policy difficult.
Our paper takes into account the effect of consumers’ ecological awareness on their demand for electrical vehicles. Energy efficiency campaigns as a form of advertising have been studied and can be classified as Demand Side Management (DSM) or Market Transformation (MT) (Birner and Martinot, 2005, Blumstein et al., 2000). Birner and Martinot (2005) find that increased awareness of energy savings potential can impact markets on the supply side even before formal project implementation. Blumstein et al. (2000) point to the more technical meaning of MT that has developed, a policy objective of promoting social, technology and economic change towards greater energy efficiency. Gillingham, Newell and Palmer (2006) review DSM programmes in the United States and conclude that the most effective policies are the ones that offer incentives to buy energy-efficient durable goods.
Energy efficiency campaigns can take the form of generic advertising. Its impact is studied by Chakravarti and Janiszewski (2004), revealing that, while the goal is to increase primary demand of a product without influencing market share of any producer, often brand-level demand is affected. Brand differentiation can be strengthened or weakened by generic advertising through decreasing access to non-advertised product attributes and as such increasing price responsiveness. It is concluded that generic advertising should be used to suggest product appropriateness such as awareness advertising in immature commodity markets while concentrating on usage situation in more mature markets.
Random coefficients logit models feature in the literature and are useful in attempting to include consumer heterogeneity evident in car choice decisions. Taking the traditional logit model as a starting point, Berry, Levinsohn and Pakes (1995) are the forerunners in using a random coefficients logit model in this area. With more realistic substitution patterns this model produces higher cross price elasticities as cars become more similar. Having realistic price elasticities is important, because demand elasticities play a crucial role in policy analysis. Petrin (2002) builds on the Berry, Levinsohn and Pakes (1995) approach and augments market level data with consumer demographics. Applying this approach to the automobile market, substitution patterns reflect consumer heterogeneity and more appropriate demand elasticities are estimated. A further extension of the random coefficient logit model is undertaken by Berry, Levinsohn and Pakes (2004) where observable and unobservable individual characteristics are enriched with a dataset on second choice information. Although we recognize the potential benefits of a random coefficient model in estimating richer substitution patterns, our paper employs the simplified logit methodology suggested in Berry (1994), for our interest in the estimation does not go beyond the requirement of an unbiased estimation of the demand coefficients.
3.
Data employed
Car data used in the analysis is collected from a variety of sources. The price and unit sales are taken from the Society of Irish Motoring Industry (SIMI). SIMI compiles statistics for new vehicle purchases as well as second hand purchases. The dataset on new cars is supplemented with data on car model characteristics compiled from specialised press (mostly www.motorcheck.ie and www.carzone.ie). The electrical cars’ characteristics are taken from the manufacturers’ specifications as listed on their websites.2
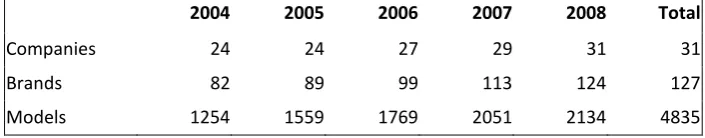
[image:5.595.87.440.628.697.2]The dataset contains 31 car companies and 127 car brands; for example Alfa Romeo is a company, 159 is a brand. Cars are considered at the model variation level; for example, Alfa Romeo 159 1.9 JTD SPORTIVO 16V 2006 is an observation. It is an unbalanced panel of 4835 car variations recorded yearly during the period 2004-2008, for a total of 9485 observations when other characteristics such as engine size and number of doors are included. Table 1, below, illustrates how the dataset is comprised at the company, brand and model variation level.
Table 1: Number of companies, brands and model variation by year
2004 2005 2006 2007 2008 Total
Companies 24 24 27 29 31 31
Brands 82 89 99 113 124 127
Models 1254 1559 1769 2051 2134 4835
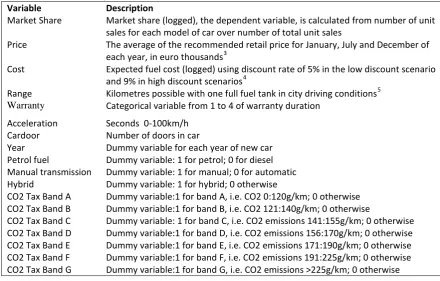
Table 2: Variable descriptions
Variable Description
Market Share Market share (logged), the dependent variable, is calculated from number of unit sales for each model of car over number of total unit sales
Price The average of the recommended retail price for January, July and December of each year, in euro thousands3
Cost Expected fuel cost (logged) using discount rate of 5% in the low discount scenario and 9% in high discount scenarios4
Range Kilometres possible with one full fuel tank in city driving conditions5
Warranty Categorical variable from 1 to 4 of warranty duration
Acceleration Seconds 0-100km/h
Cardoor Number of doors in car
Year Dummy variable for each year of new car
Petrol fuel Dummy variable: 1 for petrol; 0 for diesel Manual transmission Dummy variable: 1 for manual; 0 for automatic
Hybrid Dummy variable: 1 for hybrid; 0 otherwise
CO2 Tax Band A Dummy variable:1 for band A, i.e. CO2 0:120g/km; 0 otherwise CO2 Tax Band B Dummy variable:1 for band B, i.e. CO2 121:140g/km; 0 otherwise
CO2 Tax Band C Dummy variable: 1 for band C, i.e. CO2 emissions 141:155g/km; 0 otherwise CO2 Tax Band D Dummy variable:1 for band D, i.e. CO2 emissions 156:170g/km; 0 otherwise CO2 Tax Band E Dummy variable:1 for band E, i.e. CO2 emissions 171:190g/km; 0 otherwise CO2 Tax Band F Dummy variable:1 for band F, i.e. CO2 emissions 191:225g/km; 0 otherwise CO2 Tax Band G Dummy variable:1 for band G, i.e. CO2 emissions >225g/km; 0 otherwise
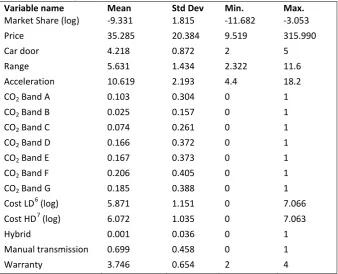
Descriptive statistics for the variables used in the paper are shown in Table 3 below. Market Share is the dependent variable and we express it in log terms. The Price variable is scaled to euro thousands. There is a broad array of prices in the dataset with the Price variable ranging from €9,500 to €316,000 per vehicle, with most of the observations clustered in the lower end. The majority of the cars included have four or five doors and have a manual transmission. There are very few hybrid cars in our dataset, as evident from the mean of the Hybrid dummy. Warranty captures the maximum mileage allowed for a car to remain in warranty; this is high for the vast majority of cars with many offering unlimited mileage warranty for a fixed time period. The CO2 band variables represent carbon emissions, with most cars in the dataset coming under CO2 Band F. This is probably driven mainly by the
prevalence of cars with relatively large engines.
3 Real price with 2011 as base year.
Table 3: Summary statistics
Variable name Mean Std Dev Min. Max.
Market Share (log) -9.331 1.815 -11.682 -3.053
Price 35.285 20.384 9.519 315.990
Car door 4.218 0.872 2 5
Range 5.631 1.434 2.322 11.6
Acceleration 10.619 2.193 4.4 18.2
CO2 Band A 0.103 0.304 0 1
CO2 Band B 0.025 0.157 0 1
CO2 Band C 0.074 0.261 0 1
CO2 Band D 0.166 0.372 0 1
CO2 Band E 0.167 0.373 0 1
CO2 Band F 0.206 0.405 0 1
CO2 Band G 0.185 0.388 0 1
Cost LD6 (log) 5.871 1.151 0 7.066
Cost HD7 (log) 6.072 1.035 0 7.063
Hybrid 0.001 0.036 0 1
Manual transmission 0.699 0.458 0 1
Warranty 3.746 0.654 2 4
The three electrical car models used for the purpose of this paper are Nissan Leaf, Mitsubishi iMiEV and Renault Fluenze Z.E. These are not included in the data described for estimation but are used later for simulating the demand for these vehicles. While displaying similar characteristics to conventional fuel cars of comparable size within the dataset, they differ notably in purchase price, range and emissions. Battery cost places them above average price relative to non electrical vehicles. Range is much lower; the average maximum of the electrical models is 170 kilometres while the mean range of the cars in the dataset is 563 kilometres. Petrol or diesel fuelled cars’ pollutants include CO2, nitrates and particulates. Emissions from electrical vehicle use are zero. Hybrid vehicles are included in the dataset. They combine internal combustion engines and electric battery power to achieve efficiencies in fuel and CO2 emissions. As such, hybrids have lower CO2 emissions than petrol vehicles of similar engine size but nevertheless higher than the non-emitting electrical cars.
4.
Estimation
This paper estimates the demand for automobiles based on a set of observable vehicle characteristics, including annual fuel costs. We first estimate demand by OLS. Then we employ a 2SLS estimator and correct for the price endogeneity induced by the correlation between unobserved automobile characteristics and price. The comparison between the OLS and 2SLS estimates gives us an idea of the estimation bias.
The dependent variable is defined as 0
ln
jtt
s
s
, the natural log of the ratio between the marketshare of the car j in year t and the share of households that do not buy a car, which we term the “outshare”, in the same year. The market share sjt is the ratio between the unit sales of
the car model variation j and the total unit sales in the market. The outside share in period t,
0t
s
, is the proportion of households who choose not to buy a new car and it is given by theratio between total unit sales in the period and the number of households in Ireland in the period.8 The procedure used to derive the demand specification with this dependent variable is detailed in Berry (1994).
Initially an OLS model is run. It can be seen that this model has explanatory power, returning significant coefficients; however, it is expected a problem of price endogeneity exists. It is likely there is at least one unobserved characteristic that proxies for quality, that is positively correlated with the price, and ignoring this will make the price estimate inconsistent. Due to the combination of positive correlation and negative price effect, it is believed the bias causes an understatement of the absolute value of the price coefficient.
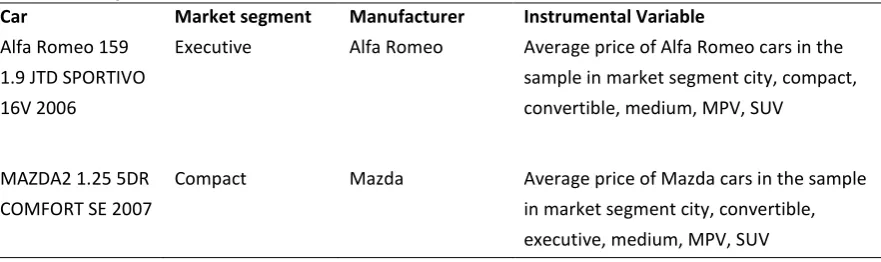
Including brand dummies, a second OLS model is run. The additional controls used should capture any brand effects that vary within brands. In addition to improving the explanatory power of the model, brand dummies are expected to reduce the price endogeneity. In order to deal with the endogeneity issue, a 2SLS estimator is used. The 2SLS estimator requires an exogenous variable to instrument price. We combine the Berry et al. (1995) instruments with the Hausman et al. (1994) instrument. The former include the sum of acceleration and fuel CO2 emissions for the subset of car models produced by the same company, as well as the sum of the fuel cost characteristic over the entire production set of the other companies. Hausman et al. (1994) suggest that the prices in one market segment are used to instrument prices in other market segments. Manufacturer specific characteristics are the same but the different market segments attract consumers with different characteristics, giving a suitable instrument. The instrument was created by first identifying the market segment of each car and, based on the manufacturer (Audi, Toyota etc.), the average price of cars marketed by the same manufacturer were calculated.9 This is illustrated in Table 4.
8 Demographic projections come from the “low growth” macroeconomic scenario in Bergin et al.
(2010).
9 Seven market segments were identified: city, compact, convertible, executive, medium, MPV, and
Table 4: Examples of the Instrumental Variable
Car Market segment Manufacturer Instrumental Variable
Alfa Romeo 159 1.9 JTD SPORTIVO 16V 2006
Executive Alfa Romeo Average price of Alfa Romeo cars in the
sample in market segment city, compact, convertible, medium, MPV, SUV
MAZDA2 1.25 5DR COMFORT SE 2007
Compact Mazda Average price of Mazda cars in the sample
in market segment city, convertible, executive, medium, MPV, SUV
Similarly to the OLS estimator, the 2SLS estimator is estimated both with and without brand dummies. We run the four estimates (two OLS and two 2SLS) with two different versions of fuel as explanatory variable. The first version includes fuel as a dummy variable (1 for petrol) while the second one incorporates the annual cost of fuel. This cost variable was constructed using the average kilometres driven per year, sourced from Sustainable Energy Authority Ireland (2011), and the estimated price of fuel, using petrol price data from Statistical Reports of the Revenue Commissioners and diesel price data from IEA Energy Prices and Taxes. The cost variable was discounted based on the expected single owner lifetime of a car. We followed the assumption in Buchanan (2000) that the average car “purchase life” is 5 years. In Buchanan’s report on motoring taxation costs, vehicle mileage is used to estimate cost in a similar fashion to this paper, except that it adds additional detail on fuel taxes. The cost variable is more relevant than a fuel dummy variable when simulating demand for electrical vehicles, as discussed later.
Since our goal in modelling car purchase demand is to simulate the demand for new electrical vehicles, particular attention is paid to including explanatory variables that the previous literature suggests to be especially relevant to electrical vehicles such as range, acceleration and carbon emissions. The simulation is done by taking the estimated coefficients of the models, presented in Section 5, and applying them to three of the electrical vehicles that are for sale in Ireland in 2012. A list of the variables used and their descriptive statistics are included in Section 4.
5.
Results
5.1 Car purchasing decision
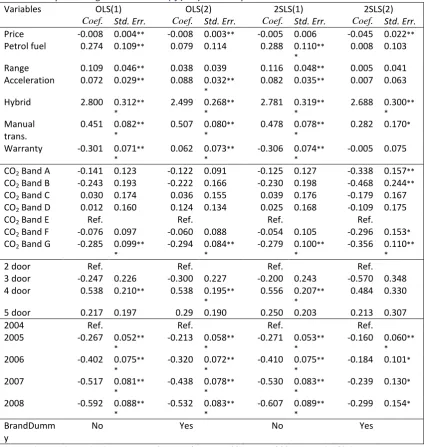
Table 5: Car purchasing decision with ln(sjt/s0t) as the dependent variable
Variables OLS(1) OLS(2) 2SLS(1) 2SLS(2)
Coef. Std. Err. Coef. Std. Err. Coef. Std. Err. Coef. Std. Err.
Price -0.008 0.004** -0.008 0.003** -0.005 0.006 -0.045 0.022**
Petrol fuel 0.274 0.109** 0.079 0.114 0.288 0.110**
* 0.008 0.103
Range 0.109 0.046** 0.038 0.039 0.116 0.048** 0.005 0.041
Acceleration 0.072 0.029** 0.088 0.032**
* 0.082 0.035** 0.007 0.063
Hybrid 2.800 0.312**
* 2.499 0.268* ** 2.781 0.319* ** 2.688 0.300* **
Manual
trans. 0.451 0.082
**
* 0.507 0.080
**
* 0.478 0.078
**
* 0.282 0.170
*
Warranty -0.301 0.071**
* 0.062 0.073* ** -0.306 0.074* ** -0.005 0.075
CO2 Band A -0.141 0.123 -0.122 0.091 -0.125 0.127 -0.338 0.157**
CO2 Band B -0.243 0.193 -0.222 0.166 -0.230 0.198 -0.468 0.244**
CO2 Band C 0.030 0.174 0.036 0.155 0.039 0.176 -0.179 0.167
CO2 Band D 0.012 0.160 0.124 0.134 0.025 0.168 -0.109 0.175
CO2 Band E Ref. Ref. Ref. Ref.
CO2 Band F -0.076 0.097 -0.060 0.088 -0.054 0.105 -0.296 0.153*
CO2 Band G -0.285 0.099**
* -0.294 0.084* ** -0.279 0.100* ** -0.356 0.110* **
2 door Ref. Ref. Ref. Ref.
3 door -0.247 0.226 -0.300 0.227 -0.200 0.243 -0.570 0.348
4 door 0.538 0.210** 0.538 0.195**
* 0.556 0.207
**
* 0.484 0.330
5 door 0.217 0.197 0.29 0.190 0.250 0.203 0.213 0.307
2004 Ref. Ref. Ref. Ref.
2005 -0.267 0.052**
* -0.213 0.058
**
* -0.271 0.053
**
* -0.160 0.060
** *
2006 -0.402 0.075**
* -0.320 0.072
**
* -0.410 0.075
**
* -0.184 0.101
*
2007 -0.517 0.081**
* -0.438 0.078
**
* -0.530 0.083
**
* -0.239 0.130
*
2008 -0.592 0.088**
* -0.532 0.083
**
* -0.607 0.089
**
* -0.299 0.154
*
BrandDumm
y No Yes No Yes
Note: Clustered standard errors. Significance: * p<0.10, ** p<0.05, *** p<0.01. ‘Ref.’ denotes reference category.
Range is an important variable to consider when examining electrical vehicles. Most such vehicles currently offered for sale have ranges lower than those available for petrol vehicles. In our historical models, where the data contain no electrical vehicles, range has a positive but small effect on market share. It is significantly different from zero in the OLS model and the 2SLS model, when the brand dummies are not included. However range loses its significance when the brand effects are controlled for. We had expected the coefficients on range to be larger. It may be that the marginal cost of supplying range in a petrol vehicle (i.e. increasing the size of the petrol tank) is not high compared to the cost of improving other attributes of the vehicle. Manufacturers may then choose the ranges of vehicles to be generous relative to the requirements of most consumers, reducing the magnitude and level of significance of the estimated coefficients.
A higher acceleration rate positively affects the car purchase decision as does a manual transmission. These coefficients are statistically significant in both the OLS models and the 2SLS model without brand control, transmission is also statistically significant in this model controlling for the brand effects. The carbon dioxide emissions variables show cars in all bands have lower demand relative to the omitted band E. This negative effect is greater for cars with very low or very high emissions. It seems likely that this pattern is not driven by consumers’ attitudes towards CO2 emissions per se, but rather by their preference for midsize cars over very large or very small cars.
The dummy variable for hybrid comes in statistically significant at the 1% level across the models, and has an extremely high magnitude suggesting that a hybrid car would increase (relative to the outside option) market share by 280% for OLS and 2SLS models without brand effects, 250% for OLS model including such effects and almost 270% for the brand controlled 2SLS model, all else equal. There are very few hybrids in the sample, just 12 car models, and the positive coefficients indicate that at least some car buyers have strong environmental motives. The data are not sufficient to show whether these motives may be extrapolated to the wider car buying public or whether they are particular to a small group.
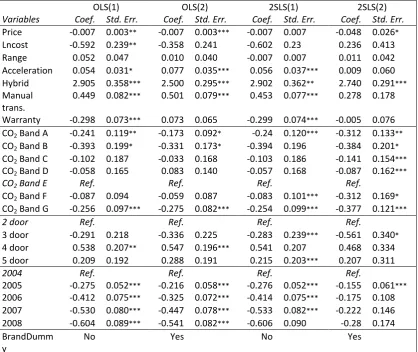
We run each of the four models a second time including Lncost, a variable capturing the expected annual fuel cost, in place of the fuel dummy variable. This gives similar results as displayed in Appendix 2. In line with expectations, higher expected lifetime fuel cost has a negative effect on consumer demand. The variable is logged therefore it can be read as an elasticity. The cost coefficient is statistically significant in the models not controlling for brand effects. The lack of significance when brand dummies are controlled for may be due to some degree of multicollinearity between brand dummies and running cost.
Table 6: Car purchasing decision with annual fuel cost included
OLS(1) OLS(2) 2SLS(1) 2SLS(2)
Variables Coef. Std. Err. Coef. Std. Err. Coef. Std. Err. Coef. Std. Err.
Price -0.007 0.003** -0.007 0.003*** -0.007 0.007 -0.048 0.026*
Lncost -0.592 0.239** -0.358 0.241 -0.602 0.23 0.236 0.413
Range 0.052 0.047 0.010 0.040 -0.007 0.007 0.011 0.042
Acceleration 0.054 0.031* 0.077 0.035*** 0.056 0.037*** 0.009 0.060
Hybrid 2.905 0.358*** 2.500 0.295*** 2.902 0.362** 2.740 0.291***
Manual
trans. 0.449 0.082
*** 0.501 0.079*** 0.453 0.077*** 0.278 0.178
Warranty -0.298 0.073*** 0.073 0.065 -0.299 0.074*** -0.005 0.076
CO2 Band A -0.241 0.119** -0.173 0.092* -0.24 0.120*** -0.312 0.133**
CO2 Band B -0.393 0.199* -0.331 0.173* -0.394 0.196 -0.384 0.201*
CO2 Band C -0.102 0.187 -0.033 0.168 -0.103 0.186 -0.141 0.154***
CO2 Band D -0.058 0.165 0.083 0.140 -0.057 0.168 -0.087 0.162***
CO2 Band E Ref. Ref. Ref. Ref.
CO2 Band F -0.087 0.094 -0.059 0.087 -0.083 0.101*** -0.312 0.169*
CO2 Band G -0.256 0.097*** -0.275 0.082*** -0.254 0.099*** -0.377 0.121***
2 door Ref. Ref. Ref. Ref.
3 door -0.291 0.218 -0.336 0.225 -0.283 0.239*** -0.561 0.340*
4 door 0.538 0.207** 0.547 0.196*** 0.541 0.207 0.468 0.334
5 door 0.209 0.192 0.288 0.191 0.215 0.203*** 0.207 0.311
2004 Ref. Ref. Ref. Ref.
2005 -0.275 0.052*** -0.216 0.058*** -0.276 0.052*** -0.155 0.061***
2006 -0.412 0.075*** -0.325 0.072*** -0.414 0.075*** -0.175 0.108
2007 -0.530 0.080*** -0.447 0.078*** -0.533 0.082*** -0.222 0.146
2008 -0.604 0.089*** -0.541 0.082*** -0.606 0.090 -0.28 0.174
BrandDumm
y No Yes No Yes
Note: Clustered standard errors. Significance: * p<0.10, ** p<0.05, *** p<0.01. ‘Ref.’ denotes reference categories.
We now turn to the results from the 2SLS model using the cost variable. We focus on the annual cost as it is more appropriate than fuel type for simulating demand for electrical vehicles.
As expected market share decreases as price rises; it is statistically significant at the 10% level. All else equal, a thousand euro price increase would (relative to the outside option) lower market share by 4.8%. The annual fuel cost has an unexpected positive sign but is not statistically significant. Range has a small coefficient of 0.011 and is not statistically significant.
they are picking up ‘inverted U-shaped’ preferences for car size. Midsize cars are preferred to very small or very large cars.10
5.2 Simulating demand for Electrical Vehicles
Demand for electrical vehicles is simulated using the results shown in Table 6 above and presented in full in Appendix 2. This model is more appropriate for simulating electric vehicle market shares because it includes a continuous variable for fuel cost rather than a dummy variable for the fuel used. The fuel dummy variable is not sensible in examining demand for electrical vehicles as they fit into neither petrol nor diesel category. By including the cost variable we can examine the cost of running an electrical car as a determinant of the consumer purchase decision. Furthermore using the 2SLS model the issue of endogeneity is addressed. The magnitude of the price variable is slightly larger in this model compared to the others discussed in this paper. We simulate demand in three different scenarios using the characteristics of three different electrical vehicles that are available on the Irish market in 2012:
Scenario 1: Current recommended retail price (RRP) which includes a €5000 government grant and an exemption from Vehicle Registration Tax (VRT)
Scenario 2: We remove the €5000 government grant
Scenario 3: We remove the €5000 government grant and impose VRT.
In our simulations we implicitly assume that the new electrical cars do not displace existing vehicles and the prices of existing cars are unaffected by the entry of this new type of cars. By imposing this form of entry we avoid having to estimate a simultaneous equations model as in Berry Levinsohn and Pakes (1995), Nevo (2001) and Petrin (2002) or a demand equation model with a pricing equation derived from the equilibrium assumption. Electrical cars enter the market with their own sets of attributes, and based on the marginal valuations estimated for existing models we are able to predict their market shares at the expense of existing models. The competition from the new electrical cars is modelled entirely in the inside market.
10 The size distribution of car supply matches the size distribution of car demand. What is referred to as a
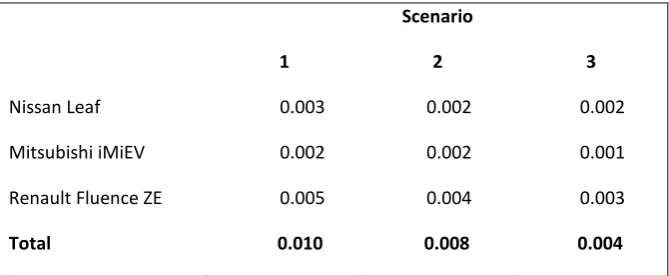
Table 7: Simulated Market Share of Electrical Vehicles
Scenario
1 2 3
Nissan Leaf 0.003 0.002 0.002
Mitsubishi iMiEV 0.002 0.002 0.001
Renault Fluence ZE 0.005 0.004 0.003
Total 0.010 0.008 0.004
Table 7 illustrates demand for electrical vehicles simulated under three different pricing scenarios. Market shares are very low; electrical vehicles would garner just 1% of all new cars sold under the current pricing scenario. As public subsidies are reduced and removed, therefore raising prices, the demand lessens further. Although the simulated market shares here are close to those of individual models of some conventional cars they are low relative to government targets to reach a total car stock comprised of 10% of electrical vehicles by 2020. The slow uptake by consumers is not unusual for new technology on the market. Shepherd et al. (2012) point to the importance of word of mouth in new technology uptake and specifically conclude that more research into awareness campaigns and marketing of electrical vehicles would be useful.
Raising Ecological Awareness
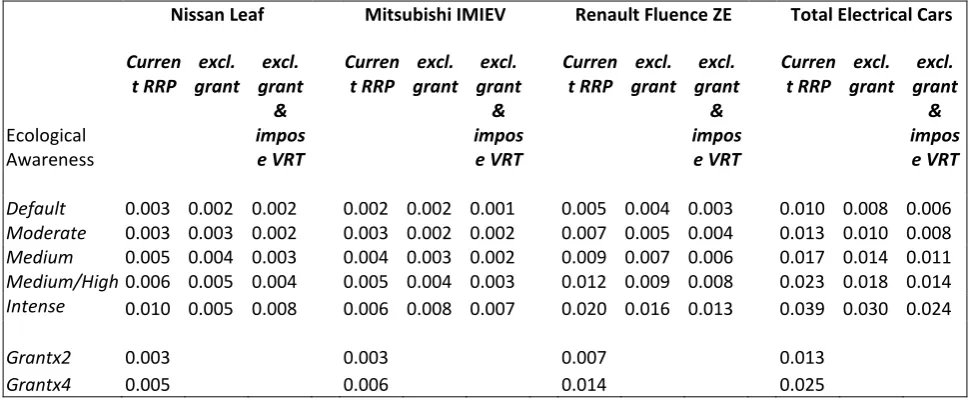
Electrical vehicle sales may be boosted by raising ecological awareness and appealing to environmental motives of potential buyers. The model of the demand for automobiles contains a dummy variable for hybrid vehicles. This may capture buyers’ desire for an environmentally friendly car. In Table 7 we therefore assumed that this dummy applies to all-electric vehicles as well. However, all-electric cars are greener than hybrid cars. To see how sensitive the results are to the strength of this effect, we arbitrarily increase the dummy. In addition to the default level, four further levels are examined; moderate, medium, medium/high and intense, increasing the dummy by 10, 20, 30 and 50 per cent respectively. These simulations are presented in Figure 1 and Table 8.
Figure 1: Simulated Market Share of Electrical Vehicles; Three Pricing Scenarios, 5 Ecological Awareness Levels, Increased Grant
Increasing Subsidy
[image:16.595.87.573.521.722.2]Electrical vehicle sales are encouraged through the government grant previously outlined. Table 8 shows our assumptions of subsidies; double and quadruple the current level. With the extremely large subsidies total demand remains low, 2.5 per cent for a grant of €20,000. Further simulation shows that a €50,000 subsidy would be needed to bring the total demand to the 10% government target of market penetration.
Table 8: Simulated Market Share of Electrical Vehicles; Three Pricing Scenarios, 5 Ecological Awareness Levels, Increased Grant
Nissan Leaf Mitsubishi IMIEV Renault Fluence ZE Total Electrical Cars
Ecological Awareness
Curren
t RRP grant excl. grant excl. & impos e VRT
Curren
t RRP grant excl. grant excl. & impos e VRT
Curren
t RRP grant excl. grant excl. & impos e VRT
Curren
t RRP grant excl. grant excl. & impos e VRT
Default 0.003 0.002 0.002 0.002 0.002 0.001 0.005 0.004 0.003 0.010 0.008 0.006
Moderate 0.003 0.003 0.002 0.003 0.002 0.002 0.007 0.005 0.004 0.013 0.010 0.008
Medium 0.005 0.004 0.003 0.004 0.003 0.002 0.009 0.007 0.006 0.017 0.014 0.011
Medium/High 0.006 0.005 0.004 0.005 0.004 0.003 0.012 0.009 0.008 0.023 0.018 0.014
Intense 0.010 0.005 0.008 0.006 0.008 0.007 0.020 0.016 0.013 0.039 0.030 0.024
Grantx2 0.003 0.003 0.007 0.013
Grantx4 0.005 0.006 0.014 0.025
S1
S1
S1
S1
S1
Grant*2 Grant*4 S2 S2 S2 S2 S2 S3 S3 S3 S3 S3 0 0.005 0.01 0.015 0.02 0.025 0.03 0.035 0.04 M arke t S ha re Ecological Awareness
Renault Fluence ZE Mitsubishi IMIEV Nissan Leaf
6.
Conclusions
We have modelled the market for new cars in Ireland with the aim of estimating the values placed on a range of car characteristics. The values of car characteristics are then used to simulate the likely market shares of three new electrical vehicles for which characteristics have been published. The electrical vehicles modelled here have much lower range than comparable petrol vehicles, but because range is assigned a low marginal (and often insignificant value in the existing market), this factor has little effect on their predicted market shares. Electrical vehicles also tend to be more expensive even after tax breaks and subsidies are applied, but we assume their market shares would benefit from an “environmental” premium. The level of this premium is assumed to be the same as the market share uplift currently enjoyed by hybrid cars.
The net effect of applying these characteristics leads to simulated market shares that are broadly in line with individual models of fossil fuelled cars. Strengthening or weakening electrical vehicle subsidies has a relatively limited impact on predicted market shares due to the modest price coefficients in the model. Even with subsidies in place, however, the market shares are very low relative to government targets for electrical vehicle penetration, because these targets are defined in terms of the stock of vehicles. It would take extremely high new car penetration rates for the share of the total car stock made up of electrical vehicles to reach 10% by 2020.
However, there are also reasons to think that market shares might be higher in practice. Electrical vehicles will benefit from government information and advertising campaigns on environmental benefits and energy efficiency. Arbitrarily increasing the hybrid premium, so it becomes an electrical vehicle premium, increases total demand for electrical vehicles. However, even large increases are not enough to reach government targets for market penetration. Assuming higher subsidy levels shows the same effect: increased demand but still remaining too low to meet government targets. Our simulation shows a subsidy greater than the current RRP is needed to reach these targets.
Furthermore the simulations are based on the marginal valuations as estimated before the introduction of the electrical cars. We rely on the assumption that apart from ecological awareness, all other marginal valuations (preferences) will remain unchanged; that is, the experience of owning and using electric cars will not be so different from petrol cars as to produce a structural change in consumer preferences.
Acknowledgements
Hugh Hennessy helped collect data and estimate models. We are grateful for funding under the EPA Strive Programme. The usual disclaimer applies.
References
Axsen, J., Jaccard, M., Mountain, D.C., 2009. Combining stated and revealed choice research to simulate the neighbor effect: The case of hybrid-electric vehicles. Resource and Energy Economics 31, 221–238.
Bergin, A., Conefrey, T., Fitzgerald, J., Kearney, I., 2010. Recovery Scenarios for Ireland: An Update. In ESRI Quarterly Economic Commentary, Summer.
Berry, S., 1994. Estimating discrete choice models of product differentiation. Rand Journal of Economics 25 (2), 242-262.
Berry, S., Levinsohn, J., Pakes, A., 1995. Automobile prices in market equilibrium. Econometrica 63 (4), 841-890.
Berry, S., Levinsohn, J., Pakes, A., 2004. Automobile prices in market equilibrium.” Journal of Political Economy 112 (1), 68–105.
Birner, S., Martinot, E., 2005. Promoting energy-efficient products: GEF experience and lessons for market transformation in developing countries. Energy Policy 33, 1765-1779.
Blumstein, C., Goldstone, S., Lutzenhiser, L., 2000. A theory based approach to market transformation. Energy Policy 28, 137-144.
Brandon, N.P., Clague, R., Contestabile, M., Offer, G.J., 2011, Techno-economic and behavioural analysis of battery electric, hydrogen fuel cell and hybrid vehicles in a future sustainable road transport system in the UK. Energy Policy 39,1939-1950.
Brownstone, D. Train, K., 1999. Forecasting new product penetration with flexible substitution patterns. Journal of Econometrics 89 (1-2), 109-129.
Calef, D. Goble, R., 2007. The allure of technology: how France and California promoted electric and hybrid vehicles to reduce urban air pollution. Policy Sciences 40 (1), 1-34.
Buchanan, C., 2000. Comparison of Motoring Taxation Costs Across Europe Final Report. Report No. 52781, Edinburgh.
Carlsson, F. Johansson-Stenman, O., 2003. Costs and benefits of electric vehicles: a 2010 perspective. Journal of Transport Economics and Policy 37 (1),1-28.
Chakravarti, A., Janiszewski, C., 2004. The influence of generic advertising on brand preference. Journal of Consumer Research 30 (March), 487-502.
Model: case study in Bangkok Metropolitan Region. Journal of Transport Geography 18, 402–410.
EU Climate and Energy Package and the Renewable Energy Directive (ec) 2009/28/EC
Gillingham, K., Newell, R., Palmer, K., 2006. Energy efficiency policies: A retrospective examination. Annual Review of Environment and Resources 31, 161-192.
Hausman, J., Leonard, G., Zona, J. D., 1994. Competitive Analysis with Differentiated Products. Annales d’Economie et de Statistique 34, 159–180.
Hennessy, H., Tol, R., 2011. The impact of government policy on private car ownership in Ireland. The Economic and Social Review 42 (2), 135-157.
Lancaster, K., 1971. Consumer demand: a new approach”, Columbia University Press New York. Lancaster, K., 1991. Modern consumer theory, Elgar.
Mandell, S., 2009. Policies towards a more efficient car fleet. Energy Policy 37 (12), 5184-5191. Morgenroth, E., 2011. How can we improve evaluation methods for public infrastructure? ESRI
Renewal Series, November, 2011.
Nevo, A., 2001, Measuring market power in the ready-to-eat cereal industry. Econometrica 69, 307–342.
Nolan, A., 2010. A dynamic analysis of household car ownership. Transportation Research Part A: Policy and Practice 44 (6), 446-455.
O’Gallachoir, B., Howley, M., Cunningham, S., Bazilian, M., 2009. How private car purchasing trends offset efficiency gains and the successful energy policy response. Energy Policy 37 (10), 3790-3802.
Petrin, A., 2002. Quantifying the benefits of new products: the case of the minivan. Journal of Political Economy 110 (4), 705-729.
Shepherd, S., Bonsall, P., Harrison, G., 2012. Factors affecting future demand for electric vehicles: A model based study. Transport Policy 20, 62–74.
Sustainable Energy Authority Ireland. 2011 “Average Fuel Consumption and Distance Travelled for Private Cars” [online], available:
Appendix 1: Car purchasing decision with ln(sjt/s0t) as the dependent variable
Variables OLS(1) OLS(2) 2SLS(1) 2SLS(2)
Coef. Std. Err. Coef. Std. Err. Coef. Std. Err. Coef. Std. Err.
Price -0.008 0.004** -0.008 0.003** -0.005 0.006 -0.045 0.022**
Fuel 0.274 0.109** 0.079 0.114 0.288 0.110*** 0.008 0.103
Range 0.109 0.046** 0.038 0.039*** 0.116 0.048** 0.005 0.041 Acceleration 0.072 0.029** 0.088 0.032*** 0.082 0.035** 0.007 0.063 Hybrid 2.800 0.312*** 2.499 0.268*** 2.781 0.319*** 2.688 0.300*** Transmission 0.451 0.082*** 0.507 0.080*** 0.478 0.078*** 0.282 0.170* Warranty -0.301 0.071*** 0.062 0.073*** -0.306 0.074*** -0.005 0.075 CO2 Band A -0.141 0.123 -0.122 0.091 -0.125 0.127 -0.338 0.157**
CO2 Band B -0.243 0.193 -0.222 0.166 -0.230 0.198 -0.468 0.244**
CO2 Band C 0.030 0.174 0.036 0.155 0.039 0.176 -0.179 0.167
CO2 Band D 0.012 0.160 0.124 0.134 0.025 0.168 -0.109 0.175
CO2 Band F -0.076 0.097 -0.060 0.088 -0.054 0.105 -0.296 0.153*
CO2 Band G -0.285 0.099*** -0.294 0.084*** -0.279 0.100*** -0.356 0.110***
3 door -0.247 0.226 -0.300 0.227 -0.200 0.243 -0.570 0.348
4 door 0.538 0.210** 0.538 0.195*** 0.556 0.207*** 0.484 0.330
5 door 0.217 0.197 0.29 0.190 0.250 0.203 0.213 0.307
2005 -0.267 0.052*** -0.213 0.058*** -0.271 0.053*** -0.160 0.060*** 2006 -0.402 0.075*** -0.320 0.072*** -0.410 0.075*** -0.184 0.101* 2007 -0.517 0.081*** -0.438 0.078*** -0.530 0.083*** -0.239 0.130* 2008 -0.592 0.088*** -0.532 0.083*** -0.607 0.089*** -0.299 0.154*
Audi 0.731 0.093*** 1.102
-0.323***
BMW 1.035 0.128*** 1.716
-0.502***
Chevrolet 1.598 0.160*** 0.976 -0.39***
Chrysler 1.125 0.166*** 1.211 0.150***
Citroen 0.399 0.159** 0.294 0.176*
Daihatsu 1.132 0.242*** 0.585 0.431
Dodge 1.156 0.249*** 0.805 0.213***
Fiat 1.297 0.174*** 1.001 0.229***
Ford 1.043 0.128*** 0.921 0.138***
Honda 2.053 0.237*** 1.914 0.242***
Hyundai 3.842 0.419*** 3.451 0.546***
Jaguar 1.092 0.185*** 2.933 1.109***
Kia 2.248 0.140*** 1.772 0.316***
Land Rover 2.713 0.179*** 2.998 0.257***
Lexus 2.202 0.166*** 2.492 0.243***
Mazda 1.418 0.315*** 1.129 0.279***
Mercedes 1.401 0.189*** 2.040 0.604***
Mitsubishi 1.343 0.235*** 0.993 0.347***
Nissan 1.632 0.219*** 1.258 0.263***
Opel 0.832 0.178*** 0.723 0.187***
Peugeot 0.667 0.231*** 0.277 0.328
Renault 1.487 0.152*** 1.263 0.188***
Saab 0.311 0.074*** 0.536 0.166***
Seat 1.349 0.192*** 1.004 0.267***
Skoda 0.386 0.199* -0.065 0.325
Subaru 1.308 0.233*** 0.900 0.305***
Suzuki 2.695 0.192*** 2.121 0.389***
Toyota 1.870 0.141*** 1.642 0.208***
Volkswagen 1.024 0.222*** 0.926 0.181***
Volvo 0.498 0.111*** 0.871 0.261***
R-squared 0.112 0.157 0.112 0.094
Observations 9485 9485 9485 9485
Appendix 2: Car purchasing decision with annual fuel cost included
OLS(1) OLS(2) 2SLS(1) 2SLS(2)
Variables Coef. Std. Err. Coef. Std. Err. Coef. Std. Err. Coef. Std. Err.
Price -0.007 0.003** -0.007 0.003*** -0.007 0.007 -0.048 0.026*
Lncost -0.592 0.239** -0.358 0.241 -0.602 0.23 0.236 0.413
Range 0.052 0.047 0.010 0.040 -0.007 0.007 0.011 0.042
Acceleration 0.054 0.031* 0.077 0.035*** 0.056 0.037*** 0.009 0.060 Hybrid 2.905 0.358*** 2.500 0.295*** 2.902 0.362** 2.74 0.291*** Transmission 0.449 0.082*** 0.501 0.079*** 0.453 0.077*** 0.278 0.178 Warranty -0.298 0.073*** 0.073 0.065 -0.299 0.074*** -0.005 0.076 CO2 Band A -0.241 0.119** -0.173 0.092* -0.24 0.12*** -0.312 0.133** CO2 Band B -0.393 0.199* -0.331 0.173* -0.394 0.196 -0.384 0.201* CO2 Band C -0.102 0.187 -0.033 0.168 -0.103 0.186 -0.141 0.154*** CO2 Band D -0.058 0.165 0.083 0.140 -0.057 0.168 -0.087 0.162*** CO2 Band F -0.087 0.094 -0.059 0.087 -0.083 0.101*** -0.312 0.169* CO2 Band G -0.256 0.097*** -0.275 0.082*** -0.254 0.099*** -0.377 0.121*** 3 door -0.291 0.218 -0.336 0.225 -0.283 0.239*** -0.561 0.340* 4 door 0.538 0.207** 0.547 0.196*** 0.541 0.207 0.468 0.334
5 door 0.209 0.192 0.288 0.191 0.215 0.203*** 0.207 0.311
2005 -0.275 0.052*** -0.216 0.058*** -0.276 0.052*** -0.155 0.061*** 2006 -0.412 0.075*** -0.325 0.072*** -0.414 0.075*** -0.175 0.108 2007 -0.530 0.08*** -0.447 0.078*** -0.533 0.082*** -0.222 0.146 2008 -0.604 0.089*** -0.541 0.082*** -0.606 0.090 -0.28 0.174
Audi 0.744 0.091*** 1.101 0.332***
BMW 1.022 0.119*** 1.743 0.564***
Chevrolet 1.575 0.148*** 0.984 0.405**
Chrysler 1.200 0.163*** 1.186 0.151***
Citroen 0.418 0.16*** 0.27 0.198
Daihatsu 1.106 0.278*** 0.596 0.415
Dodge 1.166 0.219*** 0.739 0.270***
Fiat 1.268 0.162*** 1.029 0.219***
Ford 1.062 0.120*** 0.891 0.18***
Honda 2.076 0.219*** 1.919 0.236***
Hyundai 3.915 0.447*** 3.357 0.579***
Jaguar 1.047 0.178*** 3.051 1.283**
Kia 2.213 0.151*** 1.773 0.326***
Land Rover 2.788 0.186*** 2.954 0.243***
Lexus 2.199 0.158*** 2.531 0.283***
Mazda 1.442 0.309*** 1.119 0.284***
Mercedes 1.380 0.189*** 2.081 0.656***
Mitsubishi 1.318 0.245*** 1.024 0.329***
Nissan 1.622 0.199*** 1.264 0.272***
Opel 0.837 0.178*** 0.712 0.198***
Peugeot 0.699 0.214*** 0.256 0.358
Renault 1.513 0.133*** 1.255 0.203***
Saab 0.291 0.043*** 0.525 0.165***
Seat 1.325 0.184*** 0.989 0.291***
Skoda 0.349 0.219 -0.073 0.325
Subaru 1.375 0.241*** 0.804 0.405**
Suzuki 2.669 0.174*** 2.133 0.395***
Toyota 1.880 0.132*** 1.647 0.204***
Volkswagen 1.043 0.219*** 0.891 0.200***
Volvo 0.540 0.115*** 0.836 0.246***
R-squared 0.112 0.158 0.112 0.085
Observations 9485 9485 9485 9485
22
Year Number Title/Author(s) ESRI Authors/Co-authors Italicised
2012
436 The Costs of Working in Ireland
Niamh Crilly, Anne Pentecost and Richard S.J. Tol
435 Choice, Price and Service Characteristics in the Irish Broadband Market Seán Lyons and Michael Savage
434 International Migration in Ireland, 2011
Philip J. O’Connell, Corona Joyce and Mairéad Finn
433 The Potential for Segmentation of the Retail Market for Electricity in Ireland
Marie Hyland, Eimear Leahy and Richard S.J. Tol
432 Timing and Determinants of Local Residential Broadband Adoption: Evidence from Ireland
Seán Lyons
431 Obesity and Employment in Ireland: Moving Beyond BMI Irene Mosca
430 Offshoring, Inward Investment and Export Performance in Ireland Frank Barry and Adele Bergin
429 The Long Term Health Effects of Education Vincent O Sullivan
428 Should Coal Replace Coal? Options for the Irish Electricity Market Seán Diffney, Laura Malaguzzi Valeria and Darragh Walsh
427 Competition Policy in Ireland: A Good Recession? Paul K. Gorecki
426 Socioeconomic Distribution of Emissions and Resource Use in Ireland
Seán Lyons, Anne Pentecost and Richard S.J. Tol
425 Behavioural Economics and Policymaking: Learning from the Early Adopters
Pete Lunn
424 The ESRI Energy Model
Valeria Di Cosmo, Marie Hyland For earlier Working Papers see