Phare Ex post Evaluation. Phase 1, Multi-Beneficiary Programmes: Small and Medium-Sized Enterprise Finance Facility
Small and Medium-Sized
Enterprise Finance Facility
October 2007
The views expressed are those of the MWH Consortium and do not necessarily reflect those of the European Commission.
This report has been prepared as a result of an independent evaluation by the MWH Consortium contracted under the Phare programme.
EUROPEAN COMMISSION
DG
E
NL A RGEM E NTE
VALUATIONU
N I TTABLE OF CONTENTS
GLOSSARY OF ACRONYMS
GLOSSARY OF TERMS USED
PREFACE
EXECUTIVE SUMMARY
MAIN REPORT ...1
1. INTRODUCTION ...1
1.1 Objectives ...1
1.2 Background and Context...1
1.3 Evaluation Methodology...3
2. PERFORMANCE OF THE FACILITY ...6
2.1 Grant support to the Facility was highly relevant for the first years, but its relevance declined over time...6
2.2 Outputs were delivered effectively by the IFIs, and benefits from grant support were obtained in early stages, but these diminished over time...10
2.3 TA delivered immediate impacts, but intermediate and wider impacts of the Facility were limited. ...15
2.4 Long-term sustainability of the Facility assistance is marginal ...22
3. THEMATIC/ CROSSCUTTING FINDINGS ...24
3.1 Catalytic effects of the grant support to the Facility diminished over time ...24
3.2 Additionality in line with the Phare definition has also declined over time...24
3.3 Little linkage or complementarity with other support measures for SMEs...26
3.4 Multi-country programme delivery has been appropriate but the absence of a tailor-made approach constrained benefits. ...27
4. CONCLUSIONS AND RECOMMENDATIONS...28
4.1 Conclusions...28
4.2 Recommendations...30
ANNEXES...32
Annex 1. Terms of Reference...33
Annex 2. Evaluation Plan...38
Annex 3. Follow-Up to Recommendations of Previous Report ...44
Annex 4. List of Participating Financial Institutions Interviewed...47
Annex 5. Questionnaire...48
Annex 6. Note on Interview Methodology...51
Annex 7. Reconstructed Intervention Logic for the Facility ...53
Annex 8. Overview of the Facility Objectives 1999-2005 ...54
Annex 9. Overview of the Facility Operations 1999-2005...57
Annex 10. Achievement of Immediate Objectives 1999-2005 ...66
Annex 11. List of Interviews...69
Annex 12. List of Documents Consulted ...77
GLOSSARY OF ACRONYMS
Acronym Description
CA Contribution Agreement
CCs Candidate Countries
CEB Council of Europe Development Bank
CEB/KfW CEB in cooperation with KfW (see below) CEEC Countries of Central and Eastern European
DIS Decentralised Implementation System
EBRD European Bank for Reconstruction and Development
EC European Commission
ERC* Exchange Risk Cover
EIB European Investment Bank
EU European Union
€ Euro
EW* Equity Window
FC Framework Contractor
FDI Foreign Direct Investment
FI Financial Intermediary
FM Financing Memorandum
FP Financing Proposal
FSL Fee for Smaller Loan
IE Interim Evaluation
IF Investment Fund
IFI International Financial Institution IPA Instrument for Pre-accession Assistance
IRC* Interest Rate Cap
JOP Joint Venture Phare Programme
K€ Thousands of euro
KfW Kreditanstalt für Wiederaufbau
LA Leasing Agreement
LG* Loan Guarantee
LGLW Loan Guarantee and Leasing Window
LTTE Long Term Technical Expert
M€ Millions of Euro
MBP Multi-Beneficiary Programme
MCF Management Cost Funding
MEDA Mediterranean Economic and Development Assistance
PFee* Performance Fee
PFI Participating Financial Institution
RSW* Rural Sub-Window
SME Small and Medium-sized Enterprise
SMEFF Small and Medium-sized Enterprise Finance Facility
TA* Technical Assistance
TF* Transaction Fee
ToR Terms of Reference
GLOSSARY OF TERMS USED
Term Description Exchange Risk
Cover The objective of the ‘exchange risk cover’ instrument is to enhance long-term lending in domestic currency to clients/enterprises with little/no foreign currency income and who prefer to loans in local currencies. The ERC is used to: a) cover the price of foreign exchange forward transactions that the PFI arranges to hedge the foreign exchange risks related to payments the PFI makes to the sponsor international financial institution (IFI); b) indemnify the PFI for foreign exchange losses (devaluation of local currency against the € in comparison with the exchange rates that are used for the conversion of the disbursed loan amounts into local currency) incurred with respect to the payments by the PFI to the sponsor IFI.
Equity Window The objective of the Equity Window is to provide support for self-sustainable small and medium-sized enterprise (SME) Investment Funds. Support through the Equity Window is not invested directly into SMEs but into Investment Funds operating in the participating countries that are specifically designed to take equity investments in SMEs. The Funds supported by the Facility are managed by independent fund managers. These Funds may be either new Funds set up for the purpose of SME investment or existing Funds, which open a dedicated operation for SMEs. The Funds may cover a region within one country, a whole country or several countries and each Fund is structured individually to match market conditions in the applicant country concerned as well as best international business practice for investment funds. Two components are offered through the Equity Window: 1) Equity Co-Investment funding. Phare takes equity participations alongside EBRD and other investors on the following basis: i) with regard to rewards, Phare funds will participate in profits when other investors have received a minimum return (hurdle rate) which shall be negotiated on a case by case basis; ii) with regard to losses, the basic principle is equal sharing. However, in exceptional circumstances to be justified, Phare may accept a higher proportion of losses on its contribution as compared with other investors; 2) Management Cost funding. Phare funds are used to cover costs of the Investment Fund on a grant basis and are specified within the project agreement signed between the sponsor IFI (EBRD) and the Investment Fund.
Fee for Smaller
Loan The objective of the Fee for Smaller Loan (FSL) is to stimulate the PFI to expand its lending of smaller loan amounts. The FSL covers part of the lending cost, thus increasing the attractiveness and profitability of this business. The size of loan/lease which can attract a FSL is agreed between the sponsor IFI (CEB-KfW) and the PFI and can be up to €50,000. In the case of leases, the FSL can be used to reduce the down payment payable by the SME.
Interest Rate Cap The interest rate cap applies to floating interest rates and sets an upper limit for interest rate increases. It primarily reduces the interest rate risk of the participating financial institution. Leasing Window The Leasing Window was introduced in 2001 to further support the access of SMEs to small and micro credit. Leasing is seen as an effective mechanism for financing SMEs which may not qualify for bank lending, but which may qualify for a financial lease, due to the different status of the security. In the case of financial leases, transfer of ownership of the asset to the lessee (the SME) at the end of the lease corresponds to a form of long-term finance to the SME. Through the Leasing Window, the Commission aimed to promote the development of leasing mechanisms through grant support to eligible leasing companies. Loan Guarantee Where appropriate, a partial first-loss guarantee may be provided on the SME sub-loan
Micro loan Micro loans are defined within the Facility as loans of up to K€30 (in the case of EBRD) and K€ 50 in the case of EIB and CEB/KfW.
Performance-Based Incentives
Performance-based incentives are paid to the PFI based on compliance with certain performance criteria as set out in the project proposals. These vary between performance criteria related to the quality of the lending - in the case of EBRD loans (i.e. less than 5% arrears rate over 60-days, calculated as portfolio at risk on the volume of outstanding loans to SME borrowers funded by the Facility). In the case of CEB/KfW, the criteria for draw-down of the performance fee relate to the achievement of certain policy objectives. For example, in the case of the Rural Sub-Window, the eligible loans must be to SMEs in rural zones or farmers with less than 100 full-time employees (or the equivalent number of part-time employees).
Performance Fee The Performance Fee is a fee paid to the PFI to compensate for the special risks and administrative burden involved in lending to SMEs. The payment period starts with the signing of the credit line with the IFI and is conditional on the PFI meeting certain performance criteria, as set out in the project proposal, for example loan size and/or quality of the lending (i.e. less than 5% arrears rate over 60-days, calculated as portfolio at risk on the volume of outstanding loans to SME borrowers funded by the Facility).
Project This is a financial package with a PFI comprising the IFI credit line and one or more incentives according to the specific arrangement: transaction fee, technical co-operation, guarantee etc.
Risk-Based
Incentives Risk-based incentives aim to assist the PFI to manage the increased risks associated with lending to SMEs, and include Loan Guarantees, Exchange Risk Cover and the Interest Rate Cap.
Rural Sub-Window
The Rural Sub-Window (RSW) was introduced in 2003 as part of the Loan, Guarantee and Leasing Window. The RSW aims at strengthening the financial sector’s capacity to increase access to finance for farmers and rural businesses and had the following aims: to help financial intermediaries to provide appropriately structured, including long-term financing to rural businesses; to help financial intermediaries develop a clear strategy to support the rural economy; to help financial intermediaries adapt products and risk assessment procedures to circumstances of the rural economy and thereby make available credit financing to rural businesses at more affordable rates and to improve services of financial intermediaries towards rural sector borrowers. Beneficiaries of the RSW beneficiaries are: 1) Farmers (i.e. “registered agricultural producers” and; 2) Rural Businesses (i.e. businesses located in rural zones). The indicators used to define an eligible rural zone are based on criteria such as population density or location and in line with definitions under the national legislation.
Small loan Small loans are defined within the Facility as loans of up to K€250 (with a voluntary cap at K€ 125 in the case of EBRD).
Sub-Project Sub-loans or leases to, or investments in, individual SMEs made by the PFI according to rules and conditions set down in the project agreement signed with the sponsor IFI. Technical
Assistance Technical Assistance (TA) is defined as help provided specifically for institutional development, strengthening and capacity building, usually in terms of advice, guidance, studies, training, information, know how, and similar actions. TA ‘packages’ are designed in line with the needs of the beneficiary and are delivered by private sector consultancy companies.
PREFACE
This ex post evaluation report has been prepared by the MWH Consortium1 during the period
January-March 2006, and reflects the situation at 31 May 2006. It examines the performance of the programmes in addressing the objectives stated in the formal programming documents, provides a general assessment of the programmes and draws conclusions and lessons learnt from them.
The evaluation is based on analysis of documents provided by the Commission Services and the participating international financial institutions, as well as interviews with, and questionnaires to, participating banks, financial intermediaries and leasing companies in the new EU member states, Bulgaria and Romania.
1 The Report was prepared by Lead Evaluator, Elizabeth Cunningham and Short-term International Expert, Harvey Susser. It
EXECUTIVE SUMMARY
Small and Medium-Sized Enterprise Finance Facility Scope and Objectives
The overall objective of this ex post evaluation is to provide accountability with respect to the
use of European Commission funds, and lessons learned for decision making on improvements to the Small and Medium-Sized Enterprise Finance Facility (the Facility) for remaining and future candidate countries. The purpose of the evaluation is to review 1999-2001 Facility programmes as well as the design and performance of the Phare allocations in the 2002-2005 period.2
Key Evaluation Findings
The Facility has been implemented effectively by the participating International Financial Institutions. In the period under review,€M 323 of Phare grant support was matched by €2.2 billion in credit lines from the participating institutions; the European Bank for Reconstruction and Development (EBRD), the European Investment Bank (EIB) and the Council of Europe Development Bank (CEB) in partnership with Kreditanstalt für Wiederaufbau (KfW). Over
74,000 loans and leases to small businesses were delivered through more than 150 credit lines in 10 new member states, over 4,400 staff were trained and more than 70 technical assistance packages were implemented.
The grant support to the Facility was highly relevant for the first years of its operation, but its relevance declined over time. When designed in 1997/1998 all the available evidence pointed to a need for a supply-based instrument to induce financial intermediaries to address market failures in providing finance for small and medium-sized enterprises. This fitted well with the institutional mandates of the international financial institutions. However, by 2000-2001, privatisation in the banking sector was largely complete and accompanied by substantial foreign bank investments. Additionally, advances were made in the regulatory environment and with accession firmly in sight, investments in all sectors and transfer of knowhow, including banking, increased substantially. From 2001 onwards, competitive pressures caused banks to re-define their small and medium-sized enterprise business models, deepen and widen target market segments and refine their products (maturities, margins, and terms). In practice, market changes have driven changes at participating financial institution level, rather than the Facility itself. Relevance of the grant support declined, since at programme level, the Facility did not adjust sufficiently to changing conditions. It was essentially a ‘one size fits all’ approach, i.e. not differentiated based on real market needs.
Catalytic effects of the grant support to the Facility diminished over time. Whilst in general the average loan size of the participating financial institutions has decreased, and the maturity of loans and percentage of loans to regionally based small and medium-sized enterprises have increased, there is no evidence that this is significantly attributable to the catalytic effect of the grant support to the Facility rather than to the evolution of the competitive environment. At best there were initial catalytic effects from technical assistance supporting new credit methodologies. Thus the recommendation from the previous interim evaluation to carry out a needs’ analysis study examining general market coverage and regional market differences should have been implemented to ensure that the catalytic principle was respected.
Additionality in line with the Phare definition has also declined over time. The consistently high levels of commitment of credit lines by the sponsor international financial institutions indicate that they rate the Facility highly according to their own internal criteria for delivering additionality, demonstrating that they can satisfy their internal tests for additionality even in near-developed markets (i.e. where the supply of funds to small and medium-sized enterprises in the candidate countries and new member states, is at tenors and conditions approaching those of the EU-15 member states). However, while there may be remaining gaps to be filled, for example niches that the market is unwilling to address (particular geographic regions or types of enterprise), this may not be an appropriate use of Phare funds. The Phare test for additionality is that “Phare support should not displace other financiers, especially from the private sector or from the international financial institutions”. In early stage markets,
displacement was unlikely. However, with the influx of foreign capital, expertise and technical assistance into the banking sector, the scope for additionality from the grant support to the Facility has substantially diminished.
The intervention logic of providing grant support to the Facility was weak and has resulted in inadequate strategic direction for the Facility. Management of the Facility has focused on disbursement of credit lines and monitoring of implementation. The design of the Facility was not underpinned by a robust intervention logic and lacked agreed and appropriate indicators for anticipated impacts at participating financial institution level. This reflects insufficient leadership of the Facility on the part of the Commission Services.
Outputs were delivered effectively by the international financial institutions, and benefits from grant support were obtained in early stages, but these diminished over time. The large number of outputs was obtained at a perceived low cost to the Commission of a 1.25% flat management fee. However, assessment of the cost-effectiveness of the Facility (from the Commission Services’ point of view) must include the extent to which the catalytic principle has been respected, as well as the additional costs due to a) the ‘Performance Fee’ provided by the Phare grant being used thereafter in the take-up of the international financial institution credit lines, and b) the extent to which the programme has built sustainable capacity within the participating financial institutions. Given that the catalytic effect of the substantial grant support was highest in the early stages and this diminished with time, cost-effectiveness of this support to the Facility is now considered to be low.
Risk-based incentives and the Equity Window were small components with limited impacts. Risk-based incentives (e.g. interest rate or currency conversion risk protection) were effective only where the instrument used was new to the participating financial institution, and this was the case in only a limited number of instances. Early negative experiences with the Equity Window, including the collapse of boom markets and the loss of appetite by investors for what were perceived as high-risk or low-return funds meant that it was not continued under subsequent programmes. The Phare grant was re-allocated to incentives under the Loan Guarantee and Leasing Window.
Long-term sustainability of effects of the Facility assessed as marginal. The majority of participating financial institutions were already targeting small and medium-sized enterprises and had business models/strategies in place prior to their participation. Some aspects of the Facility have been carried into the medium-term (e.g. credit management skills, credit-scoring methodologies etc.). However, in most cases the fast changing business environment has required further evolution of the small and medium-sized enterprise lending business model. Where sustainability is judged through development of human resource skills, these too have diminished in the medium-term (24-36 months) if not refreshed in line with market requirements. Some ‘soft’ impacts have been sustained, for example attitudinal changes towards small and medium-sized enterprises and an improved image of the participating financial institution in the market place, through association with an EU-supported product that is perceived by clients as being of a ‘European standard’.
Conclusions
Market developments were not matched by timely changes in the Facility, and the intervention logic of grant support became less valid over time.
Over time, the intervention logic underlying the Facility became less about addressing market failures in the broader sense, and more about gap filling in a developing market. This represented a significant shift in positioning and ethos of the Facility that was not matched by appropriate changes in objectives or methodologies. The case was not made for the continued high levels of blanket support of the Facility, as a pre-accession instrument, in these new market conditions.
Catalytic impacts of grant support and Phare additionality diminished over time.
Despite substantial outputs, cost-effectiveness of the grant support to the Facility has declined over time.
Whilst comparatively limited Phare resources were deployed, and good use was made of international financial institution resources to deliver substantial outputs in terms of numbers of loans and leases made, staff trained and technical assistance contracts completed, the high level of Performance Fees paid coupled with the difficulties of ensuring that sustainable capacity directly attributable to the Facility was built, particularly for later programmes, mean that the cost-effectiveness of the Facility declined over time. The most effective model was where incentives were combined with technical assistance, and whilst this had undoubted initial beneficial effects, it could not be sustained over time as the competitive business environment evolved, more foreign banks were involved, and alternative funding and support mechanisms were attracted into the small and medium-sized enterprise sector. For projects comprising incentives only, it is difficult to identify and attribute changes in bank behaviour to the Facility, rather than to responses to market changes.
Wider impacts were limited by the size and approach of the Facility.
As the Facility was never intended to be a significant presence in the markets, the potential for wider impact lies principally in its ability to deliver demonstration effects. However, there was little evidence of widespread take-up of Facility models or tools developed through the Facility. The exception to this were the successful technical-assistance-based projects, where processes and practices were taken up in wider business models and adapted over time. Given the dynamic environment, only limited sustainability could be identified, particularly for projects that comprised only incentives + credit line.
Recommendations
There are two key areas in which the recommendations are made for action: redesign of the Facility and need for proactive strategic management.
Action 1: Redesigning the Facility
Recommendation 1: Before launching a new facility, thorough re-assessment and redesign of grant support is required.
There is a need for a full review of the future role and operations of a new Small and Medium-Sized Enterprise Finance Facility, and its introduction under the Instrument for Pre-accession Assistance should be preceded by a thorough re-assessment and consequent redesign. The future facility must have a clear intervention logic, establishing the case for any grant support for the new instrument.
Recommendation 2: The thorough re-assessment and redesign of Facility should be based on detailed analysis of differences in the maturity of economies and markets.
Recommendation 3: Redesign should respect the principles of catalytic impact and additionality.
The principles of catalytic impact and additionality should be set up as positive criteria by the Commission Services, which must be met by individual arrangements with the international financial institutions, and should be clearly reflected in individual project proposals with participating financial institutions.
Action 2: Need for proactive strategic management
Recommendation 4: The Commission Services should be proactively at the heart of strategic decision making on the development and implementation of the Facility.
As the entire Facility is largely driven by absorption of the Phare grant, the Commission Services (DG Enlargement, DG ECFIN, DG Enterprise and other Commission stakeholders) should be at the heart of strategic decision-making on the development and implementation of the Facility. This would involve clarity about the policy objectives at regional, national or segment level that the Commission is pursuing and the role of the Facility in achieving these objectives. This should be set out in a series of working papers outlining the Commission’s expectations of the Facility, guidelines for ensuring additionality and catalytic effect and a set of core monitoring indicators linked to specific policy objectives.
MAIN REPORT 1. INTRODUCTION
1.1 Objectives
1. The evaluation of the Small and Medium-Sized Finance Facility (the Facility) Multi-Beneficiary Programme (MBP) is one of a series of MBP evaluations carried out as part of the
ex post evaluation of the Phare programmes 1999-2001. In view of the significance of this
programme and planned contribution for the Western Balkans this is an in-depth evaluation that will be published as a stand-alone report. In addition, it feeds into a consolidated report on the Phare MBPs in the 1999-2001 period and also contributes to the thematic evaluation of Phare support for the SME sector in the period. Both of these will in turn form part of a consolidated ex post evaluation of the Phare programmes in the period 1999-2001.
2. This evaluation report complements the ex post aspect (dealing with programmes from
1999-2001) with an interim evaluation aspect, whereby it addresses design and performance of the Phare allocations in the 2002-2005 period.3
3. The purpose of this evaluation is to assess the extent to which the Facility has met its objectives. These differ between the ex post or earlier period (1999-2001) and interim or later
period (2002 –2005). In the ex post period, the objective is stated in the Financing Proposals
(FPs) as “... to induce financial intermediaries to expand and maintain, in the long term, their financing operations with Small and Medium-Sized Enterprises.” In the later period
(2002-2005) successive programmes have widened the overall objectives: “… to assist the candidate countries in meeting the Copenhagen criteria and to contribute to the reform and strengthening of the financial sector”. This is dealt with in more detail in Section 2.1 below
and in Annex 8.
1.2 Background and Context
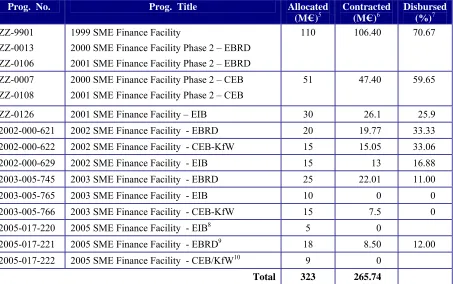
4. In the period 1999-2005, Phare allocated total grants amounting to M€ 323 to the Facility (see Table 1). This has in turn been matched by M€ 2,214 of funding from the participating international finance institutions (IFIs) – the European Bank for Reconstruction and Development (EBRD), the European Investment Bank (EIB),4 and the Council of Europe
Development Bank (CEB) in partnership with Kreditanstalt für Wiederaufbau (KfW).
3 Allocations from the 2005 Phare envelope were not at implementation stage, therefore the analysis focuses on design. 4 Up to 2005, EIB had signed three Contributory Agreements under the 2001, 2002 and 2003 budget lines, but
Table 1.- Overview of Phare contributions to the SME Finance Facility
Prog. No. Prog. Title Allocated
(M€ )5
Contracted (M€ )6
Disbursed (%)7 ZZ-9901
ZZ-0013 ZZ-0106
1999 SME Finance Facility
2000 SME Finance Facility Phase 2 – EBRD 2001 SME Finance Facility Phase 2 – EBRD
110 106.40 70.67
ZZ-0007 ZZ-0108
2000 SME Finance Facility Phase 2 – CEB 2001 SME Finance Facility Phase 2 – CEB
51 47.40 59.65
ZZ-0126 2001 SME Finance Facility – EIB 30 26.1 25.9
2002-000-621 2002 SME Finance Facility - EBRD 20 19.77 33.33
2002-000-622 2002 SME Finance Facility - CEB-KfW 15 15.05 33.06
2002-000-629 2002 SME Finance Facility - EIB 15 13 16.88
2003-005-745 2003 SME Finance Facility - EBRD 25 22.01 11.00
2003-005-765 2003 SME Finance Facility - EIB 10 0 0
2003-005-766 2003 SME Finance Facility - CEB-KfW 15 7.5 0
2005-017-220 2005 SME Finance Facility - EIB8 5 0
2005-017-221 2005 SME Finance Facility - EBRD9 18 8.50 12.00
2005-017-222 2005 SME Finance Facility - CEB/KfW10 9 0
Total 323 265.74
5. An Interim Evaluation (IE) of the Facility was carried out in 2003.11 The IE Report
concluded that while the Facility was a good concept, with a high potential for success, it required fine-tuning across a range of areas to respect Phare guidelines related to the catalytic effect, additionality and sustainability. Key issues identified in the IE Report included the need to ensure additionality and the need to focus on promoting sustainability by focussing on capacity building at the participating banks, leasing companies and other financial intermediaries - hereafter collectively referred to as participating financial institutions (PFIs). 6. The IE also noted weaknesses in the technical assistance (TA) delivered under the EBRD credit line + incentives + technical assistance model, due to lack of commitment of the senior management of PFIs, need for a better ‘fit’ between the consultants and the needs of the PFIs; and the need for pro-active management of the TA components by the EBRD. At the time of the IE, the Equity Window (EW)12 was performing poorly and the potential impact (in terms of
demonstration effect) was at risk. Operational issues identified by the IE included: a) the need to ensure a uniform quality of reporting from the participating IFIs to the Commission Services, and b) more transparent management of the IFI pipelines, including the availability of information on terms and conditions offered by all participating IFIs to PFI affiliates.
5 As per the Financing Proposal.
6 In this context, ‘Contracted’ refers to funding committed on the basis of Project Proposals submitted by the IFIs and signed
off by the Commission Services. Source of information; DG ECFIN as per 10 July 2006.
7 Of signed projects.
8 Covers Bulgaria, Romania, Croatia and Turkey. 9 Covers Bulgaria, Romania and Croatia. 10 Covers Bulgaria, Romania, Croatia and Turkey.
11 R/ZZ/SME/02.146 issued on 18 February 2003, EMS Consortium.
12 The Equity Window is only sponsored through the EBRD. It involves the establishment of special funds using
7. The IE report concluded with thirteen recommendations which focused inter alia on the
need to fine-tune the Facility to be more responsive to regional and sectoral variations; to re-examine how the Facility projects deliver additionality and catalytic impact, and to improve the quality of reporting by the IFIs. Annex 3 sets out the recommendations and the related action agreed by the Facility Steering Committee. A number of changes were introduced over time, e.g. more attention to tracking indicators, greater attention to justifying the need for second credit lines in the individual project proposals, greater standardisation of reports from the IFIs to the Commission Services) and a new format for the project proposal that included more attention to issues of sustainability and additionality. However the underlying rationale and intervention logic, despite the fast pace of change in the competitive environment in the CCs, remained largely unchanged. Where changes were made, for example to increase the focus on micro-loans, or to target new clients (particularly in the case of the later EBRD projects), this was at the initiative of the IFIs, rather than as a central part of a strategic reorientation of the programme. Importantly, the recommendation for an updated analysis of the situation in the countries in which the Facility operated was only partially acted on. The Steering Committee13 for the Facility downgraded this recommendation to focus only on
Bulgaria and Romania, despite plans for second credit lines in the soon to be member states. Even this downgraded recommendation was only partially implemented. The recommendation relating to the Equity Window (EW) was implemented, with the result that this was discontinued.
8. To date the three IFIs (EBRD, EIB and CEB-KfW) occupy an exclusive position within the Facility that the Financing Proposals justified as follows: “The technical nature and the multi-country approach of the SME Finance Facility required the involvement of highly-specialised financial institutions, with a long track record in international finance and SME development. Also the preference was for financial institutions with the status of international public-law bodies, who shared the values of the EU, in particular, in relation to enlargement and had similar public policy objectives, rather than private-sector financial institutions looking for commercial investment terms … In terms of the Financial Regulation applicable to the general budget (Art.110), and its Implementing Rules (Art.168), the characteristics of these financial institutions as public-law bodies, pursuing European public policy objectives not just for profit, as well as their track record and specialisation in financing international development, therefore put them in a monopoly situation leaving no other choice as partner for the Commission in these actions.” It is worth noting that the original conception of the Facility
(with EBRD) emphasised the delivery of technical assistance (TA) as a core capacity-building instrument. The later inclusion of other IFIs without the capacity or mandate to deliver TA marked an important change in the modus operandi of the Facility.
1.3 Evaluation Methodology
9. Evaluation questions were set out in the Terms of Reference (ToR) for this evaluation (see Annex 1), and were divided into performance evaluation questions and thematic/cross-cutting questions. Following consultation with the IFIs, DG ECFIN and DG Enlargement (Implementation, Contracts and Nuclear Task Force Unit14 and Evaluation Unit) an Evaluation
Plan including the primary sources of evidence was finalised (see Annex 2).
10. By December 2005, a total of 142 PFIs were participating in the Facility. Of these, 32 were signed up in 2005 and were therefore at a very early stage of implementation. The final
13 4 July 2003.
sample, agreed with the Commission Services and IFIs, focussed on PFIs where the Facility was at an advanced stage of implementation.
11. The final sample was selected using the following criteria: • Distribution by country;
• Distribution by IFI; • Stage of implementation;
• Distribution by type e.g. banks/leasing companies;
• Follow-up of PFIs interviewed earlier under the interim evaluation; • Inclusion of the Rural Sub-Window (RSW).
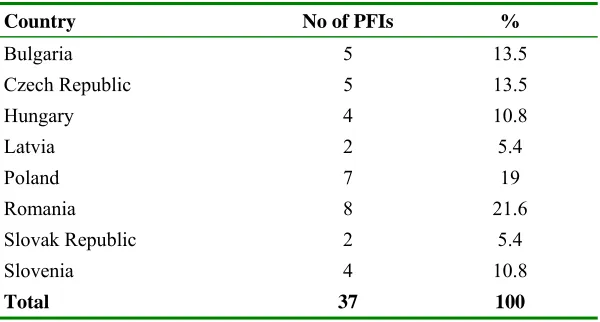
12. A total of 37 PFIs were selected and interviewed for this exercise,15 of which 18 were
follow-up interviews from the last IE exercise. The list of PFIs interviewed is contained in Annex 4 and the complete list of persons interviewed is given in Annex 11. The sample comprises 26 % of total PFIs, but approximately 38 % of total credit lines committed/disbursed in the 1999-2005 period (very little funding has been delivered to date under the 2003/2005 budget lines).
[image:15.595.146.449.355.434.2]
Table 2.- Breakdown of sample by IFI
IFI Total No of PFIs No of PFIs in Sample %
EBRD 65 19 28
CEB-KfW 48 11 23
EIB 29 7 24
Totals 142 37 26%
Table 3.- Breakdown of sample by country
Country No of PFIs %
Bulgaria 5 13.5
Czech Republic 5 13.5
Hungary 4 10.8
Latvia 2 5.4
Poland 7 19
Romania 8 21.6
Slovak Republic 2 5.4
Slovenia 4 10.8
Total 37 100
13. A questionnaire was developed and distributed to the interviewed banks. The questionnaire is given in Annex 5 and the findings are integrated into the relevant sections of this report. Interviews with PFIs were undertaken using a structured interview methodology designed to:
• Establish the linkage between the strategic priorities of the respondent and the objectives of the Facility;
15 In addition two ‘lending’ banks were interviewed in Slovenia (i.e. banks that borrow from the Facility PFIs for
[image:15.595.150.450.474.635.2]• Differentiate between wider influences of the competitive environment and the capacity of the Facility to induce behavioural changes;
• Identify the method of the Facility implementation and its impact on the SME business model used by the PFI.
14. Each interview was conducted around four core modules, commencing with the wider SME competitive environment, how the PFI addressed commercial opportunities and competitive pressures at the strategic and operational levels and finally implementation of the Facility itself and its impact (immediate and intermediate) at the strategic and operational levels. The interview structure was highly complementary to the questionnaire in that it provided a good vehicle to explore strategic and commercial imperatives governing the SME business within the institution. More detail on the interviewing methodology is given in Annex 6.
15. Evaluation of the Facility is constrained by a number of factors. Firstly, the extensive penetration of the banking sector by the Facility through the IFIs means that the majority of the major banks are participants, thus making it difficult to identify a control group. Even if a control group had been identified, detailed information on their SME loan portfolios would have been virtually impossible to obtain. Secondly, much of the impact at the PFI level is intangible, making it problematic to establish firm evidence of outcomes directly attributable to the Facility; outcomes that would have happened in the same or similar way regardless of the Facility; and those outcomes that would have happened regardless of the Facility but have happened more rapidly due to the Facility intervention. Where it is not possible to establish tangible evidence of linkages, the evaluators have relied upon the assessment made by management at the PFIs themselves.
16. In its design, the Facility logframes setting out the intervention logic and the appropriate indicators for each level are weak.16 In order to achieve clarity on the use of terminology, and
to assist in identifying impacts at the appropriate level, the Evaluation Team reconstructed the intervention logic, which is shown in Annex 7.
2. PERFORMANCE OF THE FACILITY
2.1 Grant support to the Facility was highly relevant for the first years, but its relevance declined over time
17. The needs’ analysis underpinning the Facility was firmly grounded. Before the introduction of the Facility, Phare was already deeply involved in financial instruments in support of SME creation and development, including through financial intermediaries. As of 1999, € 212 million of programmes had been supported in providing debt and equity finance. In addition, various Phare sector programmes in energy, environment and regional development included SME finance components.17 The Agenda 2000 impact study specifically
identified lack of access to finance as a key bottleneck in SME development. With the adoption of the Phare New Orientations in 1997, the Commission Services were mandated to establish a horizontal SME facility for the region as a whole. The needs’ analysis underpinning the Facility was firmly grounded in the Agenda 2000 impact study, the EBRD/World Bank “Business Environment and Enterprise Performance Study” (BEEPS) in 1999, and in the
Commission Services’ own feasibility study and market demand analysis18 supporting the
design and launch of the Facility. Based on this body of research, the 1999 Financing Proposal stated that SME financing problems were becoming increasingly serious. Demand for finance was found to be rising rapidly, but banks and investment funds continued to lack experience and were reluctant to provide finance to the sector. The FP went on to conclude that SMEs were effectively excluded from debt and equity finance in virtually all SME size categories and countries. All the evidence at the time pointed to the occurrence of market failure.
18. The original concept and design of the Facility was strongly driven by the market environment of the mid to late 1990’s. At that time, it was not clear that financial sector market liberalisation would continue; or what the private (financial) sector response would be in terms of competition, Foreign Direct Investment (FDI), mergers and acquisitions. The Asian market crisis of 1997 had undermined confidence in emerging market economies, which was subsequently reinforced by the 1998 Russian financial crisis. In this period accession was uncertain. Much of the banking sector in the region was still dealing with historic loan portfolios of state-owned enterprises facing financial difficulties. There was relatively little financial sector interest in lending to SMEs, and market failure was easily identified.
19. The Facility as it was designed could therefore be characterised as intervening in two areas that inhibited banks from addressing SME needs:
• Banks lacked the liquidity or access to term funding to support medium-term or foreign currency SME loan products, or
• Banks lacked management capacity and willingness to provide appropriate products in a controlled risk environment under a sustainable business model.
20. These opportunities for intervention sat well with the IFI partners’ institutional mandates. For the EBRD, supporting SMEs through financial intermediation is the core component (Pillar 1) of the Bank’s SME strategy. For the EIB, the Facility is an opportunity to fulfil their role as an implementation arm of Commission policy and the Facility has been adapted and
17 Small and Medium-Sized Enterprise Finance Facility Financing Proposal 1999.
18 Based on Agenda 2000 and the Phare New Orientations, a Working Group comprising the Commission, the EBRD and the
implemented as an extension of their SME Global Loan product. Likewise for CEB/KfW, the Facility has provided the chance to extend fulfilment of their respective mandates.
[image:18.595.144.456.276.514.2]21. By 2000 a series of major events were in process that were to fundamentally change the competitive landscape for the delivery of commercial banking services in candidate countries. Firstly, future membership of the EU was firmly accepted as a policy goal by candidate countries. With it came adoption of the Copenhagen Criteria and a move to reform and modernise banking sector regulation. The evolution of banking sector regulatory reform can be tracked through the EBRD Banking Reform and Interest Rate Liberalisation Index. Above a value of 4, countries are considered to approximate to EU member standards. Many of the candidate countries can be seen to accelerate the reform process from the late 1990s onwards (and in the case of Bulgaria and Romania progress in 2004 and 2005 is noticeable - see Figure 1).
Figure 1.- Evolution of EBRD Transition Indicators for 5 countries
EBRD Banking Reform and Interest Rate Liberalisation
2.40 2.60 2.80 3.00 3.20 3.40 3.60 3.80 4.00 4.20
1999 Ź
2000 Ź
2001 Ź
2002 Ź
2003 Ź
2004 Ź
2005 Ź
Year
average NMS
average CC
22. Secondly, and consistent with reform of the banking sector regulation, the bank privatisation process continued. This coincided with the opening up of markets to foreign bank ownership. By 2001, major banks in the region were already controlled by foreign banks. The following figures present a few examples of the percentage of bank assets owned by foreign banks in 2001.19
Table 4.- Percentage of bank assets owned by foreign banks in 2001 Country %
Poland 51%
Hungary 61%
Czech Republic 78%
Slovakia 75%
[image:18.595.232.366.632.712.2]
23. By this time (2001), European commercial banks had clearly identified that beneficiary countries provided the potential for asset and profit growth rates far above west European levels. Annual growth rates of 10-15% over the medium term were predicted by analysts at the time, albeit from a lower base than in mature European markets. Banks were also aware of the need to establish their position in these fast liberalising markets or risk being excluded by high competitive barriers to entry. Further, for many European banks, candidate country markets were regarded as being extensions of the home market or existing lines of business and therefore far more accessible than other emerging markets that might be on a similar reform or growth path but very distant geographically, commercially and culturally.
24. With accession firmly in sight, investments in all sectors, including banking, increased. The path to accession was firmly established on 13 December 2002, with the decision of the Copenhagen European Council that ten candidate countries (Cyprus, the Czech Republic, Estonia, Hungary, Latvia, Lithuania, Malta, Poland, Slovakia and Slovenia) could join the EU on 1 May 2004. Subsequently on 16 April 2003, the EU signed accession treaties with these countries. Thus the guarantees of political and economic stability and particularly rights of private sector bank ownership were established. This led not only to sharp increases in foreign direct investment, but also to intensified investments in the banking sector.
25. Banks that had entered the market through acquisition were left with a major task of bank restructuring. Retail banks often exhibited cost-income ratios approximating European levels but this was on account of high loan margins, which disguised an average ratio of costs (operating costs excluding loan provisions and extraordinary items) to volumes (customer loans and deposits) at approximately double west European levels.20 Interviews with foreign
owned privatised banks in the sample group identified, without exception, that the period of the mid-late 1990s and early 2000s were dominated by restructuring issues.21 All banks
interviewed also observed intensifying competition over this period in traditional larger corporate lending markets, evidenced by declining loan margins and easing loan conditions. 26. Banks identified the SME market as a core business sector with potential for growth. With restructuring well underway, commercial challenges being faced in their traditional loan markets and the prospect of accession firmly on the horizon, banks turned to the SME market as one of the business sectors in which future growth opportunities existed. Banks were also aware that in the face of intensifying competition, it was essential to build up a defensible market position in a short period of time.
27. This shift in strategic emphasis by most of the major banks in the region is the third factor in the step change that has occurred in the competitive environment in which the Facility operates. All banks interviewed in new member states identified their strategic priorities as addressing new SME market segments with appropriate products and business processes on a wider geographical basis than had previously been the case. Thus from late 2002-onwards, competitive pressures caused banks to define their SME businesses models, deepen and widen target market segments and refine their products (maturities, margins, terms).
28. For most PFIs, the timing of the Facility was fortuitous and coincident with the above-described circumstances that had caused banks to reconsider their opportunities and approach to the SME market. The same is also broadly true of leasing companies that reported similar
20 McKinsey Quarterly, ‘
Eastern European Banking Matures’, No. 2, 2003. Di Maggio, Romanowski, and Walter.
21 Banks in markets that went through an earlier process of privatisation and regulatory reform addressed SME business
competitive pressures to explore new clients, asset classes, flexibility in lease size and geographical coverage.
29. The earliest Facility FP of 1999 recognised that the potential demand for SME finance far exceeded the capacity of an instrument such as the Facility to satisfy. Rather, its value lay in establishing a critical mass of debt proposals that would demonstrate the profitability of the sector and provide a clear demonstration effect to entice other banks to start up similar operations themselves. The later FPs also included objectives aimed at inducing or building the confidence of Participating Financial Institutions (PFIs) to expand and maintain their financing operations with SMEs. However, whilst the increasing competitive pressures in the market forced banks to respond quickly, the Facility itself moved too slowly in the key period from 2002-2004 to maintain its effectiveness. In that period, average (non-Facility) loan sizes by PFIs were decreasing, tenor was increasing, and the PFIs were actively seeking new and smaller segments of the SME market. In this context, the Facility as a whole could have responded by identifying particular niches in the SME market e.g. support for start-ups or an intensified focus on micro-enterprises and micro-credits (areas into which the PFIs were still reluctant to expand), particularly for second credit lines. With particular regard to micro-finance, the Facility did not set any overall targets or objectives, but individual IFIs, in particular the EBRD, have taken action to encourage lending at the smaller end of the spectrum.
30. In the period 2000-2004, for the reasons explained above, most of the major banks in the region had established their strategies for addressing the SME market and had begun to focus progressively on smaller loans and smaller clients, and the potential for the Facility to contribute to strategy development declined. The design of the Facility failed to incorporate the management and governance mechanisms that would have facilitated a strategic review and consequent action plan regarding the Facility objectives and implementation in the light of fundamental changes in the market environment.
31. From 2000, the overall objectives of the Facility presented in the FPs changed somewhat from an initial focus on building capacity, and interventions at the level of financial intermediaries towards contributing also to broader financial sector reform. This was in response to Agenda 2000 and the New Orientations of the Phare programme. Annex 8 shows the evolution of objectives over the entire period. They have essentially remained unchanged, however, focusing continuously on improved SME access to banking services, and their sustainable supply from the banking sector. The rationale and modus operandi of the Facility
(provision of credit lines, incentives and technical assistance) did also not undergo any major changes.
33. Despite a focus on monitoring and control, there was little focus on the extent to which the Facility was meeting Phare’s strategic objectives. In general, there was a preoccupation with monitoring and control at the operational level and little attention was given to which strategic goals the programme - and in particular the Phare funds - were trying to achieve. However, the extent to which the Facility meets the goals of the sponsor IFIs is a matter for internal discussion and debate within the IFIs themselves. High levels of commitment of IFI funds to the Facility, in excess of commitments made during drafting of the FPs, indicate that there is considerable added value to the IFIs in this cooperation. Therefore, under the current management structure of the Facility, it is perfectly possible for the continuing relevance to Phare grant support to be questionable, whilst at the same time satisfying internal guidelines on the part of the IFIs.
2.2 Outputs were delivered effectively by the IFIs, and benefits from grant support were obtained in early stages, but these diminished over time.
34. Implementation of the Facility is based on a partnership between the Commission Services and the sponsor IFIs. Day-to-day management of the Facility activities is delegated to the IFIs. A Steering Committee comprising representatives of the Commission Services (DG Enlargement, DG Agriculture, DG Enterprise and DG ECFIN) and the three sponsor IFIs deals with overall coordination.22 As the Secretariat of the Facility, DG ECFIN (Unit L)
efficiently coordinates the flow of information between the Commission and the sponsors for all matters related to projects signed with the IFIs, the Steering Committee meetings, any technical meetings and the administration of the Special Account.23
35. DG ECFIN closely monitors the implementation of the Facility by the IFIs. As of November 2005, a new Programme Management System (PMS) has been put in place for all Commission mandated instruments,24 including the Facility. The PMS is a specific relational
database with an internet interface, which can re-group the information contained in several dispersed Excel files and which enables easier collection and analysis of data. However this data is confined to issues of contracting (i.e. projects signed with the IFIs) and disbursement. The annual and semi-annual reports prepared by the IFIs contain more implementation level information, but this is not structured to be informative on progress towards meeting Commission objectives, especially since objectives are ill defined.
36. The new monitoring policy has increased control of the Phare funds, but has proved cumbersome. In 2005 a new monitoring policy was implemented by the Commission Services, to ensure that internal control systems at the IFIs were sufficient to confirm that the PFIs were fulfilling their obligations under their contracts with the IFIs and to permit timely identification and correction of problems in the application of the Phare eligibility rules. Feedback from the interviewing process indicates that the practical outcome of this exercise has been to increase the reporting requirements of both IFIs and PFIs and to increase the number of site visits and on-the-spot checks and missions, by both Commission Services and IFIs, to the PFIs. At present count, PFIs undergo approximately seven kinds of monitoring: by sponsor IFI management; by sponsor IFI auditors; by sponsor IFI evaluation teams; by DG ECFIN; by DG Enlargement; by the Phare Evaluation exercises and ultimately by the Court of Auditors. Although the Commission Services (DG Enlargement and DG ECFIN) combine
22 More detailed information on the management, coordination and activities of Facility is given in Annex 9. 23 The Special Account is an interest bearing account held at the Sponsor IFIs for the Phare contribution.
24 Financial instruments mandated to International Financial Institutions (IFIs): include the ETF Start-up; the SME Guarantee
monitoring visits to minimise the burden on PFIs, the process is still onerous. Reporting from the PFIs to the IFIs is also complex and lasts for the duration of the credit line signed with the IFI (up to 12 years). While procedures to ensure transparency of the use of the Phare funds is to be welcomed, it is worth noting that the IFIs have a fiduciary responsibility to ensure that Phare funds are used with the same degree of probity as their own funds. As the systems and procedures in place at the IFIs have been tested and verified as meeting the appropriate Commission standards, then both the added value of, and need for, additional cumbersome layers of operational monitoring must be questioned.
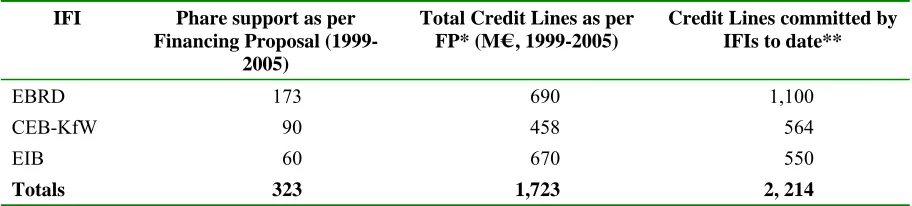
37. Phare grant has supported delivery of considerable IFI loans. Phare funds of M€ 323 have been matched by M€ 2,214 of IFI credit lines. Over the period 1999-2003, Phare made M€ 291 available under the Facility in the ten CCs. From 2001, it was decided to extend the scope of the Facility to all CCs and M€1.5 was made available under Phare 2003 for Cyprus25.
[image:22.595.70.526.392.495.2]A further M€4 was made available for Facility projects with CEB-KfW in Turkey. No Phare funding was programmed in 2004, but in 2005, an additional M€32 were made available for Bulgaria, Romania, Croatia and (in the case of the agreements with CEB-KfW and EIB), for Turkey. In line with the FPs and Contribution Agreements, the Phare support is matched, at varying ratios by IFI credit lines, as shown in Table 5 below and in Annex 9. To date IFIs have committed to provide at least M€ 2,214 in credit lines (as shown in the FPs), of which approximately M€ 1,723 has been committed to 156 credit lines under approved project proposals (PPs).
Table 5.- Credit Lines committed by IFIs IFI Phare support as per
Financing Proposal (1999-2005)
Total Credit Lines as per FP* (M€ , 1999-2005)
Credit Lines committed by IFIs to date**
EBRD 173 690 1,100
CEB-KfW 90 458 564
EIB 60 670 550
Totals 323 1,723 2, 214
Source: FPs 1999-2005. * FP states a minimum contribution by the IFIs. ** As of 10 July 2006.
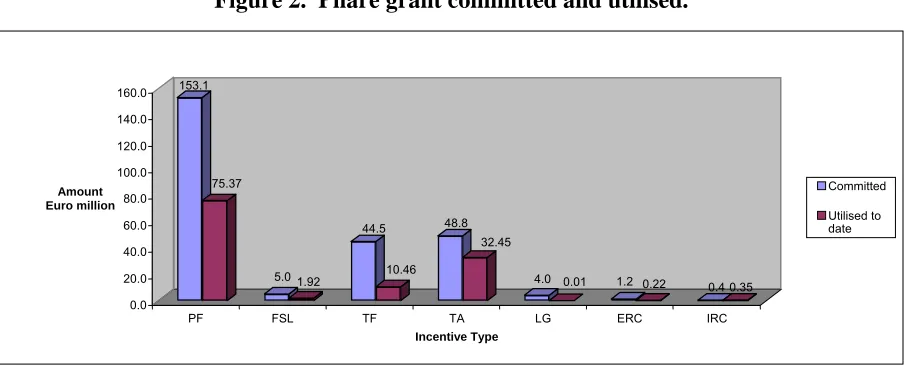
38. Phare funding has been used to provide a range of incentives for PFIs,26 which can be broadly divided into four categories (see Annex 9 for more detail):
• Technical Assistance, which is a feature of the EBRD use of the Phare grant, and to a lesser extent and more recently, of the CEB-KfW projects;
25 Cyprus’ participation in the Facility was limited to projects with CEB-KfW.
26 The purpose of the incentive is to ‘induce’ the PFIs to maintain and expand operations with SMEs. While in more recent
• Performance-based incentives27 such as the Performance Fee, the Fee for Smaller Loans (FSL) and Transaction Fees (TF), all contingent on successful on-lending of credit lines by PFIs;
• Risk-based incentives such as the Loan Guarantee (LG), the Exchange Risk Cover (ERC) and the Interest Rate Cap (IRC);
• Equity finance (only in cooperation with the EBRD) in which the Phare grant provides seeding or soft financing terms for the fund by investing alongside the EBRD and other investors at specified ratios.28
39. Performance-based incentives have been heavily used. Performance-based incentives, particularly the Performance Fee, have been the most heavily utilised and account for approximately M€251. Transaction Fees (TF) and Technical Assistance (TA) amount to approximately M€44 and M€49 respectively. Risk-based incentives account for only a very small proportion of the total Phare financial incentives delivered, and are used most extensively by CEB-KfW (which utilises the widest range of incentives) (see Figure 2).
[image:23.595.72.526.373.556.2]40. To date, EBRD has signed approximately 75 TA contracts, for a total value of M€ 38.725, of which 34 have been completed. Support for the EW constitutes approximately 0.3% of Phare funds and has been primarily in the form of equity investments in four funds (see Annex 9 for more details).
Figure 2. Phare grant committed and utilised.
41. The Facility has been implemented effectively by the participating IFIs (see Annex 9 for more details). In line with the reconstructed intervention logic (Annex 7), these can be divided into three main categories: a) loans/leases to SMEs; b) outputs of the TA and; c) ‘soft’ capacity building e.g. experience in dealing with, and reporting to IFIs, new funding options or risk management instruments utilised.
27 In the context of the Facility, ‘performance’ is judged in different ways, based on discussions between the IFI and the
respective PFI. Thus there is some variation between the IFIs on how performance is measured. For EBRD projects, to draw down the performance fee, the PFI must meet specific performance and eligibility criteria related to the lending itself (e.g. size of loan) and quality of the lending (i.e. less than 5% arrears rate over 60 days, calculated as portfolio at risk on the volume of outstanding loans to SME borrowers funded by the Facility). Performance fee rates differentiate between micro and small loans, with the aim of targeting micro loans. In the case of CEB/KfW, the criteria for draw-down of the performance fee relates to the achievement of certain policy objectives, for example, in the case of the Rural Sub-Window (also relevant to EBRD), the eligible loans must be to SMEs in rural zones or farmers with less than 100 full-time employees (or the equivalent number of part-time employees).
28 See Annex 9 for further information on the operation of the Equity Window (EW).
153.1
75.37
5.0 1.92 44.5
10.46 48.8
32.45
4.0 0.01 1.2 0.22 0.40.35 0.0
20.0 40.0 60.0 80.0 100.0 120.0 140.0 160.0
Amount Euro million
PF FSL TF TA LG ERC IRC
Incentive Type
Committed
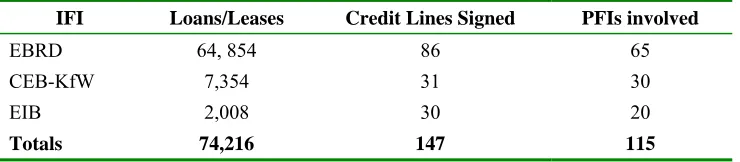
42. Table 6 below gives an overview of the outputs of the Loan Guarantee and Leasing Window (LGLW). By the end of 2005, approximately 74,216 loans/leases to SMEs had been made by 115 PFIs.29 In general, and despite some start-up and IFI-specific structural problems,
[image:24.595.115.485.185.266.2]the Facility has been a relatively efficient instrument in terms of the large number of outputs delivered and PFIs involved.
Table 6.- Overview of Loan Guarantee and Leasing Window outputs IFI Loans/Leases Credit Lines Signed PFIs involved
EBRD 64, 854 86 65
CEB-KfW 7,354 31 30
EIB 2,008 30 20
Totals 74,216 147 115
43. The Facility made good use of IFI resources to deliver outputs. An important strength of the partnership with the IFIs is the ability of the Facility to utilise the resources, networks and specialist knowledge of the IFIs for implementation. This means that on the Commission Services side, only comparatively limited resources need to be deployed. For their implementation services, the EBRD and CEB-KfW receive a 1.25% flat management fee30
while EIB receives a 1.2% fee. These fees have amounted to €1,042,000; €416,000 and €120,000 respectively, for the entire period between 1999 and the end of 2005. Given that some credit lines can run for up to 12 years, with the related monitoring and reporting, this is a considerable amount of input by the IFIs for a very limited management cost to Phare.
44. However the total cost of delivering the outputs must include the Phare grant. In addition to the management fee, there is an additional cost to achieving the substantial outputs. Feedback from the interviews indicates that one of the main benefits of the Phare incentives (totalling M€265.74),31 and in particular the Performance Fee to PFIs, has been to increase the
attractiveness of the IFI credit line. Thus, part of the Phare grant (in the form of the Performance Fee) that has been used to promote take-up of the IFI credit line, should be seen as a cost to the Commission for the delivery of the outputs.
45. TA provides the bridge between the use of the credit line + incentives model and the development of a sustainable SME business model. TA is an important feature of EBRD projects. It is implemented under EBRD Framework Agreements, and supports both the implementation of the credit line and wider capacity building activities at the PFIs. Under the EBRD TA components, 75 TA contracts were implemented and approximately 4,400 bank staff received training. Unlike the EBRD model, TA delivered within the CEB-KfW projects is contracted by the PFIs themselves in line with their own requirements (6% of total incentives used by CEB-KfW was for TA).
46. Reported outputs of the TA (both EBRD and CEB-KfW) may be grouped into five categories:
29 By the end of 2006, EBRD’s cumulative commitments alone reached € 1,076.5 million to 39 banks and 37 leasing
companies covering the 11 eligible countries; and over 82,500 sub-projects amounting to € 1.75 billion were disbursed to SMEs.
30 Based on DG ECFIN data on disbursed amounts as of 10 July 2006.
31 As per the Financing Proposals, M€323 has been made available to the Facility; M€265.75 has been contracted and
• Support for organisational development including development of strategies towards SMEs;
• Improved risk management processes; • Staff training and skill enhancement;
• Improvements in procedures and documentation; • Marketing activities connected with the credit line.
47. Efficiency of the EBRD TA has been adequate. Efficiency of the EBRD TA depended
inter alia on a number of factors given below. Since not all these factors were always
coincident there were a small minority of EBRD projects that failed to achieve their objectives as defined in the project proposal. Success factors included: well-designed TA components with good input from the PFI; a good ‘fit’ between the organisational needs of the PFI and the technical capacity of the contractor; commitment of senior bank management; active management of the TA contract by the EBRD Task Manager to ensure that where TA projects are not delivering they are either re-oriented or stopped. This is particularly important given the often long duration of the interventions (up to 3 years). In the cases where the TA was less than successful, this was due to a number of factors, including poor delivery by contractors and, importantly, marginalisation of the TA team within the PFI, whereby their role was seen primarily as providing sound management of the IFI credit line, rather than capacity-building in the wider institution.
48. Despite recent improvements in the environment for equity capital, the Equity Window concept was not revived. The Equity Window (EW) was introduced in 1999 and following a disappointing start, the EBRD noted that it would be difficult to commit the programmed funds within the allocated timeframe. In January 2003, the Steering Committee took the decision to re-allocate M€4.75 from the EW to the LGLW. Later, in July 2003, the Steering Committee approved the EBRD request to transfer the outstanding amount of M€4 to the LGLW and it was agreed by the Committee that no further projects would be proposed under the EW, and the EW was not continued under subsequent annual programmes. The factors influencing the poor performance of the EW in the 1999-2003 period, identified in the earlier IE report include:
• The collapse of boom markets generally in the period and the loss of appetite by investors for what are perceived as high risk or low return funds;
• The decline in interest in the technology and “new economy” sectors, which were considered a potentially fertile ground for the investment funds;
• Fund structures that were more complicated and time consuming to resolve than originally anticipated;32
• Unexpected delays in early stage markets in educating entrepreneurs in the benefits and modalities of involvement of private equity providers.
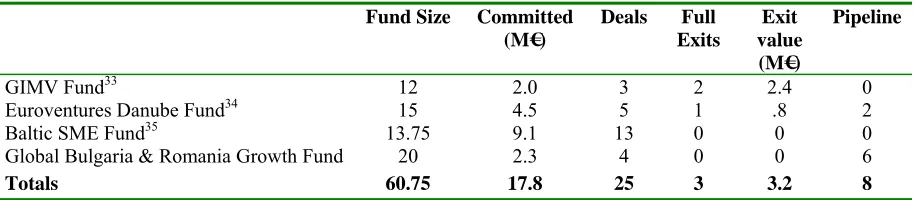
49. However, despite improving market conditions for equity finance (noted in the EBRD’s 2005 Annual Report), as evidenced by the successful recent performance of the EW funds (see Annex 9 and Table 7), no further development or refinement of the EW concept was carried out and the performance fee instrument was preferred. To date the EW has committed around M€18 of the planned M€61 and achieved 3 full exits.