Understanding post-Crisis Price Deviations in Europe:
Disintegration or Mere Adjustment?
Marina Glushenkova∗
University of Nottingham Ningbo China
Marios Zachariadis† University of Cyprus
September 3, 2018
Abstract
The paper investigates the process of European integration using Law of One Price (LOP) deviations for a large number of individual goods and services during the recent Crisis. We find that the degree of integration of Eurozone economies continued to increase during this period. Importantly, we trace the location of individual goods in the distribution of LOP deviations so as to understand how price advantage or disadvantage has evolved or persisted during the Crisis. We find that rigidities rendering prices in some markets higher persisted during the same period. Thus, while well-deserved policy emphasis has been placed by the Eurozone on correcting fiscal imbalances and on monetary policy to address the resulting deflationary bias, our work suggests that little has been done in practice to break structural rigidities in goods and services markets during the period under study. Finally, comparing the distributions of LOP deviations for each of the Eurozone economies, we show that to the extent that there was adjustment for some of these economies this did not occur via the same channels for all Eurozone countries, suggesting different non-tradeables and tradeables adjustment mechanisms being in place in different countries.
Keywords: micro prices, law-of-one-price, euro, integration. JEL Classification: F4
∗
Marina Glushenkova, University of Nottingham Ningbo China, 199 Taikang East Road, 315100 Ningbo, PR China. Phone#: 86-574-88180000 (ext.8420), Fax#: 86-574-88180125. E-mail: [email protected]
†
1
Introduction
Law-of-one-price deviations can indicate the degree of market integration present across any two locations at a point in time. Moreover, the extent to which these persist over time can indicate persistent production characteristics or rigidities that render some locations persistently more ex-pensive than others for particular goods and services. These rigidities could be related to market structure and in particular to the lack of competition in some of these economies.1
A large body of papers has focused on measuring the changing degree of integration in the Eurozone using micro prices. Some of these papers focus on specific markets e.g. TV set prices (Imbs, et al. 2010) or washing machine prices (Fischer, 2012) while others consider product-level prices for a broad range of tradeable goods. The latter paper does not find price convergence in the EMU for highly comparable washing machine prices during 1995-2005, while the former paper shows that EMU countries display lower price dispersion but not necessarily because of the single currency. The difference in the results could be due to differences in the markets each of these papers focuses on. Similarly, Parsley and Wei (2008) using a narrow set of comparable product items found little effect of the introduction of the euro for price level convergence in twenty-five European countries between 1993 and 2005. On the other hand, Allington et al. (2005) find increasing integration in the form of price convergence for tradeables among EMU members between 1995 and 2002 based on the analysis of price level indices for individual consumption expenditure in 200 product groups. Differences in the period and country sample under study might drive the differences in results reported in the above papers. Finally, Guerreiro and Mignon (2013) use comparative price levels for twelve EZ members at the monthly frequency between January 1970 and July 2011, and
1
find high convergence speeds relative to Germany for core EZ countries but also for some of the periphery (Greece and Portugal) albeit mainly due to the latter’s loss of price competitiveness.
Our results provide lower-frequency and cross-sectional microeconomic evidence in relation to the above for the periphery as well as other Eurozone countries during the Crisis years. Our paper complements previous work using European disaggregated prices, by focusing on the period between 2005 and 2014 in an attempt to understand the impact of the recent Eurozone Crisis on European integration. Part of our contribution is to investigate price integration in the Eurozone using LOP deviations for a large number of individual consumer goods and services rather than focusing on a specific market or narrow set of goods.
Importantly, we trace the location of individual goods in the LOP distribution so as to under-stand how price advantage or disadvantage has evolved or persisted during the recent Crisis. In Glushenkova and Zachariadis (2016), we showed that the location of individual goods’ prices in the distribution of LOP deviations persists for decades and that price advantage appears to be more persistent than price disadvantage consistent with a persistent productivity advantage for countries like Germany, the Netherlands and the UK. If the Crisis had an impact on long-standing rigidities across EU countries, then we would have observed a considerable fall in persistence over the past few years for goods that had been consistently more expensive in some of the more problematic economies. We find that this is not the case. In particular, persistence2 for goods that were more expensive is typically high and comparable for 2010-2014 and 2005-2010 in Cyprus, Greece, Ireland, Italy, Portugal, Spain and elsewhere in Europe, suggesting that any pre-existing rigidities remained in place during the Crisis.
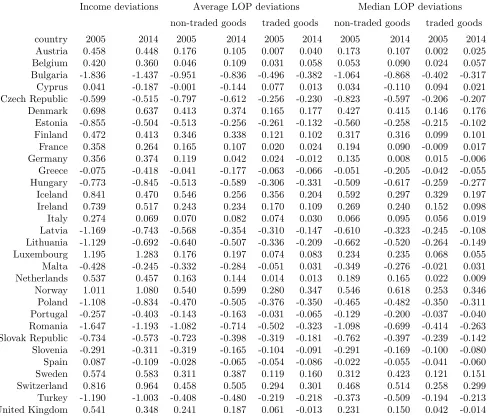
To the extent that there was price adjustment in some of these economies this did not occur via the same channels for all of these economies, implying that different non-tradeables and tradeables adjustment mechanisms were at place in each economy.3 More specifically, both the mean and median non-tradeable product price fell relative to other EZ economies in Cyprus and Greece consistent with significant downward income adjustment there relative to other EZ economies. However, there was only a small fall in relative prices for non-tradeables in Ireland, Portugal and Spain, despite large relative drops in income in all three of these countries. A relative fall in the price of non-tradeables was also observed in Austria, Germany, France, Iceland and the UK, and was associated with a relative fall in income during the period for the last three countries. During the same period, both the mean and median tradeable good price fell in Cyprus, Iceland, Ireland,
2Defined as in Glushenkova and Zachariadis (2016) as the percentage of goods which remain on the same side of
the distribution (in this case, above zero thus more expensive) for the pair of years being compared in each case.
Italy and the UK. Downward price adjustment in locations that were initially more expensive for tradeables like these five countries, is a sign of further integration of these economies with the EZ. A small relative fall in tradeables prices was also observed in Portugal and Spain but not for Greece, reflecting the perceived price inelastic nature of product markets in this case.
The next section describes the data, while the following section provides our empirical methodology and results. The final section briefly concludes.
2
Data
We define LOP deviations as
qijt= ln(pijt)− Nit
X
j=1
ln(pijt)/Nit (1)
where pij is the price of good i in country j at time t, expressed in Euro, and Nit is the number
of EZ economies where good i is available at time t. We regard LOP comparisons relative to the EZ-19 mean price. The EZ-19 are the nineteen EZ economies as of January 1st 2016.
Finland, France, Germany, Greece, Ireland, Italy, Latvia, Lithuania, Luxembourg, Malta, the Netherlands, Portugal, the Slovak Republic, Slovenia, and Spain), non-EZ EU countries (Bulgaria, Czech Republic, Denmark, Hungary, Poland, Romania, Sweden, and the UK) and other European countries (Iceland, Norway, Turkey, and Switzerland).
The Eurostat survey reports retail prices paid by a customer at the point of sale and therefore include value-added tax. We have collected data on VAT rates for various product categories from the European Commission report on VAT Rates Applied in the Member States of the European Union4 for 2005, 2010, and 2014, and applied these category/year-specific VAT rates to obtain free of value-added tax price of each product. In what follows, we present the results for prices net of VAT.
We constructed our panel dataset from the separate cross-sections data via the painstaking task of matching goods available in the 2005, 2010 and 2014 cross-sections. We focus on goods that were available for both 2005 and 2014. In what follows, we mostly focus on these two years since they more clearly mark the period before and after the incidence of the Crisis. Moreover, because for 2005 and 2014 we have additional information in the form of specific brand names (see Table 1 for a representative subset of all goods) not available in 2010. This allows for a much more careful matching across years than was possible in Glushenkova and Zachariadis (2016). The matched goods prices were adjusted to have the same quantity units in different years, using an appropriate adjustment coefficient. To explain LOP deviations across European countries we use only goods with sufficient cross-country variation. This is taken to be at least sixteen observations. Furthermore, to alleviate measurement error, we control for outliers by eliminating observations that are at least ten times bigger or smaller than the cross-country mean price level.
3
Empirical results
In Table 2, we report the averageqjt for each countryj for goods that can be broadly categorized as
traded versus non-traded. In the first two columns of Table 2, we present the deviation of nominal income in euro for each country relative to the EZ19 in 2005 and 2014. Nominal income is measured as gross domestic product in current prices divided by midyear population, available from the World Bank WDI database. We define income deviations as ∆gdpjt = ln(gdpjt)−N1 PNj=1ln(gdpjt), where
N is the number of (nineteen) EZ economies.
As we can see in Table 2, both the mean and median non-tradeable product price fell relative to other EZ economies in Cyprus and Greece consistent with significant downward income adjustment for these relative to other EZ economies, as can be seen via a comparison of the first and second column of Table 2. A relative fall in the price of non-tradeables was also observed in Austria, Germany, France, Iceland and the U.K., associated with a relative fall in income during the period for the last three countries. Moreover, as shown in Table 2, mean and median tradeable goods prices visibly fell in Cyprus, Iceland, Ireland, Italy and the UK.
from 0.688 to 0.5025 between 2004 and 2014 suggesting that Germany becomes more competitive in labor cost, which in turn can cause a fall in prices of both tradeables and non-tradeables.
Comparing the distribution of LOP deviations before and after the Crisis
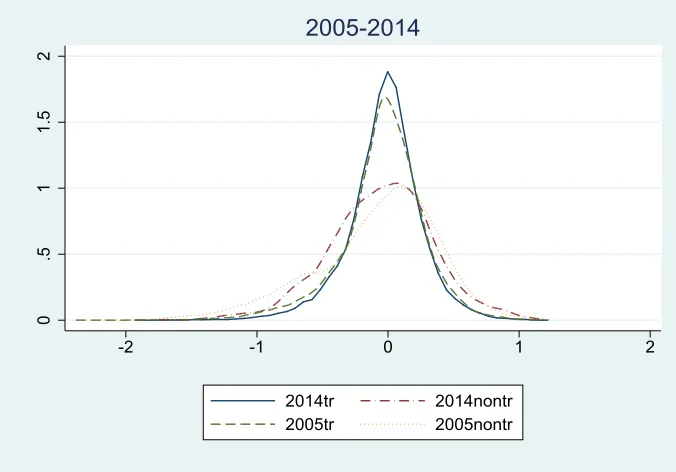
In Figures 1 and 2, we plot LOP deviations for the 31-country sample and for the 19 EZ countries, respectively. Each line represents an estimate of the density of LOP deviations (common currency prices compared to the cross-country mean), good-by-good, for 2005 and 2014. We distinguish between traded and non-traded goods and plot their separate distributions for 2014 and 2005 for the 31-country sample and for the 19 EZ economies. These figures show that price dispersion is lower for tradeables as compared to non-tradeables, and that dispersion for both tradeables and non-tradeables becomes lower during the Crisis.
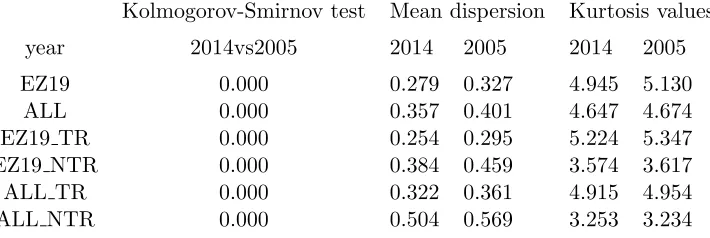
In addition to the visual evidence, we consider the Kolmogorov-Smirnov test for the null of equality of the empirical distribution functions and report results in Table 3. The Kolmogorov-Smirnov tests suggest that the empirical distribution of LOP deviations in 2005 is different than in 2014 for both groups of countries. Kurtosis of the LOP deviations distribution for the complete sample of goods falls slightly from 5.1 to 4.9 for the 19 EZ economies as a whole between 2005 and 2014, reflecting the drop in kurtosis for the tradeable goods distribution from 5.347 to 5.224. Kurtosis is a measure of peakedness but also tailedness of the distribution. In the case of the distributions for 2005, higher kurtosis values are associated with fatter tails rather than higher peakedness6 in 2005 as compared to 2014, so we cannot infer that the degree of integration was lower in 2014 as compared to 2005
5We do not present these wage deviations in a Table here to save space but this is available upon request
6
based on the kurtosis values reported in Table 3. In fact, the higher peakedness of the distributions for 2014 as compared to 2005 for both tradeables and non-tradeables is evident in Figures 1 and 2.7
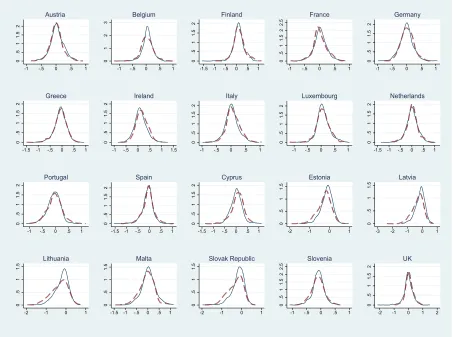
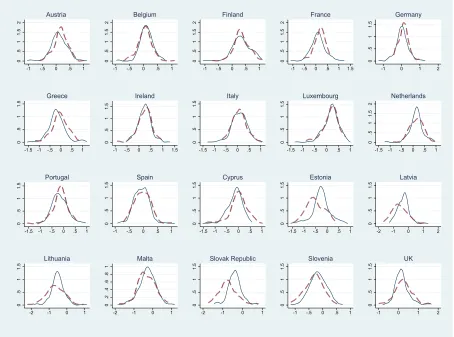
Next, we present the density functions for each of the 19 EZ economies and the UK in Figures 3 and 4. These graphs show an estimate of the density of good-by-good deviations from the LOP, qijt,
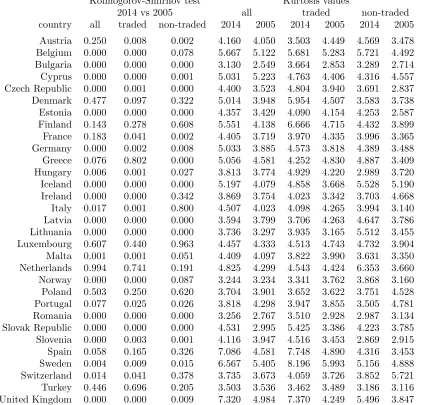
calculated as in equation (1), for 2005 and 2014 respectively the latest and earliest available dates before and after the incidence of the Crisis. Following that, in Table 4, we report the Kolmogorov-Smirnov test for the null of equality of these distribution functions for each country in 2014 and 2005 for the whole sample of goods, for traded, and for non-traded goods. In the last six columns of Table 4, we present kurtosis values for the LOP deviations distributions for each country for all goods, tradeables, and non-tradeables in 2005 and 2014.
In Figure 3, we present the density functions for each of the 19 EZ economies and the UK for traded goods. As we can see there, the density functions for the seven new EZ economies (Cyprus, Estonia, Latvia, Lithuania, Malta, the Slovak Republic and Slovenia) are more highly peaked around zero for 2014 as compared to 2005. Moreover, with the exception of Cyprus, there is a visible shift of the density function to the right for these EZ economies, suggesting tradeable goods became relatively more expensive there during the period consistent with the evidence in Table 2 for mean and median LOP deviations. As shown in Table 4, for all of these countries we reject the null that the distribution functions in 2014 and 2005 were identical. By contrast, for the original EZ countries, such as Finland, Greece, Luxembourg, the Netherlands, and Spain, we cannot reject the null that the distribution functions in 2014 and 2005 are identical. Furthermore, in Table 4 we can see that kurtosis fell for tradeables in Austria, France, Greece, Italy, Latvia, Luxembourg and
7We note that when we eliminate outliers by restricting the tails of the distributions with the support ranging
Malta. However, since the density functions for these countries are all visibly more highly peaked in 2014 as compared to 2005 in Figure 3, higher kurtosis values for 2005 in Table 4 merely indicate fatter tails in 2005 as compared to 2014 for these countries rather than a lower degree of market integration for tradeable goods.
In Figure 4, we present the density functions for each of the 19 EZ economies and the UK for non-traded goods. Figure 4 shows that for some countries like Austria, Finland, France, Germany, and Portugal, the density functions are visibly less highly peaked at zero for 2014 as compared to 2005, suggesting a lower degree of integration for non-traded goods after the incidence of the Crisis.8 As can be seen in Table 2, non-traded goods in Austria, France, Germany, and Portugal became overall relatively cheaper during this period, whereas in Finland they were little changed. For new EZ countries, density functions are more highly peaked at zero for 2014 as compared to 2005 in all cases except for Slovenia, suggesting a higher degree of integration for non-traded goods. As shown in Table 4, kurtosis fell for Cyprus, Ireland, Portugal and Slovenia. For Cyprus and Ireland this fall in kurtosis is associated with falling prices for non-tradeables relative to the EZ19 during this period, while in the case of Slovenia the fall in kurtosis is associated with non-tradeables prices rising relative to the EZ19. As we can see in Table 2, non-tradeables are becoming more expensive over this period in the majority of new EZ countries.
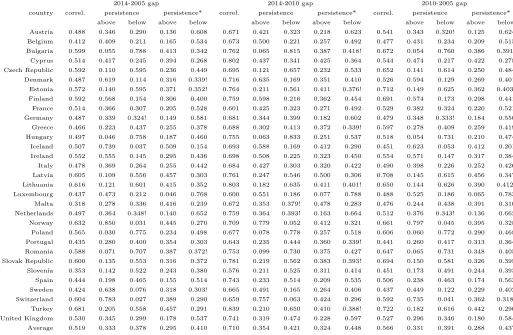
Finally, for the purposes of Table 5, we trace the exact position of each individual good in the distri-bution of LOP deviations in order to examine whether goods tend to remain systematically cheaper or more expensive in specific countries during the recent Crisis. Persistence of LOP deviations is defined here as the percentage of goods which were on the same side of the distribution (either above or below zero) for the pair of years being compared in each case. We trace the position of
8That kurtosis values are greater in 2014 as compared to 2005 for the first four countries, is in this case due to
these LOP deviations for individual tradeable goods over time to infer whether the revealed price advantage of a country tends to persist over time. We focus on internationally traded goods and even remove the effect of income in some cases in order to focus on the traded component.9 The
notion of price advantage we consider here will thus be plausibly closely related to trade.
Table 5 presents this measure of persistence and correlations between the LOP deviations of in-ternationally traded goods in different periods for 31 European countries. These correlations are calculated by pooling the LOP deviations in an ordered vector according to the matched goods identifier for every country for one period, then doing the same for the exact same goods and countries ordered in the same manner for a second period, and computing the correlation between any two such ordered vectors (periods).
The first thing we can observe from Table 5 is that the computed correlations across pairs of years are high (e.g. as high as 68% for Turkey for the 10-year gap between 2005 and 2014) and exhibit variation across EZ countries (from 32% in Malta to 62% in Lithuania for the same gap). Moreover, the correlations between 2010 and 2014 are greater on average and for each and every country separately as compared to the correlations between 2005 and 2010, with respective average correlations of 71% versus 57% for the first and second pair of years being compared.
Regarding our measure of persistence, we observe that the percentage of individual goods that were more expensive in a specific country for both 2014 and 2010, is comparable to the percentage of goods that were more expensive for both 2010 and 2005. For those countries where there was a visible change, this percentage typically went up e.g. from 43% to 50% in Belgium. As a result, the average persistence as captured by this percentage across all countries was 33% between 2005
9
and 2010, and 35% between 2010 and 2014. Strikingly, the cross-country average of the percentage of individual goods that were more expensive in both 2005 and 2014 was again 33%.
Finally, we calculate persistence of LOP deviations for non-tradeables. This is useful as if persis-tence values turn out to be higher for non-tradeables it would provide justification for the use of percentages as a proxy for persistence.10 Indeed, price advantage appears overall to be more
per-sistent for non-tradeables than for tradeables in relatively poorer countries, and price disadvantage more persistent for non-tradeables than for tradeables in relatively rich countries.11
Overall, our findings here suggest that rigidities that rendered certain goods more expensive for 2010 and 2005 in certain locations, were also largely in place in 2014 for those same locations. This is a particularly striking finding in the case of countries that faced problems and subsequently went through formal or informal adjustment programs, such us in Cyprus, Greece, Ireland, Italy, Portugal and Spain.
4
Conclusion
We have shown that the process of European integration as captured by the proximity of prices across EZ and European economies at large, continued during the Eurozone Crisis. Moreover, we have shown that individual economies adjusted via different channels during this period. For example, Greece’s adjustment occurred primarily via a relative fall in the price of non-tradeables but not tradeables relative to the rest of the EZ, whereas Ireland and Italy adjusted mostly via
10
We thank an anonymous referee of this journal for pointing this out. Results from this exercise are available upon request.
11
Compliance with Ethical Standards
Funding: No funding was received for this study.
Conflict of Interest: The authors declare that they have no conflict of interest.
References
[1] Allington, Nigel F.B., Paul A. Kattuman, and Florian A. Waldmann (2005) “One Market, One Money, One Price? Price Dispersion in the European Union,” International Journal of Central Banking 1(3), 73-115.
[2] Brock, W., and C. Hommes (1997) “A Rational Route to Randomness,”Econometrica 65,1059-1095.
[3] Crucini, Mario, Chris Telmer, and Marios Zachariadis, (2005) “Understanding European Real Exchange Rates,”The American Economic Review 95(3), 724-738.
[4] Dixit, A. (1989) “Hysteresis, Import Penetration and Exchange Rate Pass-Through, ” Quar-terly Journal of Economics 104, 205-28.
[5] Faber, R.P. and Stockman A.C.J. (2009) “A Short History of Price Level Convergence in Europe, ”Journal of Money Credit and Banking 41 (2-3), 461-477.
[6] Fischer, Christoph (2012) “Price Convergence in the EMU? Evidence from Micro Data,” Eu-ropean Economic Review 56(4), 757-776.
[7] Glushenkova, Marina and Marios Zachariadis (2016), “Understanding post-Euro Law-of-One-Price Deviations,”Journal of Money, Credit and Banking 48(6), 1073-1111.
[8] Guerreiro, David and Val´erie Mignon (2013) “On Price Convergence in Eurozone,” Economic Modelling 34(C), 42-51.
[9] Imbs, Jean, Haroon Mumtaz, Morten O. Ravn and H´el`ene Rey (2010) “One TV, One Price?”
Scandinavian Journal of Economics 112(4), 753-781.
[10] Inanc, Ozlem and Marios Zachariadis (2012) “The Importance of Trade Costs in Deviations from the Law of One Price: estimates based on the Direction of Trade,” Economic Inquiry
50(3), 667-689.
[11] Krugman, P. R. (1989) “Exchange Rate Instability,” (MIT: Cambridge).
[12] Lee Inkoo (2010) “Geographic Price Dispersion in Retail Markets: Evidence from Micro-Data,”
Journal of Macroeconomics 32(4), 1169-1177.
[13] Lee, Inkoo and J. Shin (2010) “Real Exchange Rate Dynamics in the Presence of Nontraded Goods and Transaction Costs,”Economics Letters106(3), 216-218.
[14] O’Connell, P.G.J., and S.-J. Wei (2002) “The Bigger They Are, the Harder They Fall: Retail Price Differences across US Cities, ”Journal of International Economics 56, 21-53.
[15] Parsley David, and S. J. Wei (2007) “A Prism into the PPP Puzzles: The Micro-Foundations of Big Mac Real Exchange Rates, ”The Economic Journal 117(523), 1336-1356.
[16] Parsley David and S. J. Wei (2008) “In Search of a Euro Effect: Big Lessons from a Big Mac Meal?”Journal of International Money and Finance 27, 260-276.
Table 1: Exemplary set of goods matched between 2005 and 2014
Description 2005 Description 2014
Cornflakes, KELLOGG’S, (Excl.: frosted, choco or oth.spec.Cornflakes), 250-500g Cornflakes, KELLOGG’S
Yoghurt drink, ACTIMEL (DANONE), multipack 4-6, 100-125g/ml per piece Yoghurt drink, multipack, DANONE Actimel Cheese, processed, KRAFT PHILADELPHIA, CLASSIC, Fat content: approx.70 %, 150-300g Cream cheese, KRAFT Philadelphia Classic Tinned White Beans, HEINZ, in tomato sauce, net weight 350-450g Tinned white beans in tomato sauce, HEINZ Coffee, instant, NESCAFE GOLD, 100 g Instant coffee, NESCAFE Gold
Tea, Earl Grey, TWININGS, approx. 25 enveloped bags Earl grey tea, TWININGS
Mint chocolate, AFTER EIGHT (NESTLE), plain dark chocolate with mint filling, 200 - 400 g Mint chocolate, After Eight, NESTLE Jellies, wine gum, HARIBO, any flavour, 100-230g Jellies, HARIBO
Tomato-ketchup, HEINZ, 300 - 600 g Tomato ketchup, HEINZ Mineral water, natural, EVIAN, 1 - 2 l Mineral water, EVIAN Energy drink, Red Bull, can - 250 ml Energy drink, RED BULL Carbonated drink, Coca Cola, 0.33 - 0.5 l COCA COLA, can
Spirit, Whisky - Scotch, JOHNNIE WALKER, Red label, 0.7 - 1 l Scotch whisky, JOHNNIE WALKER, Red label Spirit, Liqueur, BAILEYS ORIGINAL IRISH CREAM, 0.7 - 1 l Liqueur, BAILEYS, Original Irish cream Aperitif, Bitter Campari, BITTER CAMPARI, Package: bottle, 0.7-1l Aperitif, BITTER CAMPARI
Cigarettes, with filter, CAMEL, (Excl.: light) Cigarettes, with filter, CAMEL Men’s blue jeans - Levi’s 501 Men’s blue jeans, LEVI’S Parquet, oak layer, TARKETT Parquet, oak layer, TARKETT Baby’s high chair, STOKKE Baby’s high chair, STOKKE
Double bed, IKEA Double bed frame, IKEA, Malm
Wardrobe, IKEA Wardrobe, IKEA, Brimness
Sofa, IKEA, KLIPPAN Sofa, 2-seater, IKEA, Klippan Bookcase, artificial surface, IKEA Bookcase, artificial surface, IKEA, Billy
Mirror, IKEA Mirror, IKEA, Grundtal
Bathroom cabinet, IKEA Bathroom cabinet, IKEA, Hemnes
Refrigerator, WHIRLPOOL, ARC 1820 Refrigerator, with freezer, WHIRLPOOL ARC104
Vacuum cleaner, PHILIPS, FC 9126/20 Specialist for carpets Vacuum cleaner (dust bag) PHILIPS FC9170/FC9173/FC9176 Glass, wine, LUMINARC (consolidated under Arcoroc), any available e.g. Domino Glass, wine, LUMINARC/ARCOROC
Frying pan, TEFAL / T-FAL (trademark of SEB group), Ambiance - Essence - Activ Frying pan, TEFAL Reference or Talent Battery, DURACELL, Ultra M3 Alkaline MN 1500 - AA Mignon 1.5 Battery, DURACELL
Motor cars, Diesel engine OPEL (VAUXHALL) Astra 1.7 CDTI Ecotec (100cv) Motor car, diesel, OPEL / VAUXHALL Astra Motor cars, Petrol engine,<1,200cc NISSAN Micra 1.0 Motor car, petrol,<1,200cc, NISSAN Micra Motor cars, Petrol engine, 1,700 - 2,999cc AUDI A4 2.0 FSI Motor car, petrol, 1,700 - 2,999cc, AUDI A4 Motor cars, Petrol engine,>3,000cc BMW 7 series 735 i Motor car, petrol,>3,000cc, BMW 7 series Car battery VARTA Blue dynamic Car battery, VARTA Blue dynamic, 60 Ah
Compact digital camera, CANON, IXUS II Digital compact camera, CANON Digital Ixus 255 HS Tennis racket HEAD Radical Junior Tennis racket, HEAD Radical Junior
Doll, ZAPF, Baby Born Doll, ZAPF Baby Born
Magazine, monthly, COSMOPOLITAN, Magazine, monthly, Cosmopolitan Men’s wrist-watch; CITIZEN Wrist-watch, CITIZEN
Baby car seat; MAXI COSI Baby car seat, MAXI COSI Acetylsalicylic acid, ATC: B01AC06, Strength: 100 mg, 20 - 30 tablets / original Acetylsalicylic acid, original, 100mg Flight, International - Berlin, return ticket Flight, International - Berlin, return ticket Services, Cobbler - men’s classic shoes Shoe repair, men’s classic shoes
Plumber, hourly charge Plumber, hourly charge
Table 2: Mean and median LOP deviations
Income deviations Average LOP deviations Median LOP deviations
non-traded goods traded goods non-traded goods traded goods
Table 3: LOP deviations distribution characteristics and tests for the equality of distributions. Kolmogorov-Smirnov test Mean dispersion Kurtosis values
year 2014vs2005 2014 2005 2014 2005
EZ19 0.000 0.279 0.327 4.945 5.130
ALL 0.000 0.357 0.401 4.647 4.674
EZ19 TR 0.000 0.254 0.295 5.224 5.347
EZ19 NTR 0.000 0.384 0.459 3.574 3.617
ALL TR 0.000 0.322 0.361 4.915 4.954
ALL NTR 0.000 0.504 0.569 3.253 3.234
Table 4: LOP deviations distribution characteristics and tests for the equality of distributions for each country.
Kolmogorov-Smirnov test Kurtosis values
2014 vs 2005 all traded non-traded
country all traded non-traded 2014 2005 2014 2005 2014 2005
Austria 0.250 0.008 0.002 4.160 4.050 3.503 4.449 4.569 3.478 Belgium 0.000 0.000 0.078 5.667 5.122 5.681 5.283 5.721 4.492 Bulgaria 0.000 0.000 0.000 3.130 2.549 3.664 2.853 3.289 2.714 Cyprus 0.000 0.000 0.001 5.031 5.223 4.763 4.406 4.316 4.557 Czech Republic 0.000 0.001 0.000 4.400 3.523 4.804 3.940 3.691 2.837 Denmark 0.477 0.097 0.322 5.014 3.948 5.954 4.507 3.583 3.738 Estonia 0.000 0.000 0.000 4.357 3.429 4.090 4.154 4.253 2.587 Finland 0.143 0.278 0.608 5.551 4.138 6.666 4.715 4.432 3.899 France 0.183 0.041 0.002 4.405 3.719 3.970 4.335 3.996 3.365 Germany 0.000 0.002 0.008 5.033 3.885 4.573 3.818 4.389 3.488 Greece 0.076 0.802 0.000 5.056 4.581 4.252 4.830 4.887 3.409 Hungary 0.006 0.001 0.027 3.813 3.774 4.929 4.220 2.989 3.720 Iceland 0.000 0.000 0.000 5.197 4.079 4.858 3.668 5.528 5.190 Ireland 0.000 0.000 0.342 3.869 3.754 4.023 3.342 3.703 4.668 Italy 0.017 0.001 0.800 4.507 4.023 4.098 4.265 3.994 3.140 Latvia 0.000 0.000 0.000 3.594 3.799 3.706 4.263 4.647 3.786 Lithuania 0.000 0.000 0.000 3.736 3.297 3.935 3.165 5.512 3.455 Luxembourg 0.607 0.440 0.963 4.457 4.333 4.513 4.743 4.732 3.904 Malta 0.001 0.001 0.051 4.409 4.097 3.822 3.990 3.631 3.350 Netherlands 0.994 0.741 0.191 4.825 4.299 4.543 4.424 6.353 3.660 Norway 0.000 0.000 0.087 3.244 3.234 3.341 3.762 3.868 3.160 Poland 0.503 0.250 0.620 3.704 3.901 3.652 3.622 3.751 4.528 Portugal 0.077 0.025 0.026 3.818 4.298 3.947 3.855 3.505 4.781 Romania 0.000 0.000 0.000 3.256 2.767 3.510 2.928 2.987 3.134 Slovak Republic 0.000 0.000 0.000 4.531 2.995 5.425 3.386 4.223 3.785 Slovenia 0.000 0.003 0.001 4.116 3.947 4.516 3.453 2.869 2.915 Spain 0.058 0.165 0.326 7.086 4.581 7.748 4.890 4.316 3.453 Sweden 0.004 0.009 0.015 6.567 5.405 8.196 5.993 5.156 4.888 Switzerland 0.014 0.041 0.378 3.735 3.673 4.059 3.726 3.852 5.721 Turkey 0.446 0.696 0.205 3.503 3.536 3.462 3.489 3.186 3.116 United Kingdom 0.000 0.000 0.009 7.320 4.984 7.370 4.249 5.496 3.847
Table 5: Persistence of LOP Deviations by Country and Time Gap.
2014-2005 gap 2014-2010 gap 2010-2005 gap
country correl. persistence persistence* correl. persistence persistence* correl. persistence persistence* above below above below above below above below above below above below Austria 0.488 0.346 0.290 0.136 0.608 0.671 0.421 0.323 0.218 0.623 0.541 0.343 0.320! 0.125 0.624 Belgium 0.412 0.409 0.211 0.165 0.534 0.673 0.500 0.221 0.257 0.492 0.477 0.431 0.234 0.209 0.515 Bulgaria 0.599 0.055 0.788 0.413 0.342 0.762 0.065 0.815 0.387 0.418! 0.672 0.054 0.760 0.386 0.391! Cyprus 0.514 0.417 0.245 0.394 0.268 0.802 0.437 0.341 0.425 0.364 0.544 0.474 0.217 0.422 0.278 Czech Republic 0.592 0.110 0.595 0.236 0.449 0.695 0.121 0.657 0.232 0.533 0.652 0.141 0.614 0.250 0.484 Denmark 0.487 0.619 0.114 0.316 0.339! 0.716 0.635 0.169 0.351 0.410 0.526 0.594 0.129 0.269 0.401 Estonia 0.572 0.140 0.595 0.371 0.352! 0.764 0.211 0.561 0.411 0.376! 0.712 0.149 0.625 0.362 0.403! Finland 0.592 0.568 0.154 0.306 0.400 0.759 0.598 0.216 0.362 0.454 0.691 0.574 0.173 0.298 0.441 France 0.514 0.366 0.307 0.205 0.528 0.601 0.425 0.323 0.271 0.492 0.529 0.382 0.324 0.220 0.521 Germany 0.487 0.339 0.324! 0.149 0.581 0.681 0.344 0.399 0.182 0.602 0.479 0.348 0.333! 0.184 0.550 Greece 0.466 0.223 0.437 0.255 0.378 0.688 0.302 0.413 0.372 0.339! 0.597 0.278 0.409 0.259 0.419 Hungary 0.497 0.046 0.758 0.187 0.460 0.755 0.063 0.833 0.251 0.537 0.518 0.054 0.731 0.210 0.474 Iceland 0.507 0.739 0.037 0.509 0.154 0.693 0.588 0.169 0.412 0.290 0.451 0.623 0.053 0.412 0.201 Ireland 0.552 0.555 0.145 0.295 0.436 0.698 0.508 0.225 0.323 0.450 0.554 0.571 0.147 0.317 0.384 Italy 0.478 0.369 0.264 0.255 0.442 0.684 0.427 0.303 0.320 0.422 0.490 0.398 0.226 0.252 0.426 Latvia 0.605 0.109 0.556 0.457 0.303 0.761 0.247 0.546 0.500 0.306 0.708 0.145 0.615 0.456 0.347 Lithuania 0.616 0.121 0.601 0.415 0.352 0.803 0.182 0.635 0.411 0.401! 0.650 0.144 0.626 0.390 0.412! Luxembourg 0.437 0.473 0.212 0.046 0.768 0.600 0.551 0.186 0.077 0.788 0.488 0.525 0.186 0.065 0.783 Malta 0.318 0.278 0.336 0.416 0.239 0.672 0.353 0.379! 0.478 0.283 0.476 0.244 0.438 0.391 0.310 Netherlands 0.497 0.364 0.348! 0.140 0.652 0.759 0.364 0.393! 0.163 0.664 0.512 0.376 0.343! 0.136 0.662 Norway 0.632 0.850 0.031 0.445 0.270 0.709 0.779 0.052 0.412 0.321 0.661 0.797 0.045 0.395 0.328 Poland 0.565 0.030 0.775 0.234 0.498 0.677 0.078 0.778 0.257 0.518 0.606 0.060 0.772 0.290 0.468 Portugal 0.435 0.280 0.400 0.354 0.303 0.643 0.235 0.444 0.360 0.339! 0.441 0.260 0.417 0.313 0.364 Romania 0.588 0.071 0.707 0.387 0.372! 0.753 0.099 0.730 0.375 0.427 0.647 0.065 0.731 0.348 0.405 Slovak Republic 0.600 0.135 0.553 0.316 0.372 0.781 0.219 0.562 0.383 0.393! 0.694 0.150 0.581 0.326 0.395 Slovenia 0.353 0.142 0.522 0.243 0.380 0.576 0.211 0.525 0.311 0.414 0.451 0.173 0.491 0.244 0.393 Spain 0.444 0.198 0.465 0.155 0.514 0.743 0.233 0.514 0.209 0.535 0.506 0.238 0.463 0.174 0.563 Sweden 0.424 0.638 0.076 0.318 0.303! 0.665 0.491 0.165 0.264 0.406 0.437 0.449 0.122 0.229 0.402 Switzerland 0.604 0.783 0.027 0.389 0.290 0.659 0.757 0.063 0.424 0.296 0.592 0.735 0.041 0.362 0.318! Turkey 0.681 0.205 0.558 0.457 0.291 0.839 0.210 0.650 0.410 0.388! 0.722 0.182 0.616 0.442 0.290 United Kingdom 0.530 0.345 0.299 0.178 0.537 0.741 0.319 0.474 0.228 0.597 0.527 0.296 0.346 0.180 0.584 Average 0.519 0.333 0.378 0.295 0.410 0.710 0.354 0.421 0.324 0.448 0.566 0.331 0.391 0.288 0.437
0
.5
1
1.5
-2 -1 0 1 2
2014tr 2014nontr
2005tr 2005nontr
[image:21.612.140.474.122.360.2]2005-2014
Figure 1: Empirical Distributions of LOP Deviations for 31-country sample for Tradeables (tr) and Non-tradeables (nontr).
0
.5
1
1.5
2
-2 -1 0 1 2
2014tr 2014nontr
2005tr 2005nontr
2005-2014
[image:21.612.137.475.431.667.2]0
.5
1
1.5
2
-1 -.5 0 .5 1 Austria
0
1
2
3
-1 -.5 0 .5 1 Belgium 0 .5 1 1.5 2
-1.5 -1 -.5 0 .5 1 Finland 0 .5 1 1.5 2 2.5
-1 -.5 0 .5 1 France 0 .5 1 1.5 2
-1 -.5 0 .5 1 Germany 0 .5 1 1.5 2
-1.5 -1 -.5 0 .5 1 Greece 0 .5 1 1.5 2
-1 -.5 0 .5 1 1.5 Ireland 0 .5 1 1.5 2
-1 -.5 0 .5 1 Italy 0 .5 1 1.5 2
-1 -.5 0 .5 1 Luxembourg 0 .5 1 1.5 2
-1.5 -1 -.5 0 .5 1 Netherlands 0 .5 1 1.5 2
-1 -.5 0 .5 1 Portugal 0 .5 1 1.5 2
-1.5 -1 -.5 0 .5 1 Spain 0 .5 1 1.5 2
-1.5 -1 -.5 0 .5 1 Cyprus
0
.5
1
1.5
-2 -1 0 1 Estonia
0
.5
1
1.5
-3 -2 -1 0 1 Latvia
0
.5
1
1.5
-2 -1 0 1 Lithuania
0
.5
1
1.5
-1.5 -1 -.5 0 .5 1 Malta
0
.5
1
1.5
-2 -1 0 1 Slovak Republic 0 .5 1 1.5 2 2.5
-1 -.5 0 .5 1 Slovenia 0 .5 1 1.5 2
[image:22.612.81.534.227.564.2]-2 -1 0 1 2 UK
0
.5
1
1.5
2
-1 -.5 0 .5 1 Austria 0 .5 1 1.5 2
-1 -.5 0 .5 1 Belgium 0 .5 1 1.5 2
-1 -.5 0 .5 1 Finland 0 .5 1 1.5 2
-1 -.5 0 .5 1 1.5 France
0
.5
1
1.5
-1 0 1 2 Germany
0
.5
1
1.5
-1.5 -1 -.5 0 .5 1 Greece
0
.5
1
1.5
-1 -.5 0 .5 1 1.5 Ireland
0
.5
1
1.5
-1.5 -1 -.5 0 .5 1 Italy
0
.5
1
1.5
-1.5 -1 -.5 0 .5 1 Luxembourg 0 .5 1 1.5 2
-1.5 -1 -.5 0 .5 1 Netherlands
0
.5
1
1.5
-1.5 -1 -.5 0 .5 1 Portugal
0
.5
1
1.5
-1 -.5 0 .5 1 Spain
0
.5
1
1.5
-1.5 -1 -.5 0 .5 1 Cyprus
0
.5
1
1.5
-1.5 -1 -.5 0 .5 1 Estonia
0
.5
1
1.5
-2 -1 0 1 2 Latvia
0
.5
1
1.5
-2 -1 0 1 Lithuania 0 .2 .4 .6 .8 1
-2 -1 0 1 Malta
0
.5
1
1.5
-2 -1 0 1 Slovak Republic
0
.5
1
1.5
-1 -.5 0 .5 1 Slovenia
0
.5
1
1.5
[image:23.612.80.534.227.564.2]-1 0 1 2 UK