Proceedings Crop Protection in Northern Britain 2018
“THE BEES’ NEEDS”: USING MOLECULAR ANALYSIS OF BEE COLLECTED POLLEN TO UNDERSTAND WHICH PLANTS PLAY AN IMPORTANT ROLE IN HONEY BEE FORAGE
F Highet1, G Toteva1, M Downie2, M Peterson3, AJ Gray3 and A Reid1
1Science and Advice for Scottish Agriculture, Roddinglaw Road, Edinburgh, EH12 9FJ 2The University of Edinburgh, Kings Buildings, West Mains Road, Edinburgh, EH9 3JY
3The University of Strathclyde, Dept. of Mathematics and Statistics, 26 Richmond Street, Glasgow, G1 1XH
E-mail: [email protected]
Summary: Honey bees and other pollinators provide essential pollination services to agriculture and the environment; however they are under increasing pressure from changes in land management, disease and climate change. Current mitigation places emphasis on establishing flower meadows to improve nutritional diversity, but preserving what is already in place is also of importance. ‘CSI Pollen’ was a recent European citizen science project coordinated by COLOSS, investigating the diversity of pollen collected by honey bees in many countries across Europe. Volunteer beekeepers sampled pollen from colonies every three weeks during the foraging season over a two to three year period, creating a huge collection of data and samples. A selection of samples collected from 14 Scottish sites during the second year of study in 2015 were analysed by DNA fingerprinting to identify pollen gathered by honey bees at critical points of the colony’s life cycle; some results and potential implications for land use are discussed here.
INTRODUCTION
Pollinator decline has been well documented in scientific and mainstream press (Potts et al, 2010). Factors affecting pollinator success include land management (urbanisation, habitat fragmentation and agricultural practices including pesticide use), disease and climate change (IPBES, 2016). Initiatives such as the Pollinator Strategy for Scotland (SNH, 2017) aim to address these factors but require high quality information to better inform decision making, improve advice and develop appropriate agri-environment incentives.
Current guidelines encourage establishing new forage sources for bees, such as flower meadows. Whilst nutritional diversity may be critical for pollinator health, our understanding of the specific nutritional needs of pollinators is still in development (Filipiak et al, 2017, Di Pasquale et al, 2013). Understanding and preserving the modern landscape features which are currently used by pollinators may also be an important aspect of supporting their health. European honey bees (Apis mellifera) are social insects, living in colonies of approximately 20-40,000 individuals. A colony of honey bees, much like other pollinators, requires a balance of nectar and pollen to feed the various life stages of the colony. Honey bees use collective decision making to utilise the most profitable forage sources in the local environment (Seeley et al, 2009). By studying the identity of pollen balls collected from the legs of incoming foragers we can gain insight into these decisions and the nutritional availability within their local environment.
(http://www.coloss.org/ ). A citizen science project known as ‘CSI Pollen’ was devised and
co-ordinated by members of COLOSS during 2014-16 to investigate the diversity of pollen available across Europe. Pollen was collected across the foraging season, sorted by colour, part-identified and results related to local land use. Results are still being analysed but this paper aims to highlight the potential of this and similar studies to better understand nutritional availability for honey bees and other pollinators in the modern environment.
MATERIALS AND METHODS
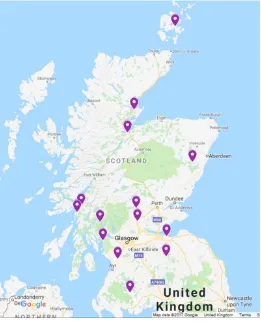
Scottish beekeepers were contacted through beekeeping literature and networks in early 2014 and suitable volunteers were recruited, with sites (apiaries) located across Scotland; three colonies from each were sampled. Hives were adapted to allow attachment of pollen traps to the entrance of colonies during sampling periods. When attached, these traps removed pollen balls from the legs of foraging bees as they returned to the colony. Sampling occurred every three weeks during the active foraging season; if a colony was not considered to be in a state to allow sampling to take place (for instance it had low food stores) or the beekeeper was unavailable, then the colony was not included in the sampling event. Excess pollen was removed from samples weighing over approximately 20g (a ‘jar lid’); the remainder was dried and then stored at -20C.
[image:2.595.168.429.395.717.2]Following analysis as part of CSI Pollen (Gray et al, in preparation), available samples collected from Scottish colonies during 2015 (Figure 1) and 2016 were sent to SASA. In total 389 samples were received at SASA (235 samples collected in 2015 and 134 in 2016).
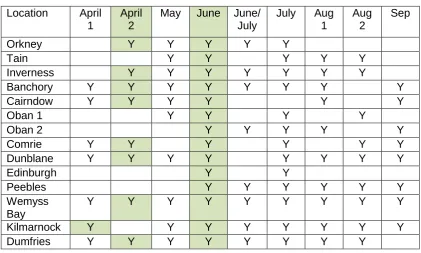
As limited resources were available for analysis, pollen was identified from selected samples chosen to reflect important periods in the seasonality of honey bee colonies. April samples were used to investigate nutritional availability during colony build up and June samples tested as beekeepers often report a lack of forage availability during this month. Samples tested are highlighted in Table 1.
Table 1. 2015 samples collected – Y indicates sampling occurred; highlighted boxes indicate samples taken for analysis. Location April
1
April 2
May June June/ July
July Aug 1
Aug 2
Sep
Orkney Y Y Y Y Y
Tain Y Y Y Y Y
Inverness Y Y Y Y Y Y Y
Banchory Y Y Y Y Y Y Y Y
Cairndow Y Y Y Y Y Y
Oban 1 Y Y Y Y
Oban 2 Y Y Y Y Y
Comrie Y Y Y Y Y Y
Dunblane Y Y Y Y Y Y Y Y
Edinburgh Y Y
Peebles Y Y Y Y Y Y
Wemyss Bay
Y Y Y Y Y Y Y Y Y
Kilmarnock Y Y Y Y Y Y Y Y
Dumfries Y Y Y Y Y Y Y Y
A sub-sample of 24 pollen balls was taken from each of the selected samples. Pollen was identified using DNA fingerprinting methods adapted from Fazekas et al, 2012 and Taberlet et al 1991(Reid et al, in preparation).
To determine the accuracy of molecular identifications, a further 96 pollen ball samples were split in two; one part analysed using molecular methods and the other identified by microscopy using methods described in Maurer, 2012.
RESULTS
Microscopic confirmation of molecular identifications
Microscopic analysis confirmed the molecular identification of pollen balls to genus or family in all but three samples (97% accuracy); although in 15 samples (16%) the pollen identified by molecular methods was not the predominant species present. An average of 98% of all the pollen contained within a pollen ball was from the predominant species.
April samples
(Prunus spp.) and willow (Salix spp.) were also commonly found at most sites (8/9 sites and 6/9 sites respectively).
[image:4.595.91.504.165.328.2]
Table 2. Identification of randomly selected pollen balls from samples collected in April 2015. Site locations listed by latitude from north to south.
Location Ulex sp. Prunus. spp.
Salix spp.
Skimmia spp.
OTHERS TOTAL
Orkney 11 0 0 0 10 21
Inverness 8 13 0 0 3 24
Banchory 18 4 1 0 1 24
Comrie 17 7 0 0 0 24
Dunblane 8 8 7 0 0 23
Cairndow 11 5 3 1 4 24
Wemyss Bay 10 1 5 7 1 24
Kilmarnock 13 1 7 0 0 21
Dalry 6 5 5 3 3 22
TOTAL 102 44 28 11 22 207
June samples
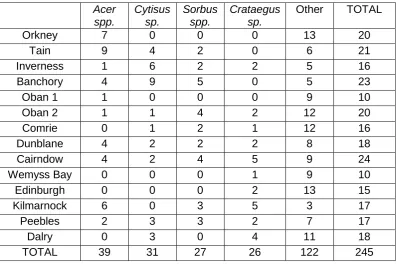
Up to 24 pollen balls were selected from 14 colonies and each ball was identified by molecular analysis. Results are tabulated in Table 3. Tree pollens, predominantly Acer (Acer spp.) and Rowan (Sorbus spp.), were identified as the main source of pollen (33%); shrubs and hedgerow plants, predominantly Broom (Cytisus sp.) and Hawthorn (Crataegus sp.), were present in 30% of pollen balls tested.
Table 3. Identification of selected pollen balls from samples collected in June 2015. Site locations listed by latitude from north to south.
Acer spp.
Cytisus sp.
Sorbus spp.
Crataegus sp.
Other TOTAL
Orkney 7 0 0 0 13 20
Tain 9 4 2 0 6 21
Inverness 1 6 2 2 5 16
Banchory 4 9 5 0 5 23
Oban 1 1 0 0 0 9 10
Oban 2 1 1 4 2 12 20
Comrie 0 1 2 1 12 16
Dunblane 4 2 2 2 8 18
Cairndow 4 2 4 5 9 24
Wemyss Bay 0 0 0 1 9 10
Edinburgh 0 0 0 2 13 15
Kilmarnock 6 0 3 5 3 17
Peebles 2 3 3 2 7 17
Dalry 0 3 0 4 11 18
[image:4.595.100.497.488.752.2]Pollen diversity
Only 13 plant species were identified from the 9 sites during April sampling. Gorse was identified in almost half of the 207 samples analysed. Although not directly comparable, June samples were more diverse, with 32 species identified from 14 sites and the predominant species (Acer) making up just 16% of the samples analysed.
Figure 3. Identification of pollen balls collected from Scottish apiaries during April 2015 (n=207) and June 2015 (n=245).
DISCUSSION
This cursory glance into the full set of samples collected already gives us some insight into the foraging choices made by honey bees in Scotland. This may indicate nutritional choices made by the bees or simply what is currently available in the local environment.
Pollen identified from April samples indicated a strong preference for gorse, a shrub freely available across the Scottish landscape in spring which can provide a good nutritional source (Filipiak et al, 2017) and may be resilient in the face of climate change due to its extended flowering season. Current agricultural policy encourages the removal of dense gorse coverage to prevent incursion into grazing areas, however this plant may play an important role in pollinator nutrition in Scotland.
During both sampling periods, trees, shrubs and hedgerow plants made up a large amount of the pollens identified within samples. These plants provide large volumes of pollen and nectar but may be under-recorded in the type of flower visitation studies generally used to ascertain pollinator foraging choices (Fowler et al, 2016). Trees and shrubs may again provide some nutritional resilience during periods of heavy rainfall or drought and may be of considerable importance to honey bees and other pollinators.
Although plants providing large volumes of pollen and nectar were common in the pollen analysed and only a small part of the sample was analysed, it is important to note that no sample tested was homologous. Even when a single nearby plantation or crop could provide the volume of food required by a honey bee colony, they seek nutritional diversity on a daily basis.
A depth of understanding of specific nutritional requirements for honey bees and native pollinators is required to fully inform environmental improvements for pollinators. However, even this brief glimpse into the foraging behaviour of honey bees highlights the importance of
April Ulex sp.
Prunus spp.
Salix spp.
June Acer spp.
Cytisus sp.
maintaining trees and shrubs as well as improving nutritional diversity. Land managers are faced with many conflicting priorities but preserving what is already present in our natural environment may be a first step to land management with pollinators in mind.
ACKNOWLEDGEMENTS
The authors would like to thank all of the beekeepers who collected pollen from their colonies and also those volunteers who sorted and identified pollen to help validate the molecular methods. We would also like to extend our thanks to SASA staff and Ziggy MacNaughton for their help with processing pollen samples, taxonomic identification and developing an image database of pollen samples. Pollen traps were funded by SASA and the C.B. Dennis British Beekeepers Research Trust.
REFERENCES
Di Pasquale G, Salignon M, Le Conte Y, Belzunces LP, Decourtye A, Kretzschmar A, Suchail S, Brunet J-L and Alaux C, 2013. Influence of Pollen Nutrition on Honey Bee Health: Do Pollen Quality and Diversity Matter? PLoS ONE 8(8): e72016.
Fazekas, AJ, Kuzmina, ML Newmaster, SG and Hollingsworth, PM, 2012. DNA Barcoding Methods for Land Plants. W. John Kress and David L. Erickson (eds.), DNA Barcodes: Methods and Protocols, Methods in Molecular Biology, vol. 858, DOI 10.1007/978-1-61779-591-6_11, © Springer Science+Business Media, LLC 2012
Filipiak M, Kuszewska K, Asselman M, Denisow B, Stawiarz E, Woyciechowski M and Weiner, J, 2017. Ecological stoichiometry of the honeybee: Pollen diversity and adequate species composition are needed to mitigate limitations imposed on the growth and development of bees by pollen quality. PLoS ONE 12(8): e0183236.
Fowler RE, Rotheray EL and Goulson D, 2016. Floral abundance and resource quality influence pollinator choice. Insect Conservation and Diversity 9:6, 481-494.
IPBES, 2016. The assessment report of the Intergovernmental Science-Policy Platform on Biodiversity and Ecosystem Services on pollinators, pollination and food production. Secretariat of the Intergovernmental Science-Policy Platform on Biodiversity and Ecosystem Services, Bonn, Germany. 552 pages.
Maurer B, 2012. Practical Microscopy for Beekeepers.
Potts SG, Biesmeijer JC, Kremen C, Neumann P, Schweiger O and Kunin WE, 2010. Global pollinator declines: trends, impacts and drivers. Trends in Ecology and Evolution Vol 25, Issue 6, 345-353.
Seeley TD, Camazine S and Sneyd J, 2009. Collective decision-making in honey bees:
how colonies choose among nectar sources. Behavioral Ecology and Sociobiology 28, 277-290.
SNH, 2017. A pollinator strategy for Scotland 2017-2027. Accessed on-line 9/12/2017
https://www.snh.scot/sites/default/files/2017-10/A2360102-Pollinator-strategy-2017-2027.pdf