R E S E A R C H A R T I C L E
Open Access
Recognizing spatial and temporal clustering
patterns of dengue outbreaks in Taiwan
Wei-Ting Lai
1, Chien-Hsiun Chen
2,3, Hsin Hung
4, Ray-Bing Chen
1, Sanjay Shete
5,6and Chih-Chieh Wu
4*Abstract
Background:Dengue fever is the most common arboviral infection in humans, with viral transmissions occurring
in more than 100 countries in tropical regions. A global strategy for dengue prevention and control was established more than 10 years ago. However, the factors that drive the transmission of the dengue virus and subsequent viral infection continue unabated. The largest dengue outbreaks in Taiwan since World War II occurred in two recent successive years: 2014 and 2015.
Methods:We performed a systematic analysis to detect and recognize spatial and temporal clustering patterns of dengue incidence in geographical areas of Taiwan, using the map-based pattern recognition procedure and scan test. Our aim was to recognize geographical heterogeneity patterns of varying dengue incidence intensity and detect hierarchical incidence intensity clusters.
Results:Using the map-based pattern recognition procedure, we identified and delineated two separate
hierarchical dengue incidence intensity clusters that comprise multiple mutually adjacent geographical units with high dengue incidence rates. We also found that that dengue incidence tends to peak simultaneously and homogeneously among the neighboring geographic units with high rates in the same cluster.
Conclusion:Beyond significance testing, this study is particularly desired by and useful for health authorities who require optimal characteristics of disease incidence patterns on maps and over time. Among the integrated components for effective prevention and control of dengue and dengue hemorrhagic fever are active surveillance and community-based integrated mosquito control, for which this study provides valuable inferences. Effective dengue prevention and control programs in Taiwan are critical, and have the added benefit of controlling the potential emergence of Zika.
Keywords:Dengue, Hierarchical, Spatial clustering, Temporal clustering, Zika
Background
The global emergence and resurgence of epidemic arbo-viruses such as dengue and Zika have been dramatic in recent years. Dengue fever is the most common arbo-viral infection in humans, with arbo-viral transmission occur-ring in more than 100 countries in tropical regions. It is estimated that 390 million dengue infections occur an-nually, of which 50–100 million cases have apparent clinical manifestations [1–3]. The geographical areas in which transmission of the dengue virus is common have been expanding over the past few decades and all four
dengue virus serotypes (DENV1–DENV4) now circulate in Asia, the Americas, and Africa [4]. Compared with other tropical infectious diseases, dengue has a relatively low mortality; however the large scale of human suffer-ing and economic resources used for dengue prevention and control makes it a major global public health prob-lem [1,5,6]. There are several factors that contribute to the increased frequency and magnitude of dengue fever and the emergence of dengue hemorrhagic fever, a se-vere form of the disease. The most important factors are unprecedented growth of human population, unplanned and uncontrolled urbanization, a lack of effective vector control, and globalization [7,8].
The geographical extension of dengue viral transmis-sion has followed the increased geographic distribution
* Correspondence:[email protected]
4Department of Environmental and Occupational Health, College of Medicine, National Cheng Kung University, 1 University Road Tainan, 701 Tainan, Taiwan
Full list of author information is available at the end of the article
and population densities of Aedes aegypti, the principal mosquito vector, which transmits dengue viruses in urban areas of the tropics [7]. Even though great pro-gress has been made in dengue research, particularly in identifying and treating dengue and understanding the structure and replication of the virus, we still do not fully understand why most individuals do not have com-plications while others experience a severe and fatal hemorrhagic disease. Many unanswered questions re-main regarding the virus-host interaction, immune path-ology, and influence of genetic variation in the host and virus [9].
Taiwan is infested with both Ae. aegypti and Aedes albopictus (a secondary mosquito vector), which trans-mit dengue viruses. The two largest dengue outbreaks in Taiwan since World War II occurred recently, with 15,492 autochthonous cases confirmed in 2014 and 43,419 cases confirmed in 2015. Dengue cases nearly disappeared from the island of Taiwan for 40 years until an outbreak of 4389 cases occurred in 1988. In addition to an outbreak of 5336 cases in 2002, a few small out-breaks occurred between 1989 and 2013. Before World War II, large dengue outbreaks were reported in 1915 and 1931 [10,11].
Accurately recognizing geographical discrepancies and heterogeneity in dengue incidence patterns and detect-ing the geographical areas in which the exposure to en-vironmental or viral agents may be responsible for intense dengue incidence will inform disease control and prevention efforts and provide important insights into the etiology of this disease. In this study, we used the map-based pattern recognition procedure and scan test to systematically explore geographical and temporal clustering patterns of dengue incidence in an analysis of Taiwan’s dengue outbreaks in 2014 and 2015. The map-based pattern recognition procedure is designed to recognize hierarchical incidence intensity patterns for some disease over geographical spaces by searching for hierarchical (in intensity) clusters of mutually adjacent areas with high rates [12]. The procedure incorporates information about the intensity rank order into the or-dinary adjacency-based test statistic [13], which is de-signed to analyze data from irregularly arranged and shaped geographic units like the irregular county bound-aries within a US state.
Our analysis of the largest Taiwan dengue outbreak in 2015 showed that multiple geographic units with the highest rates of dengue incidence significantly aggre-gated into 2 separate geographical areas located in Tainan and Kaohsiung in southern Taiwan. More im-portantly, we determined 3 distinct groups within these geographic units that had the highest dengue incidence rates according to their intensity and delineated 2 separ-ate clusters of hierarchical dengue incidence intensity.
Using the scan test, we found that dengue incidence tended to peak simultaneously and homogeneously among the neighboring geographic units with high rates in the same cluster [14].
Methods
Study population
Dengue fever is a notifiable communicable disease in Taiwan. Information on dengue cases collected in Taiwan since 1988 is publicly available through the Taiwan Cen-ters for Disease Control (http://www.cdc.gov.tw/english/ index.aspx) and the Taiwan Government Open Data web-site (http://data.gov.tw/en). This information includes the date an individual was diagnosed with dengue infection and his or her residence at diagnosis, place of infection, gender, and age. The study population used for this investigation is patients with laboratory confirmed autochthonous dengue infection, which thus excludes imported cases of dengue. The spectrum of clinical presentations of dengue infection with any one of the 4 viral types is broad. Thus, laboratory confirmation of dengue infection is crucial. Confirmed den-gue viral infection in Taiwan is based on a positive diagno-sis from any one of 4 laboratory tests: virus isolation, nucleic acid amplification tests, antigen detection, and sero-logical tests. Data on the place where the infection occurred are used in the analysis. If they are unavailable, the individ-ual’s residence at diagnosis is used. Information on the daily local climate variables, including temperature, rainfall, and relative humidity, is available from Taiwan’s Central Weather Bureau (https://www.cwb.gov.tw/eng/index.htm).
Tainan and Kaohsiung are the two largest cities in the southern, tropical region of Taiwan. Kaohsiung is bigger than Tainan in population and area, with 2.78 million residents and 2952 km2. Tainan has a population of 1.89 million and 2192 km2.Ae. aegypti, is dispersed primarily in Tainan, Kaohsiung, and the area to the south of these cities. Ae. albopictus, has a widespread distribution throughout most of Taiwan.
Map-based pattern recognition procedure for hierarchical clusters of disease
The method developed by Mantel [15] was generalized by Cliff and Ord, who proposed the test statistic B = (1/
2)Σ ωijxixjwherexi= 1if areaiis a high-risk area for
some disease and0otherwise, and whereωij= 1if areas
iandjare mutually adjacent geographically and0 other-wise,ωij=ωji,ωii= 0[16]. The sum ranges over all pairs
of areas. It is an adjacency-based test statistic that mea-sures spatial autocorrelation for binary data and uses the distribution of the number of adjacencies of geographic units. When high-risk areas tend to be geographically adjacent to each other, the value of Btends to be large. Using the test statistic B, one can test the null hypoth-esis of the random allocation of high-risk areas over the geographical region; that is, high-risk areas do not clus-ter. Cliff and Ord derived the expressions for the mean and variance of B under the assumptions of binomial and hypergeometric distributions [13].
Instead of selecting a specific threshold rate of inci-dence, the map-based pattern recognition procedure proposes to first list the areas under study in rank order based on the disease intensity rates [12]. It starts with classifying the 2 top ranking areas as high-risk areas and calculates the value of B. Subsequently, the procedure includes the area with the 3rd highest rate and the other 2 areas with higher rates as high-risk areas and calcu-lates the corresponding value of B. The p-value is the probability thatBis equal to or higher than the observed number of adjacencies involved between these 3 areas with the highest disease intensity rates. The procedure proceeds successively, including exactly one area with high rate according to the rank order and the other
areas with higher rates as high-risk areas at each step with the use ofB.
Therefore, the procedure provides the p-value of B when the k top ranking areas among all areas under study are classified as high-risk areas for eachkwherek
= 2, 3, 4….. The procedure can classify as many areas as high-risk areas as possible; however, it is unlikely that one would inquire about the possibility of clusters of more than 20% high-risk areas. The main feature of the procedure is to determine the hierarchical incidence in-tensity pattern through the distribution ofp-values fork
= 2, 3, 4…, which will be illustrated in Results.
[image:3.595.58.539.84.317.2]distribution for small values ofk, because the values of the mean and variance are close, as shown in Table1.
Scan test
The scan test is frequently used to detect disease cluster-ing over a temporal series and is structured to test for the largest cluster. The scan test employs a moving win-dow of pre-determined length and finds the maximum number of cases of disease revealed through the window
as it slides over the entire period. The scan statistic is the maximum number of events in a window (t, t+w), wherewis the pre-determined window size asttakes on all values in a certain time frame. The model of the scan test that we applied here is based on the assumption of a uniform distribution of events [14]. Here, the scan test was used to test for clustering of dengue incidence and detect the date of the occurrence of maximum dengue incidence in a district.
[image:4.595.59.538.88.583.2]Results
2015 Tainan and Kaohsiung dengue outbreak
Tainan and Kaohsiung are geographically adjacent to each other and, therefore, are considered as a single geo-graphical region. The rates, which were the numbers of dengue cases per 100,000 persons, ranged from 0 to 4497 among the 75 districts. Fig. 3a presents the district-specific dengue incidence intensity. We used a cut-off point of 908 in the rates to dichotomize because
the difference of 152 between 908 and the next lowest rate of 756 is largest in comparison with the difference between the rates of any other two districts among the upper spectrum of rates, except for the top 5 rates. There were exactly 14 districts with a rate equal to 908 or higher. In this analysis, at most 14 districts with the highest rates were classified as high-risk districts using the map-based pattern recognition procedure. Fifty-five districts or 73% (= 55/75) had rates of 480 or lower.
[image:6.595.58.537.198.703.2]The 14 top ranking districts are listed by rank accord-ing to their rates in Table 2. With each district with a high rate, Table2gives the rate, the observed value ofB (= the observed number of adjacencies involved between the district and districts with higher rates), and the
p-value (determined from the distribution in Table 1). When the (k=) 2 top ranking districts in Table 2(West Central and North districts) are classified as the high-risk districts and the remaining 73 districts are not, the observed value ofBis equal to 1, giving a p-value =
Pr(B≥1│k= 2) = 0.066183 (= 66,183/1 million from Table1), shown in the 3rd row of Table2. Table2 gives the p-value when the k top ranking districts are classi-fied as high-risk districts for k= 2, 3, 4… 14. Low
p-values were found for each high-risk district listed in Table 2, except for the North district shown in the 3rd row. The null hypothesis of the randomization of k dis-tricts with the highest rates was rejected at a nominal significance level of 0.05 for 3≤k≤14; that is, thek dis-tricts with the highest rates showed significant clustering based on B. We also provide the p-values in Table 2
based on the Poisson approximation fork≤7.
We note that lower p-values ofBindicate high degrees of clustering, which conform to the adjacency-based def-inition of a cluster [12, 13]. In Table 2, the p-values of the 14 high-risk districts appear to be cycling over the rates and are at their relative lowest at the points where the East and Anping districts enter the ranking. We ob-served a relatively low p-value of 0.000121 when we in-cluded the East district (4th in rank) and the other 3 districts with higher rates. In this scenario, the number
of high-risk districts was 4 and the observed value ofB was 5, giving a p-value =Pr(B≥5│k= 4) = 0.000121 (= 121/1 million from Table1), shown in the 5th row. The p-value jumped to 0.000706 when we included the Qianzhen district (5th in rank) as a high-risk district be-cause the number of high-risk districts became 5 and the observed value ofBremained 5, as shown in the 6th row. The 4 top ranking districts are located in Tainan while the Qianzhen district is in Kaohsiung. The next relatively lower p-value ofPr(B≥7│k= 6) = 0.000077 (= (66 + 10 + 1)/1 million from Table1) occurred by includ-ing the Anpinclud-ing district (6th in rank) and the other 5 dis-tricts with higher rates, leading to the number of high-risk districts = 6 and the observed value ofB= 7, as shown in the 7th row of Table2.
[image:7.595.59.539.488.699.2]Correspondingly, we determined the 3 groups of dis-tricts to use in constructing hierarchical clusters of mu-tually neighboring high-risk districts with different levels of intensity using the map-based pattern recognition method [12]. Level-1 districts are the 4 top ranking dis-tricts in Table 2 (West Central, North, South, and East districts). Level-2 districts are Qianzhen and Anping, which are respectively the 5th and 6th by rank. Level-3 districts are the 8 districts that rank from 7 to 14. When the level-specific intensity is placed on the map, 2 hier-archical dengue incidence intensity clusters clearly emerge and are located in the urban areas of Tainan and Kaohsiung, respectively, as shown in Fig. 3b. The first cluster geographically expands from the 4 Level-1 dis-tricts to 7 mutually adjacent high-risk disdis-tricts. This geo-graphical area displays the highest dengue incidence
Table 2Cluster Statistic for Districts with the High Rates in 2015 Tainan and Kaohsiung Combined
Cityb District Ratea Rank Order Risk Level StatisticB P-value* P-value**
0 West Central 4497 1 1
0 North 4313 2 1 1 0.066183 0.063869
0 South 2785 3 1 2 0.008758 0.017360
0 East 1673 4 1 5 0.000121← 0.000059
1 Qianzhen 1415 5 2 5 0.000706 0.000621
0 Anping 1401 6 2 7 0.000077← 0.000080
1 Sanmin 1350 7 3 7 0.000561 0.000610
1 Lingya 1290 8 3 9 0.000126 –
1 Qianjin 1187 9 3 11 0.000030 –
0 Yongkang 1159 10 3 13 0.000011 –
1 Yancheng 1107 11 3 16 0.000001 –
1 Gushan 1000 12 3 18 < 10−6
–
0 Annan 984 13 3 22 < 10−6
–
1 Xinxing 908 14 3 25 < 10−6
– a
Number of Dengue Cases per 100,000 Persons
b
0 indicates Tainan; 1, Kaohsiung *P-value from Table1
intensity, accounting for 50% of dengue cases. In com-parison, the second cluster that consists of the other 7 high-risk districts explains 28% of dengue incidence.
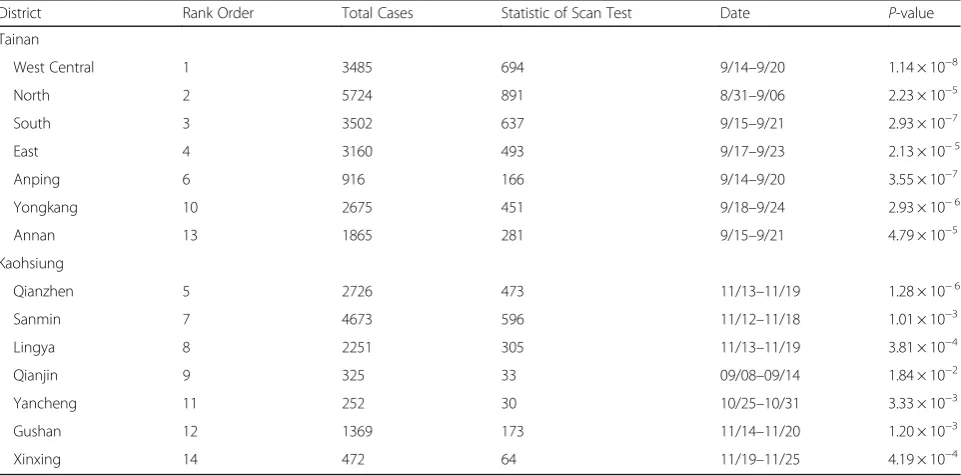
The scan test was used not only to determine the clus-tering of the dengue incidence but also to identify the date of the occurrence of maximum incidence in a high-risk district. Using a window width of 7 days and the time period from week 24 to week 52 of 2015, the scan test was applied to each of the 14 top ranking dis-tricts. A very small p-value for the scan test was ob-tained for each of the 7 high-risk districts in Tainan, as shown in Table 3. More importantly, the date of occur-rence of the district-specific largest dengue cluster (max-imum dengue cases over any 7 consecutive days in a high-risk district) overlapped on 09/18–09/20 among 6 of the 7 adjacent high-risk districts, indicating that the 2015 Tainan dengue outbreak peaked almost simultan-eously and homogensimultan-eously among the geographically neighboring high-risk districts. A similar phenomenon was observed in Kaohsiung, as shown in Table 3. The peaks of incidence for 5 high-risk districts were during a 2-week period of 11/12–11/25.
2014 Kaohsiung dengue outbreak
We used the same approaches to study the pattern and distribution of dengue incidence in 2014 Kaohsiung alone. Each of the 6 distributions ofBfor k= 2, 3…7 is shown in Additional file 1: Table S1. Correspondingly, Table 4 gives the rate, observed value ofB, and p-value (determined from the distribution in Additional file
1:Table S1) for each of the 7 top ranking districts. Small
p-values were found by including 4 or more districts
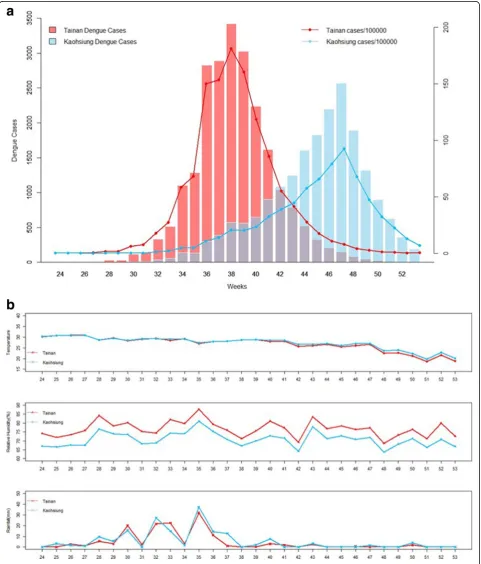
with the highest rates. These 7 top ranking districts ac-count for 81% of the 2014 Kaohsiung dengue incidence. The weekly distributions of the frequency and rate in 2014 and 2015 in Kaohsiung are given in Additional file2: Figure S1A. Applying the scan test to each of the 7 high-risk district in the same setting, Additional file 1: Table S2 presents the results, indicating that 4 of the 7 high-risk districts had the date of occurrence of the district-specific largest dengue cluster during a period of 10/15–10/25.
Effects of temperature, rainfall, and relative humidity
[image:8.595.305.540.110.222.2]Local weather affects dengue viral transmission and in-fection [17]. The effects of local climate variables on dengue incidence were considered, including temperature, rainfall, and relative humidity. All 3 local climate vari-ables were similar in Tainan and Kaohsiung. This
Table 3Analysis of Scan Test for Each of 14 Risk Districts in 2015 Tainan and Kaohsiung
District Rank Order Total Cases Statistic of Scan Test Date P-value
Tainan
West Central 1 3485 694 9/14–9/20 1.14 × 10⁻⁸
North 2 5724 891 8/31–9/06 2.23 × 10⁻⁵
South 3 3502 637 9/15–9/21 2.93 × 10⁻⁷
East 4 3160 493 9/17–9/23 2.13 × 10⁻⁵
Anping 6 916 166 9/14–9/20 3.55 × 10⁻⁷
Yongkang 10 2675 451 9/18–9/24 2.93 × 10⁻⁶
Annan 13 1865 281 9/15–9/21 4.79 × 10⁻⁵
Kaohsiung
Qianzhen 5 2726 473 11/13–11/19 1.28 × 10⁻⁶
Sanmin 7 4673 596 11/12–11/18 1.01 × 10⁻³
Lingya 8 2251 305 11/13–11/19 3.81 × 10⁻⁴
Qianjin 9 325 33 09/08–09/14 1.84 × 10⁻²
Yancheng 11 252 30 10/25–10/31 3.33 × 10⁻³
Gushan 12 1369 173 11/14–11/20 1.20 × 10⁻³
Xinxing 14 472 64 11/19–11/25 4.19 × 10⁻⁴
Table 4Cluster Statistic for Districts with the High Rates in 2014 Kaohsiung
District Ratea Rank Order StatisticB P-value* P-value**
Sanmin 1146 1
Qianzhen 1029 2 0 1 1
Xinxing 904 3 1 0.320838 0.299527
Lingya 872 4 4 0.004213 0.006101
Xiaogang 729 5 8 0.005743 0.007413
Qianjin 622 6 5 0.000371 –
Fengshan 615 7 11 0.000041 –
a
[image:8.595.58.539.494.732.2]finding is not surprising as the 2 cities are mutually adjacent. As seen in Fig. 4a, b, relative humidity was consistently higher in Tainan than in Kaohsiung by at most 10% over the outbreak period, and no appreciable
difference in temperature and rainfall was observed in 2015. The local weather did not seem to have an effect on the difference in intensity between the 2 distinct hierarch-ical clusters. The Tainan dengue outbreak peaked on week
[image:9.595.58.540.143.708.2]38 of 2015, with 3422 dengue cases; the Kaohsiung dengue outbreak peaked on week 47, with 2571 cases. The corre-sponding rate in Tainan was 181 cases per 100,000 per-sons, which was nearly twice the rate of 93 cases per 100,000 persons on week 47 in Kaohsiung. While no ap-preciable change in the local weather between 2014 and 2015 was observed in Kaohsiung, as shown in Additional file2: Figure S1B, poor environmental management for ef-fective integrated vector controls may be responsible for the worse dengue outbreak and later date of peak inci-dence occurred in 2015 Kaohsiung.
Discussion
Historically, Tainan and Kaohsiung experienced the worst dengue incidence in large dengue outbreaks in Taiwan [10,11]. One major reason is that most areas of Tainan and Kaohsiung are infested with the principal vector, Ae. aegypti. In the analysis of the 2015 dengue outbreak, the 4 Level-1 districts had high population density, respectively the 2nd, 1st, 6th, and 3rd by rank in population density in Tainan. This small area experi-enced extraordinarily high dengue incidence, explaining 37% of the dengue incidence in Tainan and Kaohsiung combined. The 7 districts with the highest dengue in-cidence rates in 2015 Kaohsiung were also among the districts with the highest population density in Kaohsiung. This indicates that dengue viruses have adapted to the do-mesticated Ae. Aegyptiand most transmission occurs in and around the domestic environment in Tainan and Kaohsiung. In addition, it is possible that poor physical en-vironments in Tainan and Kaohsiung could be contribut-ing factors for recent dengue outbreaks and our results of analysis call for better environmental management for in-tegrated vector controls to reduce chance of dengue out-breaks in these regions. We note that the dengue incidence outbreak appeared to be initiated earlier and more concentrated geographically in Tainan than in Kaohsiung, shown in Figs.4aand3a, b. They may explain why the dengue outbreak occurred earlier and appeared to rise and fall more rapidly in Tainan. Similar climate might also be yet another reason for the dengue outbreaks in Tainan and Kaohsiung.
Because dengue incidence rates vary substantially by districts and because we attempt to accurately recognize geographical heterogeneity patterns of varying dengue incidence intensity, the map-based pattern recognition procedure is used and provides important epidemiologic pattern analysis. Our investigation exactly delineates the 2 tight clusters, which are distinct in location, intensity, and date of peak incidence. As stressed by Kulldorff (2001),p-values should be used as an indicator concern-ing the evidence for true spatial or space-time clusters rather than maintaining a strict cut-off for the p-value to decide whether to investigate detected clusters or not.
The amount of efforts for the investigation should de-pend on this evidence [18].
A global strategy for dengue prevention and control was established more than 10 years ago, and many ef-forts have been made to focus on 3 fundamental objec-tives: surveillance for planning and response, reducing the disease burden and changing behaviors to improve vector control [4]. However, the factors that drive den-gue viral transmission and infection continue unabated, and effective vector control remains elusive [6].
In addition, the US Centers for Disease Control (1990) issued a set of guidelines for investigating clusters of health events. According to the guidelines, the four stages are (1) initial contact with and response to the in-dividual who reported the cluster; (2) a preliminary as-sessment, including evaluations of whether an excess has occurred; (3) a formal feasibility study; and (4) a full etiologic investigation [19]. This study provides valuable information and inference in the second and third stage of the guidelines. We acknowledge some limitations of this study, including (1) this investigation is observa-tional by nature and the exact cause effects cannot be concluded, and (2) the data on the location at which the infection occurred are missing for many individuals, for those the individual’s residence at diagnosis is used in the analysis.
The Zika virus essentially has the same epidemiology and mosquito vectors in urban areas as dengue and is following the same path of global spread via competent mosquito vectors [20]. The potential for the Zika virus to emerge in Taiwan is great due to increased air travel. Thirteen imported cases were reported in Taiwan in 2016.
Conclusion
Beyond significance testing for disease clustering, our in-vestigation of dengue incidence distribution over spatial and temporal series is desired by and useful for health authorities who require optimal characteristics and pat-terns of disease incidence on maps and in a temporal series for effective prevention and control programs. Ef-fective prevention and control programs for dengue in Taiwan are critical, and have the added benefit of con-trolling the potential emergence of Zika.
Additional files
Additional file 1Table S1Frequency Distributions of the Number of Adjacencies Simulated on the Basis of 1 Million Random Selections in Kaohsiung.Table S2Analysis of Scan Test for Each of 7 Risk Districts in 2014 Kaohsiung. (DOCX 17 kb)
Funding
The research presented in this manuscript was partially supported by the Taiwan Ministry of Science and Technology grants MOST 104– 2118-M-006-006 and 105–2118-M-006-008 to C.C.W.
Availability of data and materials
Information on dengue cases collected in Taiwan since 1988 is publicly available through the Taiwan Centers for Disease Control (http://
www.cdc.gov.tw/english/index.aspx) and the Taiwan Government Open Data website (http://data.gov.tw/en).
Authors’contributions
CCW and CHC designed the study and participated in project conception. WTL performed analyses. WTL and HH participated in data reformatting and management. CHC, RBC and SS contributed in discussion of results and revision of the original manuscript. CCW drafted the manuscript. All authors read and approved the final manuscript.
Ethics approval and consent to participate
Not applicable.
Competing interests
The authors declare that they have no competing interests.
Publisher’s Note
Springer Nature remains neutral with regard to jurisdictional claims in published maps and institutional affiliations.
Author details
1Department of Statistics, College of Management, National Cheng Kung University, Tainan, Taiwan.2Institute of Biomedical Sciences, Academia Sinica, Taipei, Taiwan.3School of Chinese Medicine, China Medical University, Taichung, Taiwan.4Department of Environmental and Occupational Health, College of Medicine, National Cheng Kung University, 1 University Road Tainan, 701 Tainan, Taiwan.5Departments of Biostatistics, The University of Texas MD Anderson Cancer Center, Houston, TX, USA.6Departments of Epidemiology, The University of Texas MD Anderson Cancer Center, Houston, TX, USA.
Received: 30 June 2017 Accepted: 23 May 2018
References
1. Jd S, Ds S, Ea U, Ya H, Le C, Oj B, Si H, Bedi N, Im B, Ca C-O. The global burden of dengue: an analysis from the global burden of disease study 2013. Lancet Infect Dis. 2016;16:712–23.
2. Wilder-Smith A, Dj G. Dengue vaccines at a crossroad. Science. 2015; 350(6261):626–7.
3. Bhatt S, Pw G, Oj B, Jp M, Aw F, Cl M, Jm D, Js B, Ag H, Sankoh O. The Global Distribution And Burden Of Dengue. Nature. 2013;496(7446):504–7. 4. Mg G, Sb H, Artsob H, Buchy P, Farrar J, Dj G, Hunsperger E, Kroeger A, Hs M,
Martínez E. Dengue: a continuing global threat. Nat Rev Microbiol. 2010;8:S7–S16. 5. Stahl H-C, Vm B, Ht T, Gozzer E, Skewes R, Mahendradhata Y,
Runge-Ranzinger S, Kroeger a, Farlow a. cost of dengue outbreaks: literature review and country case studies. BMC Public Health. 2013;13(1):1.
6. Sj T. Preventing dengue—is the possibility now a reality? N Engl J Med. 2015;372(2):172–3.
7. Dj G. Dengue and dengue hemorrhagic fever. Clin Microbiol Rev. 1998; 11(3):480–96.
8. Gubler Dj, Ooi Ee, Vasudevan S, Farrar J: Dengue and dengue hemorrhagic fever: Centre for agriculture and Biosciences International; 2014.https:// www.cabi.org/bookshop/book/9781845939649.
9. Als J, Sn A, Dj G. Barriers to preclinical investigations of anti-dengue immunity and dengue pathogenesis. Nat Rev Microbiol. 2013;11(6):420–6. 10. Akashi K. A dengue epidemic in the Tainan District of Taiwan in 1931.
Taiwan No Ikai. 1932;31:767.
11. Koizumi M, Yamaguchi K, Tonomura K. Dengue Fever. Nisshin Igaku. 1916;6:955–1004.
12. Rc G, Kc W, Pwc J. Search for hierarchical clusters of disease: spatial patterns of sudden infant death syndrome. Soc Sci Med. 1981;15(D):287–93. 13. Cliff Ad, Ord Jk: Spatial processes: Models & Applications: Taylor & Francis; 1981.
14. Wallenstein S, Neff N. An approximation for the distribution of the scan statistic. Stat Med. 1987;6(2):197–207.
15. Mantel N. The detection of disease clustering and a generalized regression approach. Cancer Res. 1967;27(2):209–20.
16. Ad C, Jk O. Spatial Autocorrelation. London: Pion Press; 1973.
17. Banu S, Guo Y, Hu W, Dale P, Js M, Mengersen K, Tong S. Impacts of El Niño southern oscillation and Indian Ocean dipole on dengue incidence in Bangladesh. Sci Rep. 2015;5:16105.
18. Kulldorff M. Prospective time periodic geographical disease surveillance using a scan statistic. Journal Of The Royal Statistical Society: Series A (Statistics In Society). 2001;164(1):61–72.
19. Centers For Disease Controls. Guidelines for investigating clusters of health events. MMWR. 1990;39:1–23.
20. Musso D, Dj G. Zika Virus. Clin Microbiol Rev. 2016;29(3):487–524. 21. R: A Language And Environment For Statistical Computing. 3.3.0 Edn.
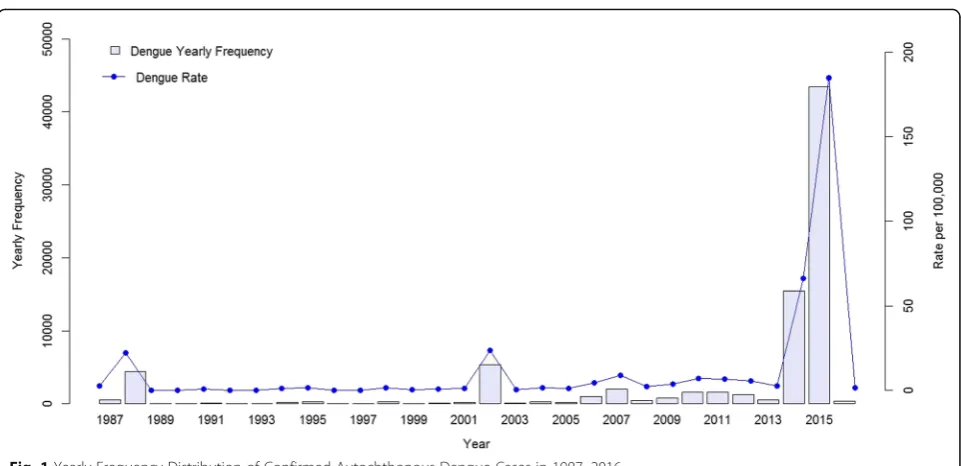
![Fig. 2 2015 Taiwan Dengue Incidence Intensity Distribution. The figure was generated by the Statistical Package R version 3.3.0 [21]](https://thumb-us.123doks.com/thumbv2/123dok_us/8352025.310616/4.595.59.538.88.583/taiwan-dengue-incidence-intensity-distribution-generated-statistical-package.webp)