R E S E A R C H
Open Access
The usability of ventilators: a comparative
evaluation of use safety and user
experience
Plinio P. Morita
1,2, Peter B. Weinstein
1, Christopher J. Flewwelling
1, Carleene A. Bañez
1, Tabitha A. Chiu
1,
Mario Iannuzzi
1, Aastha H. Patel
1, Ashleigh P. Shier
1and Joseph A. Cafazzo
1,2,3*Abstract
Background:The design complexity of critical care ventilators (CCVs) can lead to use errors and patient harm. In this study, we present the results of a comparison of four CCVs from market leaders, using a rigorous methodology for the evaluation of use safety and user experience of medical devices.
Methods:We carried out a comparative usability study of four CCVs: Hamilton G5, Puritan Bennett 980, Maquet SERVO-U, and Dräger Evita V500. Forty-eight critical care respiratory therapists participated in this fully
counterbalanced, repeated measures study. Participants completed seven clinical scenarios composed of 16 tasks on each ventilator.
Use safety was measured by percentage of tasks with use errors or close calls (UE/CCs). User experience was measured by system usability and workload metrics, using the Post-Study System Usability Questionnaire (PSSUQ) and the National Aeronautics and Space Administration Task Load Index (NASA-TLX).
Results:Nine of 18 post hoc contrasts between pairs of ventilators were significant after Bonferroni correction, with effect sizes between 0.4 and 1.09 (Cohen’sd). There were significantly fewer UE/CCs with SERVO-U when compared to G5 (p= 0.044) and V500 (p= 0.020). Participants reported higher system usability for G5 when compared to PB980 (p= 0.035) and higher system usability for SERVO-U when compared to G5 (p< 0.001), PB980 (p< 0.001), and V500 (p< 0.001). Participants reported lower workload for G5 when compared to PB980 (p< 0.001) and lower workload for SERVO-U when compared to PB980 (p< 0.001) and V500 (p< 0.001). G5 scored better on two of nine possible comparisons; SERVO-U scored better on seven of nine possible comparisons. Aspects influencing
participants’performance and perception include the low sensitivity of G5’s touchscreen and the positive effect from the quality of SERVO-U’s user interface design.
Conclusions:This study provides empirical evidence of how four ventilators from market leaders compare and highlights the importance of medical technology design. Within the boundaries of this study, we can infer that SERVO-U demonstrated the highest levels of use safety and user experience, followed by G5. Based on qualitative data, differences in outcomes could be explained by interaction design, quality of hardware components used in manufacturing, and influence of consumer product technology on users’expectations.
Keywords:Comparative study, Human factors and ergonomics, Critical care, Patient safety, Ventilator, Mechanical, Medical device design
* Correspondence:[email protected] 1
Healthcare Human Factors, Techna Institute, University Health Network, Toronto, Canada
2Institute of Health Policy, Management and Evaluation, University of
Toronto, Toronto, Canada
Full list of author information is available at the end of the article
Background
Ventilators are a fundamental technology in critical care, with their use expected to increase in demand in the next 10 years [1]. Existing estimates of the proportion of patients admitted to the intensive care unit (ICU) requir-ing ventilator support range from 19 to 75 % in various countries [2–5]. The use of ventilators is not without risk to the patient, with potential harm arising from infections, pneumothorax, ventilator-associated lung injury, and oxygen toxicity [6–9].
Other significant ventilator-related risks are the associ-ated use errors with the device [10–14]. Use errors could cause patient harm in their operation if devices are not properly designed to mitigate such risks [11, 15, 16]. The design of ventilators can negatively affect user performance through poor user interfaces, interaction modes, or difficulties during the physical setup of the equipment [17].
The evaluation of use safety and the user experience of medical devices can be conducted through usability testing [18, 19]. Usability testing of medical devices has become increasingly important in recent years, with the US Food and Drug Administration (FDA) requiring med-ical devices to satisfy minimum use safety requirements prior to regulatory approval [20]. However, the testing conducted by manufacturers for their FDA submissions is often confidential, qualitative in nature, and not intended to achieve statistical significance in validating the product design [18]. As such, there are no means to compare the outcomes of these studies with those of similar devices on the market or with findings from other studies in the literature [21].
To address this limitation, a comparative usability test can be used, where multiple devices are evaluated con-currently, following the same protocol [18, 22]. Existing comparative studies available in the literature, however, normally test two devices or variations of a device de-sign, as with, for example, the testing of compact trans-port ventilators [23], laparoscopic devices [24], and inhalers [25]. Other studies that provide comparisons of a larger number of devices rely on simplified methodologies that lack scientific rigor [26, 27].
In order to compare the use safety and user experience of critical care ventilators on the market, it was neces-sary to design and run a comparative usability test with a large enough sample of representative users to deter-mine if there were statistically significant differences among ventilators.
This study’s intent is to provide empirical evidence of the difference in use safety and user experience of four market-leading critical care ventilators available in North America [28]: the Hamilton G5 (Hamilton Medical AG; Bonaduz, Switzerland), the Covidien Puritan Bennett 980 (Covidien LP; Mansfield, MA, USA), the Maquet
SERVO-U (Maquet Critical Care AB; Solna, Sweden), and the Dräger Evita Infinity V500 (Dräger Medical GmbH; Lübeck, Germany). The findings explore the de-sign of the ventilators in two dimensions of interest: use safety and user experience (a combination of perceived system usability and workload). The methodology pre-sented in this paper enables users and decision makers to better understand the differences between designs of mechanical ventilators on the market, thereby support-ing an understandsupport-ing of user needs and procurement processes alike [29].
Methods
Experimental design
In order to estimate the sample size and the feasibility of a full-scale, powered study [30–32], it was necessary to obtain a priori knowledge regarding the performance of the selected ventilators. As this data was not available in the literature, a pilot study with 13 participants was performed. Sample size was calculated assuming a re-peated measures design with possible contrasts, with 80 % power and significance at the 5 % level [33] for use safety, system usability, and workload. Pilot data indicated a minimum of 48 participants was needed to discriminate between how each of the ventilators performed using the three selected metrics. This sample size allowed a full counterbalancing of the order of ventilators and the use of a repeated measures design to account for learning effects, order effects, and fatigue [30–32]. Data analyses for the pilot study and the full-scale study were performed by the principal investigator, who was blinded to which dataset corresponded to which ventilator, to ensure objectivity.
The study was conducted at the Clinical Skills and Patient Simulation Center (CSPSC) at the University of North Carolina School of Medicine (see Additional file 1) and received ethics approval (HHF1520_3) by the Quorum Review Independent Review Board (Quorum Review, Seattle, WA, USA). Written consent was collected from all study participants for the publication of their de-identified data and accompanying images used in this manuscript.
Participants
managing ventilators, and providing airway manage-ment in high-risk areas of North American hospitals, such as ICUs and emergency departments [34, 35].
Participants for this study were recruited from three hospital networks in North Carolina (Duke Health, WakeMed Health & Hospitals, and UNC Health Care). The CSPSC helped with recruitment by forwarding the recruitment email to head RTs in the three hospital networks, and a total of 143 RTs responded to the recruit-ment email. A survey was used during recruitrecruit-ment for selecting a group of participants with experience balanced among the four families of ventilators, to identify RTs with experience in critical care and to avoid recruiting partici-pants with consulting relationships with manufacturers (see Additional file 2).
Devices
Each participant performed the scenarios on all four ventilators: the Hamilton G5 (G5), the Covidien Puritan Bennett 980 (PB980), the Maquet SERVO-U (SERVO-U), and the Dräger Evita Infinity V500 (V500). The order of ventilators was fully counterbalanced, to avoid learning and order effects, and a repeated measures study design was used. These ventilators were selected for the study as the most advanced models from the North American market leaders [28].
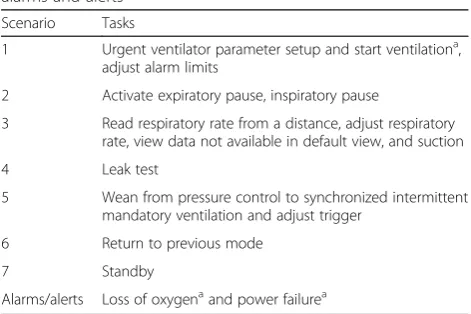
Tasks and scenarios
The internationally recognized standard, ISO 80601-2-12—Particular requirements for basic safety and essen-tial performance of critical care ventilators, details the primary operating functions in a ventilator-neutral and independent manner [36]. The 16 representative tasks described in Table 1 were determined based on the aforementioned standard.
A total of seven scenarios were developed to create rele-vant clinical context, incorporating both typical clinical
scenarios and time-sensitive scenarios, such as response to a loss of oxygen supply. The scenarios were designed by the authors and later vetted through consultations with RTs, ensuring accurate reflection of clinical context and patient conditions. The scenarios and tasks were always presented in the same order to maintain the clinical context, with the exception of the alarm tasks, which were randomized. All tasks had a 10-minute time limit, with a 160-minute time limit per ventilator.
In order to address concerns over instructor-led manu-facturer training [37], this study employed exploration-based training [38] to increase realism and alignment with the delivery of training in real conditions (which was con-firmed during the pilot study). Participants were given a set of learning objectives and asked to familiarize them-selves with each of the four ventilators until they felt they would be comfortable using them on a real patient. A test administrator was available to answer questions and dem-onstrate any functions. At a minimum, all participants were required to demonstrate the ability to independently ventilate the patient, adjust parameters, adjust alarm limits, and browse menus.
Variables
Use safety, system usability, and workload were selected as the three major measures of interest, since they correl-ate to aspects of a medical device’s design quality and are known to affect patient safety [20, 39–42]. These variables were measured through a combination of observed use and validated subjective scales, which measured partici-pants’perception of the four devices and provided a com-prehensive view of both the RTs’ perception and actual performance when using the ventilators. A combination of observed use and self-reported perception was used to protect this study from bias that may relate to the “preference versus performance paradox”[43, 44].
[image:3.595.56.292.566.723.2]Use safety was measured as inversely proportional to the percentage of tasks (total of 16) in which participants had a use error or close call (UE/CC); hence, a lower per-centage represents a safer device. UE/CCs were collected through well-established observation techniques [18–20]. A use error is defined as an action (or failure to act) that directly compromises safety or effectiveness of a device or that results in an undesirable or unintended treatment. A close call is defined as an instance in which a user experi-ences a usability issue that would result in a use error but successfully recovers prior to compromising the task. Two human factors experts independently observed each participant completing the tasks and recorded whether a UE/CC occurred during a task. This variable was categor-ical (UE/CC or no UE/CC), so a clincategor-ical task was com-pleted either with a UE/CC or without one. Following data collection, observers compared ratings on a task-by-task basis and agreed on any clarifications to be Table 1Description of scenarios and associated tasks, as well as
alarms and alerts
Scenario Tasks
1 Urgent ventilator parameter setup and start ventilationa, adjust alarm limits
2 Activate expiratory pause, inspiratory pause
3 Read respiratory rate from a distance, adjust respiratory rate, view data not available in default view, and suction
4 Leak test
5 Wean from pressure control to synchronized intermittent mandatory ventilation and adjust trigger
6 Return to previous mode
7 Standby
Alarms/alerts Loss of oxygenaand power failurea a
sought during the participant debriefing. In cases where the issue remained unclear, a third human factors pro-fessional would independently resolve the tie through video review.
System usability was evaluated through a combination of the UE/CC metric described above and the Post-Study System Usability Questionnaire (PSSUQ) [45]: a 16-question, self-reported subjective evaluation of perceived system usability. The PSSUQ has been used in healthcare to evaluate clinical monitoring [46], anesthesia [47], as well as telerehabilitation systems [48]. PSSUQ scores range from 1 to 7, with lower scores representing better perceived system usability.
Lastly, workload was evaluated using the National Aeronautics and Space Administration Task Load Index (NASA-TLX) [49, 50], a subjective workload assessment tool that relies on six subscales (Mental Demand, Physical Demand, Temporal Demand, Own Performance, Effort, and Frustration). NASA-TLX has been used extensively in healthcare [50] to evaluate medical devices such as venti-lators [51], infusion pumps [39], and physiological moni-toring displays [52]. The output from the NASA-TLX instrument is a score ranging from 0 to 100, where lower scores correspond to lower perceived workload.
Data collection
Each participant session lasted a maximum of 8 hours, which included a 1.5-hour exploratory training period followed by four 1.5-hour periods (with breaks between periods), where participants performed the tasks on each of the four ventilators. For each ventilator, participants went through the scenarios described in Table 1 while being observed by human factors experts responsible for logging the occurrence of UE/CCs and for collecting qualitative data about the performance of the participants. At the end of each sequence of scenarios, participants were presented with PSSUQ and NASA-TLX tools to evaluate the ventilator they had just used, followed by a debriefing interview to allow them to voice their opinions. This same process was repeated for each of the three remaining ventilators.
Data analysis
Statistical analyses were performed using SPSS Version 22.0 (IBM Corp, Armonk, NY, USA). Overall differences in safety and user experience of the ventilators were ex-plored through repeated measures analysis of variance (ANOVA). Post hoc contrasts comparing any two venti-lators were performed using multiple pairwise t tests. [30, 31]. Bonferroni corrections were used due to the mul-tiple comparisons performed, with other less conservative corrections having minor effects on the number of statisti-cally significant comparisons. Bonferroni correction can be overly conservative in studies of this type, considering that the outcome variables are correlated, increasing the chance of false negatives [53]. For this reason, the results of contrasts with Bonferroni correction and the post hoct
tests without correction are both reported in the results section (see Table 4 for uncorrected results).
Results
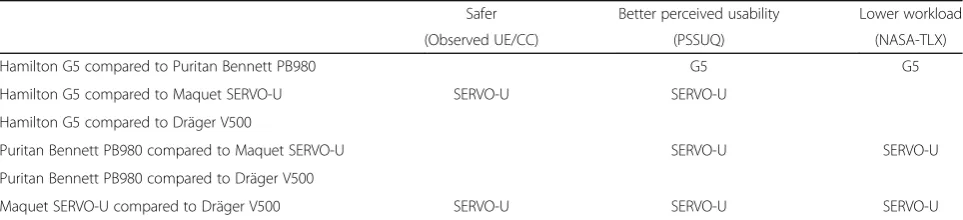
A summary indicating how each pair of ventilators com-pares is presented in Table 2, where only the statistically significant pair comparisons are presented. The SERVO-U outperformed the other ventilators in seven out of nine possible pair comparisons, and the G5 outperformed the other ventilators in two out of nine possible comparisons. The PB980 and the V500 did not outperform the other ventilators.
Overall ventilator comparison
Table 3 outlines the percentage of tasks with UE/CCs, the perceived workload of each ventilator on the NASA-TLX scale, and the usability of the different ventilators as measured by the PSSUQ scale. Box plots, presented as an Additional file 3, provide a visual representation of these data.
Repeated measures ANOVA showed statistically significant differences on all three variables: UE/CC, F(2.5, 119.1) = 6.101, p< 0.001, partial η2= 0.115; NASA-TLX, F(3, 141) = 16.629,p< 0.001, partial η2= 0.261; and
[image:4.595.57.539.604.714.2]PSSUQ, F(3, 141) = 17.821, p< 0.001, partial η2= 0.275. Residuals were normally distributed.
Table 2Comparative description of how any two ventilators comparea
Safer Better perceived usability Lower workload
(Observed UE/CC) (PSSUQ) (NASA-TLX)
Hamilton G5 compared to Puritan Bennett PB980 G5 G5
Hamilton G5 compared to Maquet SERVO-U SERVO-U SERVO-U
Hamilton G5 compared to Dräger V500
Puritan Bennett PB980 compared to Maquet SERVO-U SERVO-U SERVO-U
Puritan Bennett PB980 compared to Dräger V500
Maquet SERVO-U compared to Dräger V500 SERVO-U SERVO-U SERVO-U
UE/CCuse error/close call,PSSUQPost-Study System Usability Questionnaire,NASA-TLXNational Aeronautics and Space Administration Task Load Index
a
Ventilator pair comparison
Six post hoc comparisons with Bonferroni correction [30, 31, 53, 54] were performed for each metric, which allowed pairs of ventilators to be ranked in terms of use safety (UE/CC), system usability (PSSUQ and UE/CC), and workload (NASA-TLX). The contrasts look at the differences in the means (MD) for each metric and
deter-mine, after corrections, whether these differences are sta-tistically significant (Table 4). After applying Bonferroni corrections, nine out of the 18 possible comparisons were statistically significant.
Participants experienced fewer UE/CCs with the SERVO-U (9.1 %) than with the G5 (12.8 %), MD=
−3.646,p =0.044, d =0.40.Participants also experienced fewer UE/CCs with the SERVO-U (9.1 %) than with the V500 (16.9 %), MD=−7.813,p =0.002,d =0.55.
[image:5.595.56.291.111.211.2]On the PSSUQ metric (ranging from 1 to 7), partici-pants reported better usability for the G5 (2.7) than for the PB980 (3.5), MD=−0.807, p =0.035, d =0.42. They
Table 3Ventilator performance in the UE/CC, NASA-TLX, and PSSUQ metrics
Use error and close calls (% of tasks) Use safety
NASA-TLX (0–100) Workload
PSSUQ (1–7) System usability
Ventilator Mean Standard deviation
Mean Standard deviation
Mean Standard deviation
G5 12.8 10.7 28.3 20.5 2.7 1.3
PB980 13.2 11.9 43.7 21.9 3.5 1.5
SERVO-U 9.1 11.0 21.5 17.1 1.7 0.9
V500 16.9 14.1 34.6 20.8 3.1 1.4
Lower scores on all three metrics correspond to better perception/performance
UE/CCuse error/close call,NASA-TLXNational Aeronautics and Space Administration Task Load Index,PSSUQPost-Study System Usability Questionnaire
Table 4Mean differences (MD=Vent1–Vent2) between the ventilators with the results of the post hoc contrasts with Bonferroni
correction (df = 47), the post hocttests without corrections, and the effect sizes (Cohen’sd)
Contrasts with Bonferroni correction Post hocttests without correction Effect size
MD(Mvent1−Mvent2) p t(47) p Cohen’sd
Use error/close calls (%) Use safety
Vent1 Vent2
G5 PB980 −0.391 1.000 −0.209 0.835 0.03
G5 SERVO-U 3.646 0.044a 2.804 0.007a 0.40
G5 V500 −4.167 0.292 −2.024 0.049a 0.29
PB980 SERVO-U 4.036 0.149 2.319 0.025a 0.33
PB980 V500 −3.776 0.287 −2.032 0.048a 0.29
SERVO-U V500 −7.813 0.002a −3.824 <0.001a 0.55
NASA-TLX (0–100) Workload
Vent1 Vent2
G5 PB980 −15.449 < 0.001a −4.404 < 0.001a 0.64
G5 SERVO-U 6.765 0.153 2.308 0.025a 0.33
G5 V500 −6.379 0.547 −1.725 0.091 0.25
PB980 SERVO-U 22.214 < 0.001a 7.524 < 0.001a 1.09
PB980 V500 9.070 0.072 2.615 0.012 0.38
SERVO-U V500 −13.144 < 0.001a −4.323 < 0.001a 0.62
PSSUQ (1–7) System usability
Vent1 Vent2
G5 PB980 −0.807 0.035a −2.884 0.006 0.42
G5 SERVO-U 0.935 < 0.001a 4.363 < 0.001a 0.63
G5 V500 −0.452 0.508 −1.761 0.085 0.25
PB980 SERVO-U 1.742 < 0.001a 7.456 < 0.001a 1.07
PB980 V500 0.354 1.000 1.195 0.238 0.17
SERVO-U V500 −1.388 < 0.001a −6.221 < 0.001a 0.87
NegativeMDvalues representing Vent1performing better than Vent2 a
[image:5.595.56.538.350.718.2]also perceived better usability for the SERVO-U (1.7) compared to the G5 (2.7), PB980 (3.5), and V500 (3.1), MD=−0.935,p <0.001, d =0.63; MD=−1.742, p <0.001,
d =1.07; MD=−1.388,p <0.001,d =0.87, respectively.
Lastly, on the NASA-TLX metric (ranging from 0 to 100), participants reported lower workload for the G5 (28.3) compared to the PB980 (43.7), MD=−15.449,
p <0.001, d =0.64. They also reported lower workload for the SERVO-U (21.5) compared to the PB980 (43.7) and V500 (34.6), MD=−22.214, p <0.001,d =1.09 and
MD=−13.144, p <0.001, d =0.62, respectively.
Effect sizes were within the 0.4 to 1.09 range, with most comparisons having medium (d> 0.5) and strong (d> 0.8) effect sizes (see Table 4 for the complete results) [33].
Demographics
Data were collected from 48 participants for the full-scale study, out of which 34 % were male (n = 16) and 66 % were female (n = 32), with 68 % of the participants being between the ages of 25 and 45 years old (n = 33). As for experience, 63 % of the RTs who participated in the study (n = 30) had five or more years of experience as an RT.
A perfect balance of participants’level of experience with each of the ventilators was not possible due to uneven market share of the ventilators. However, using the data collected through the recruitment survey, multiple regres-sion models were performed for all variables collected in the study, showing only minor effects on PSSUQ scores for the PB980, F(4,43) = 4.796,p= 0.003, adj. R2= 0.24, where only the experience with the PB980 (p= 0.044,β=−0.268) and the G5 (p= 0.034, β=−0.347) had an effect on the PSSUQ score for the PB980. All other variables collected in this study were not influenced by the experience with the ventilators.
Discussion
The intent of this study was to provide empirical evidence of the differences in use safety and user experience of four market-leading critical care ventilators available in North America. As the scenarios were the same for all four ven-tilators, the results presented in this paper suggest that the different user interfaces and interaction designs, as well as the quality of the hardware used, may have had an impact on user performance and perception. Additionally, the re-sults reinforce the importance of user interfaces and user interaction in the design of medical technology [55–57] as well as in the quality of the hardware used in manufac-turing. For instance, the lack of sensitivity of the G5’s touchscreen proved to be a barrier for task completion and a significant source of frustration, while the SERVO-U’s user interface was praised by the participants. The design of a medical technology is a factor that can strongly influence user experience and user performance, as widely discussed in the medical device and critical care literature
[55, 57–59]. These results are also of critical importance for patient safety as they serve as an indicator of which medical technology is less likely to produce adverse events [55, 60, 61] arising from the operation of the devices.
The four ventilators were compared using repeated measures ANOVA, and we found statistically significant differences on all three variables (NASA-TLX, PSSUQ, UE/CC), showcasing medium (partial η2> 0.06) to large (partialη2< 0.13) effect sizes [33]. These results validate the sensitivity of our study design to discriminate the performance of the ventilators.
The participants’ opinions were further supported by the results of the paired contrasts through repeated measuresttest. The data from Table 2 show that SERVO-U outperformed other ventilators in seven out of nine comparisons with other ventilators, showing medium to large effect sizes. These results indicate that partici-pants’ perceptions of the SERVO-U’s superior user interface were reflected in the subjective and objective data collected in the study. SERVO-U showed safer per-formance (measured through UE/CC) when compared to the G5 and the V500, better perceived usability when compared to any of the three other ventilators, and lower perceived workload when compared to the PB980 and the V500. Next, the Hamilton G5 outperformed the PB980, both in self-reported usability and workload. The PB980 and the V500 did not outperform any ventilator in this study. Within the scope of this project, the SERVO-U, followed by the G5, demonstrated the highest levels of use safety and user experience, both factors that can directly impact patient safety [20, 40–42].
Using only the quantitative results, it is not possible to ascertain which specific factors influenced user perform-ance. Hence the importance of also collecting qualitative data in the form of observations to further enrich the analysis [18, 20]. The qualitative data also collected in this study indicate that the choices of interaction model of each ventilator (e.g., how to select information on the screen, adjusting settings, and confirming) seem to interfere with task completion and affect users’ overall percep-tion of the devices. A more detailed descrippercep-tion of oper-ational difficulties and safety implications of design should be explored in future publications, promoting an in-depth assessment of problems observed in this study.
are normally performed by nurses and doctors. Future studies could potentially compare the performance of RTs in North America with that of nurses and physicians in Europe.
Ultimately, the goal of this methodology is to support the design and/or selection of the safest medical devices on the market. The FDA, as well as researchers in patient safety, all posit the strong relationship that medical device usability has with use and patient safety [20, 40–42], where devices with poor usability can potentially lead to harm to the patient. Hence, such a strong relationship should be reflected in our results. This effect was observed when comparing the SERVO-U with the V500 and G5 but not when comparing the SERVO-U to the PB980. This difference was a result of the conservative nature of Bonferroni corrections [53]. The uncorrected UE/CC comparison of the SERVO-U and PB980 is significant (see Table 4), further supporting the relationship already discussed in the literature between usability and use safety.
In terms of further exploring the safety of medical technology, several studies in critical care that primarily focus on general characteristics and technical perform-ance of medical devices would benefit from the rigorous methodology presented in this paper, to afford the evalu-ation of the human component on the use of technol-ogy, for example, studies of point-of-care technology [62] or emergency and transport ventilators [63], as well as those evaluating the effectiveness of electronic phys-ician order entry in the ICU [59]. The effect of the human component has been extensively discussed in the critical care literature [58, 64, 65], describing how the design of human–machine interfaces (or of medical device user in-terfaces) play an important role in the safety of critical care technology [56, 57].
Limitations of this study include the fidelity of simu-lated conditions and that only four ventilators were tested. Only RTs were included in the study, as opposed to nurses and physicians, who tend to be primary users outside North America. Additionally, the recruitment criteria and the structure of the demographic data limited our ability to run a regression analysis to evaluate the effect of different demographics variables on the variables being measured. Our study was not powered to run such regression analysis.
Lastly, this study was sponsored by the Maquet Getinge Group. Precautions and safeguards were taken to ensure the independence of the research. The study design, development of the methodology, selection of variables, data analysis, and manuscript preparation were made in-dependently of the project sponsor. As we did not know how the ventilators would perform, a pilot study was used both for the calculation of sample size and to test the hypothesis that there would be measurable differences
between ventilators. To further the independence of our research, all the statistical analyses were performed by the principal investigator, who was blinded to the identity of the ventilators.
Conclusions
This study provides empirical evidence on how the four ventilators from market leaders compare and highlights the importance of the design of medical technology. Within the boundaries of this study, we can infer that the SERVO-U ventilator demonstrated the highest levels of use safety and user experience, followed by the G5. Based on qualitative data collected during this study, differences in outcomes could be explained by interaction design, quality of the hardware components used in manufacturing, and influence of consumer product tech-nology on users’expectations. Ultimately, the results pre-sented in this paper provide evidence of the feasibility and potential of novel methodology comparative usability testing in identifying the safest and most usable medical technology on the market, supporting the selection of the safest medical technology and the design of the next generation of devices.
Additional files
Additional file 1:Setup of the testing facilities at the Clinical Skills and Patient Simulation Center at the University of North Carolina School of Medicine, where the simulator room and observation room can be seen. (PDF 1830 kb)
Additional file 2:Recruitment survey used in this study. (PDF 641 kb)
Additional file 3:Box plots showing the performance of the four ventilators in the use error/close call metric, the NASA-TLX scale, and the PSSUQ scale.Shadingis used simply to differentiate datasets.Dotsrepresent outliers. Lower scores on all three metrics correspond to better perception/ performance. (PDF 72.4 kb)
Abbreviations
ANOVA, analysis of variance; CSPSC, Clinical Skills and Patient Simulation Center; FDA, Food and Drug Administration; ICU, intensive care unit; NASA-TLX, National Aeronautics and Space Administration Task Load Index; PSSUQ, Post-Study System Usability Questionnaire; RT, respiratory therapist; UE/CC, use error/close call
Acknowledgements
Our team would like to thank the team from the Clinical Skills and Patient Simulation Center at the University of North Carolina School of Medicine for all the support provided during this study, Meaghan Cuerden Knight for her input on statistical analyses, and Tara Fowler from Toronto General Hospital Respiratory Care for her support.
Funding
This study was sponsored by the Maquet Getinge Group.
Availability of data and materials Not applicable.
Authors’contribution
recruitment, data acquisition, data analysis, data interpretation, and manuscript preparation. CJF contributed to the study design, participant recruitment, data acquisition, data analysis, data interpretation, and manuscript preparation. CAB contributed to the study design, participant recruitment, data acquisition, data analysis, data interpretation, and manuscript preparation. TAC contributed to participant recruitment, as well as data acquisition, data analysis, and data interpretation. MI contributed to participant recruitment, as well as data acquisition, data analysis, and data interpretation. AHP contributed to participant recruitment, as well as data acquisition, data analysis, and data interpretation. APS contributed to participant recruitment, as well as data acquisition, data analysis, and data interpretation. JAC contributed to the study design, data interpretation, and manuscript preparation. All authors reviewed, and approved the final manuscript.
Competing interests
All experimental design, data collection, data analysis, and manuscript preparation were performed without the influence of the sponsor. Final experimental design decisions and statistical analysis were performed by the study’s principal investigator, who was blinded to which dataset corresponded to which ventilator. No other financial and non-financial conflicts of interest exist.
Consent for publication Not applicable.
Ethics approval and consent to participate
This study received ethics approval (HHF1520_3) by the Quorum Review Independent Review Board (Quorum Review, Seattle, WA, USA). Written consent was collected from all study participants for the publication of their de-identified data and accompanying images used in this manuscript.
Author details
1Healthcare Human Factors, Techna Institute, University Health Network,
Toronto, Canada.2Institute of Health Policy, Management and Evaluation, University of Toronto, Toronto, Canada.3Institute of Biomaterials and Biomedical Engineering, University of Toronto, Toronto, Canada.
Received: 15 March 2016 Accepted: 22 July 2016
References
1. Needham DM, Bronskill SE, Calinawan JR, Sibbald WJ, Pronovost PJ, Laupacis A. Projected incidence of mechanical ventilation in Ontario to 2026: preparing for the aging baby boomers. Crit Care Med. 2005;33:574–9. 2. Edwards JR, Peterson KD, Andrus ML, Tolson JS, Goulding JS, Dudeck MA, et
al. National Healthcare Safety Network (NHSN) Report, data summary for 2006, issued June 2007. Am J Infect Control. 2007;35:290–301. 3. Wunsch H, Wagner J, Herlim M, Chong D, Kramer A, Halpern SD. ICU
occupancy and mechanical ventilator use in the United States. Crit Care Med. 2013;41:2712–9.
4. Esteban A, Anzueto A, Alía I, Gordo F, Apezteguía C, Pálizas F, et al. How is mechanical ventilation employed in the intensive care unit? An
international utilization review. Am J Respir Crit Care Med. 2000;161:1450–8. 5. Metnitz PGH, Metnitz B, Moreno RP, Bauer P, Sorbo LD, Hoermann C, et al.
Epidemiology of mechanical ventilation: analysis of the SAPS 3 database. Intensive Care Med. 2009;35:816–25.
6. Marini JJ. Mechanical ventilation: past lessons and the near future. Crit Care. 2013;17:S1.
7. Michaud G, Cardinal P. Mechanisms of ventilator-induced lung injury: the clinician’s perspective. Crit Care. 2003;7:209–10.
8. Gilstrap D, Macintyre N. Patient ventilator interactions: implications for clinical management. Am J Respir Crit Care Med. 2013;188:1058–68. 9. Chastre J, Fagon J-Y. Ventilator-associated pneumonia. Am J Respir Crit Care
Med. 2002;165:867–903.
10. Chatwin M, Heather S, Hanak A, Polkey MI, Simonds AK. Analysis of home support and ventilator malfunction in 1,211 ventilator-dependent patients. Eur Respir J. 2010;35:310–6.
11. Gravenstein JS. How does human error affect safety in anesthesia? Surg Oncol Clin N Am. 2000;9:81–95.
12. Auriant I, Reignier J, Pibarot ML, Bachat S, Tenaillon A, Raphael JC. Critical incidents related to invasive mechanical ventilation in the ICU: preliminary descriptive study. Intensive Care Med. 2002;28:452–8.
13. Craig J, Wilson ME. A Survey of anaesthetic misadventures. Anaesthesia. 1981;36:933–6.
14. ECRI Institute. Top 10 health technology hazards for 2016. 2015. https://www.ecri.org/Resources/Whitepapers_and_reports/2016_Top_10_ Hazards_Executive_Brief.pdf. Accessed 14 July 2016.
15. Gajic O, Frutos-Vivar F, Esteban A, Hubmayr RD, Anzueto A. Ventilator settings as a risk factor for acute respiratory distress syndrome in mechanically ventilated patients. Intensive Care Med. 2005;31:922–6. 16. Donchin Y, Seagull FJ. The hostile environment of the intensive care unit.
Curr Opin Crit Care. 2002;8:316–20.
17. Cooper JB, Newbower RS, Long CD, McPeek B. Preventable anesthesia mishaps: a study of human factors. Qual Saf Health Care. 2002;11:277–82. 18. Wiklund ME, Kendler J, Strochlic AY. Usability testing of medical devices.
Boca Raton: CRC Press; 2011.
19. Nielsen J. Usability engineering. Burlington: Morgan Kaufmann; 1993. 20. FDA. Applying human factors and usability engineering to optimize medical
device design. Food and Drug Administration. 2016. http://www.fda.gov/ downloads/MedicalDevices/…/UCM259760.pdf. Accessed 14 July 2016. 21. Ginsburg G. Human factors engineering: a tool for medical device evaluation
in hospital procurement decision-making. J Biomed Inform. 2005;38:213–9. 22. Rubin J, Chisnell D. Handbook of usability testing: how to plan, design and
conduct effective tests. Hoboken: Wiley; 2008.
23. Templier F, Miroux P, Dolveck F, Descatha A, Goddet N-S, Jeleff C, et al. Evaluation of the ventilator-user interface of 2 new advanced compact transport ventilators. Respir Care. 2007;52:1701–9.
24. McCrory B, Lowndes BR, LaGrange CA, Miller EE, Hallbeck MS. Comparative usability testing of conventional and single incision laparoscopic surgery devices. Hum Factors. 2012;55:619–31.
25. Diggory P, Fernandez C, Humphrey A, Jones V, Murphy M. Comparison of elderly people’s technique in using two dry powder inhalers to deliver zanamivir: randomised controlled trial. Br Med J. 2001;322:577–9. 26. Gonzalez-Bermejo J, Laplanche V, Husseini FE, Duguet A, Derenne J-P,
Similowski T. Evaluation of the user-friendliness of 11 home mechanical ventilators. Eur Respir J. 2006;27:1236–43.
27. Vignaux L, Tassaux D, Jolliet P. Evaluation of the user-friendliness of seven new generation intensive care ventilators. Intensive Care Med. 2009;35:1687–91. 28. Sichtermann L. Market analysis: ventilation. RT Mag. 2013.
http://www.rtmagazine.com/2013/10/market-analysis-ventilation/. Accessed 14 July 2016.
29. Cassano-Piché A, Cafazzo JA, Chagpar A, Easty AC. How human factors methods can help in the procurement process. Biomed Instrum Technol. 2010;44:49–56.
30. Kutner MH, Nachtsheim CJ, Neter J. Applied linear statistical models. New York: McGraw-Hill/Irwin; 2005.
31. Gravetter FJ, Wallnau LB. Statistics for the behavioral sciences. 7th ed. Belmont: Wadsworth Publishing; 2006.
32. van Teijlingen ER, Hundley V. The importance of pilot studies. Soc Res Update. 2001;35:1–4.
33. Cohen J. Statistical power analysis for the behavioral sciences. London: Routledge; 1988.
34. Commission on Accreditation of Allied Health Education Programs. Respiratory Therapist (Advanced). 2016. http://www.caahep.org/Content. aspx?ID=49. Accessed 14 July 2016.
35. American Association of Respiratory Care. What is an RT? 2016. https://www.aarc.org/careers/what-is-an-rt/. Accessed 14 July 2016. 36. ISO. ISO 80601-2-12:2011 Medical electrical equipment–Part 2–12:
Particular requirements for basic safety and essential performance of critical care ventilators. 2011. http://www.iso.org/iso/catalogue_detail.
htm?csnumber=51141. Accessed 14 July 2016.
37. Richard JCM, Richard M, Kacmarek RM. ICU mechanical ventilators, technological advances vs. user friendliness: the right picture is worth a thousand numbers. Intensive Care Med. 2009;35:1662–3.
38. Kamouri AL, Kamouri J, Smith KH. Training by exploration: facilitating the transfer of procedural knowledge through analogical reasoning. Int J Man Mach Stud. 1986;24:171–92.
40. Zhang J, Johnson TR, Patel VL, Paige DL, Kubose T. Using usability heuristics to evaluate patient safety of medical devices. J Biomed Inform. 2003;36:23–30. 41. Middleton B, Bloomrosen M, Dente MA, Hashmat B, Koppel R, Overhage JM,
et al. Enhancing patient safety and quality of care by improving the usability of electronic health record systems: recommendations from AMIA. J Am Med Informatics Assoc. 2013;20:e2–8.
42. Karsh B-T. Beyond usability: designing effective technology implementation systems to promote patient safety. Qual Saf Health Care. 2004;13:388–94. 43. Morita PP, Cafazzo JA. Challenges and paradoxes of human factors in health
technology design. JMIR J Hum Factors. 2015;3:1–7.
44. Nielsen J, Levy J. Measuring usability: preference vs. performance. Commun ACM. 1994;37:66–75.
45. Lewis JR. Psychometric evaluation of the PSSUQ using data from five years of usability studies. Int J Hum Comput Interact. 2002;14:463–88.
46. Dosani M, Hunc K, Dumont GA, Dunsmuir D, Barralon P, Schwarz SKW, et al. A vibro-tactile display for clinical monitoring. Anesth Analg. 2012;115:588–94. 47. Görges M, Winton P, Koval V, Lim J, Stinson J, Choi PT, et al. An evaluation
of an expert system for detecting critical events during anesthesia in a human patient simulator. Anesth Analg. 2013;117:380–91.
48. Schutte JL, Gales S, Filipponi A, Saptono A, Parmanto B, McCue M. Evaluation of a telerehabilitation system for community-based rehabilitation system. Int J Telerehabilitation. 2012;4:15–24.
49. Hart SG, Staveland LE. Development of NASA-TLX (Task Load Index): results of empirical and theoretical research. Adv Psychol. 1988;1:139–83. 50. Hart SG. Nasa-Task Load Index (NASA-TLX); 20 years later. Proc Hum Factors
Ergon Soc Annu Meet. 2006;50:904–8. SAGE Publications.
51. Wachter SB, Johnson K, Albert R, Syroid N, Drews F, Westenskow D. The evaluation of a pulmonary display to detect adverse respiratory events using high resolution human simulator. J Am Med Inform Assoc. 2006;13:635–42. 52. Görges M, Staggers N. Evaluations of physiological monitoring displays: a
systematic review. J Clin Monit Comput. 2008;22:45–66.
53. Perneger TV. What’s wrong with Bonferroni adjustments. BMJ. 1998;316:1236–8. 54. Sankoh AJ, Huque MF, Dubey SD. Some comments on frequently used multiple
endpoint adjustment methods in clinical trials. Stat Med. 1997;16:2529–42. 55. Fairbanks RJ, Caplan S. Poor interface design and lack of usability testing
facilitate medical error. Jt Comm J Qual Saf. 2004;30:579–84.
56. Hodge E, Blunt M, Young P. Capnography activation is improved by better ventilator interface ergonomics. Crit Care. 2011;15:P139.
57. Brindley PG. Patient safety and acute care medicine: lessons for the future, insights from the past. Crit Care. 2010;14:217.
58. Pickering BW, Litell JM, Herasevich V, Gajic O. Clinical review: the hospital of the future - building intelligent environments to facilitate safe and effective acute care delivery. Crit Care. 2012;16:220.
59. Colpaert K, Claus B, Somers A, Vandewoude K, Robays H, Decruyenaere J. Impact of computerized physician order entry on medication prescription errors in the intensive care unit: a controlled cross-sectional trial. Crit Care. 2006;10:R21. 60. Lin L, Vicente K, Doyle D. Patient safety, potential adverse drug events, and
medical device design: a human factors engineering approach. J Biomed Inform. 2001;34:274–84.
61. Graham TAD, Kushniruk AW, Bullard MJ, Holroyd BR, Meurer DP, Rowe BH. How usability of a web-based clinical decision support system has the potential to contribute to adverse medical events. AMIA Annu Symp Proc. 2008;257–61. 62. Stadlbauer V, Wallner S, Sojakovic T, Smolle KH. Comparison of three
different multi-analyte point-of-care devices during clinical routine on a medical ICU. Crit Care. 2011;433:e1–11.
63. L’Her E, Roy A, Marjanovic N. Bench-test comparison of 26 emergency and transport ventilators. Crit Care. 2014;18:506.
64. Hugonnet S, Uckay I, Pittet D. Staffing level: a determinant of late-onset ventilator-associated pneumonia. Crit Care. 2007;11:1–7.
65. Sevdalis N, Brett SJ. Improving care by understanding the way we work: human factors and behavioural science in the context of intensive care.
Crit Care. 2009;13:139. • We accept pre-submission inquiries
• Our selector tool helps you to find the most relevant journal • We provide round the clock customer support
• Convenient online submission
• Thorough peer review
• Inclusion in PubMed and all major indexing services • Maximum visibility for your research
Submit your manuscript at www.biomedcentral.com/submit