University of Pennsylvania
ScholarlyCommons
Publicly Accessible Penn Dissertations
2018
Understanding Metabolic Adaptation Of T Cells
During Activation And Nutrient Limitation
Christopher Ecker
University of Pennsylvania, [email protected]
Follow this and additional works at:https://repository.upenn.edu/edissertations
Part of theAllergy and Immunology Commons,Immunology and Infectious Disease Commons, and theMedical Immunology Commons
This paper is posted at ScholarlyCommons.https://repository.upenn.edu/edissertations/3110
For more information, please [email protected].
Recommended Citation
Ecker, Christopher, "Understanding Metabolic Adaptation Of T Cells During Activation And Nutrient Limitation" (2018).Publicly Accessible Penn Dissertations. 3110.
Understanding Metabolic Adaptation Of T Cells During Activation And
Nutrient Limitation
Abstract
Immune cells employ a diverse array of metabolic programs upon stimulation that have far-reaching
consequences outside of energy production. Activated T cells require glycolysis to generate the biosynthetic intermediates for proliferation and to enhance effector functions. Due to the disorganized vasculature of solid tumors and the highly glycolytic nature of tumor cells, T cells must compete for glucose with tumor cells in a nutrient-depleted environment. We hypothesized that cells that traffic to inflamed, nutrient-limiting
environments in the periphery (effector memory T cells, TEM) may have enhanced abilities to adapt to nutrient limitation compared to cells that largely reside in nutrient-rich lymphoid organs (naïve and central memory T cells, TN and TCM respectively). We demonstrate that TN and TCM rely on fatty acid
metabolism to survive and proliferate when glucose is limiting, whereas TEM do not. Furthermore, we find the reliance on fatty acid metabolism in limiting glucose by TN and TCM cells regulates IFN-γ production. Thus the first section of my thesis identifies a novel regulatory interaction between fatty acid synthesis and effector function. Other byproducts of metabolic pathways can also affect immune cell function. Recent work has suggested that reactive oxygen species are released following activation, which promote proliferative signals in T cells such as IL-2 production. The second section of my thesis investigates how T cells increase reactive oxygen species (ROS) production following activation. Using transmission electron microscopy we observe dramatic alterations to mitochondrial morphology following T cell activation. Mitochondria significantly increase in size and their cristae lose parallel patterning during the first 48 hours of T cell activation. Mitochondrial swelling and cristae disturbance are glucose and mTORC1 dependent, and highly reversible. Interestingly, we find that mitochondrial swelling does not correlate to oxidative phosphorylation rate, but strongly correlates to ROS production. We speculate that these mitochondrial changes are required to create the ROS necessary for subsequent IL-2 production and T cell proliferation. Together these data demonstrate novel relationships between cellular metabolism and cytokine production in CD4 T cells. By identifying how metabolites specifically affect immune function, we hope to exploit these discoveries in future cancer immunotherapies.
Degree Type
Dissertation
Degree Name
Doctor of Philosophy (PhD)
Graduate Group
Immunology
First Advisor
James L. Riley
Keywords
effector, glycolysis, IFN-y, memory, metabolism, mitochondria
Subject Categories
Allergy and Immunology | Immunology and Infectious Disease | Medical Immunology
UNDERSTANDING METABOLIC ADAPTATION OF T CELLS DURING ACTIVATION AND NUTRIENT LIMITATION
Christopher Michael Ecker
A DISSERTATION
In
Immunology
Presented to the Faculties of the University of Pennsylvania
in
Partial Fulfillment of the Requirements for the
Degree of Doctor of Philosophy
2018
Supervisor of Dissertation
_____________
James L. Riley
Associate Professor of Microbiology
Graduate Group Chairperson
________________
David M. Allman
Professor of Pathology and Laboratory Medicine
Dissertation Committee
Taku Kambayashi, M.D., Ph.D., Associate Professor of Pathology and Laboratory Medicine
E. John Wherry, Ph.D., Richard and Barbara Schiffrin President's Distinguished Professor of
Microbiology
Kathryn E. Wellen, Ph.D., Associate Professor of Cancer Biology
UNDERSTANDING METABOLIC ADAPTATION OF T CELLS DURING ACTIVATION AND NUTRIENT LIMITATION
COPYRIGHT
2018
Christopher Michael Ecker
This work is licensed under the
Creative Commons Attribution- NonCommercial-ShareAlike 3.0 License
To view a copy of this license, visit
iii
ACKNOWLEDGMENTS
First, I would like to thank my mentor and thesis advisor Jim Riley. This work would not have been possible without his support. Jim constantly challenged my ideas and made me a better thinker, scientist and writer. He gave me the freedom to be creative, and believed in me as a scientist before I did. Jim taught me how to take informal discussions on ideas and problems into testable questions and experiments. My thesis committee have been instrumental to the development of my thesis projects and have been extremely generous with their time and guidance.
I would like to also thank all of the Riley lab members (former and current). Jim fostered a laboratory environment in which we all talk and learn from each other. Rachel Leibman and Colby Maldini were/are both brilliant graduate students that provided constant scientific and life advice and helped me create better experiments (aka the “electric factory”). Gavin Ellis, Jan Pawlicki, Kevin Tosh, and Max Richardson are incredible scientists who offered guidance, insight and support over my entire thesis. Hong Kong, Chui Lau, Kevin Gayout, Delaine Winn have also generously given their time. Whether it was lunch time conversations or random complaints about our problems, everyone has always made the lab a great place work. I would like to
iv
Stefana Voicu, and Luis Cortina were all undergraduate students who I was fortunate enough to work with. They all performed many of the experiments throughout my thesis, and are each creatively brilliant in their own right.
Our collaborations with Thermofisher Scientific and Ian Blair’s group were essential for this work. In particular Angel Varela-Rohena, Jackie Padja, Lili Guo, Luis Gil-de-Gómez, and Clementina Mesaros for their generous support, time, and performed a large amount of HPLC and mass spectrometry that made my thesis possible. I would like to thank Douglas Wallace, Kevin Foskett for offering their technical support and
knowledgeable insight into mitochondria and calcium dynamics.
Graduate school cannot be survived without great friendships. I would like to specifically thank Sarah Sneed, Caroline Bartman, Walter Mowel, and Scarlett Yang who have been here with me since the beginning. I would like to thank my friends inside and outside the Immunology Graduate Group for being there when I needed someone. Kilson Lima has been a pivotal rock during my thesis. We drank, danced, and laughed our way around Philadelphia. You all listened to my constant complaints and late night ramblings, and pushed me when I thought I had nothing left to give.
v
ABSTRACT
UNDERSTANDING METABOLIC ADAPTATION OF T CELLS DURING ACTIVATION AND NUTRIENT LIMITATION
Christopher M. Ecker James L. Riley
Immune cells employ a diverse array of metabolic programs upon stimulation that have far-reaching consequences outside of energy production. Activated T cells require glycolysis to generate the biosynthetic intermediates for proliferation and to enhance effector functions. Due to the disorganized vasculature of solid tumors and the highly glycolytic nature of tumor cells, T cells must compete for glucose with tumor cells in a nutrient-depleted environment. We hypothesized that cells that traffic to inflamed, nutrient-limiting environments in the periphery (effector memory T cells, TEM) may have
enhanced abilities to adapt to nutrient limitation compared to cells that largely reside in nutrient-rich lymphoid organs (naïve and central memory T cells, TN and TCM
respectively). We demonstrate that TN and TCM rely on fatty acid metabolism to survive
and proliferate when glucose is limiting, whereas TEM do not. Furthermore, we find the
reliance on fatty acid metabolism in limiting glucose by TN and TCM cells regulates IFN-γ
vi
T cells such as IL-2 production. The second section of my thesis investigates how T cells increase reactive oxygen species (ROS) production following activation. Using
transmission electron microscopy we observe dramatic alterations to mitochondrial morphology following T cell activation. Mitochondria significantly increase in size and their cristae lose parallel patterning during the first 48 hours of T cell activation. Mitochondrial swelling and cristae disturbance are glucose and mTORC1 dependent, and highly reversible. Interestingly, we find that mitochondrial swelling does not correlate to oxidative phosphorylation rate, but strongly correlates to ROS production. We speculate that these mitochondrial changes are required to create the ROS
vii
TABLE OF CONTENTS
ACKNOWLEDGEMENTS……….………...III
ABSTRACT………...V
LIST OF TABLES………..………...IX
LIST OF ILLUSTRATIONS……….………...X
CHAPTER 1. CONNECTING T CELL METABOLISM TO EFFECTOR
FUNCTION………...1
Figures…………......11
CHAPTER 2. THE PERILS OF USING ADOPTIVE T CELL APPROACHES TO STUDY TUMOR/T CELL METABOLIC COMPETITION………..………...15
Challenges T cells face in the solid tumor microenvironment…………..……...15
Challenges of applying immunometabolism findings to tumor models in vivo….20 Figures………….....24
CHAPTER 3. DIFFERENTIAL RELIANCE ON LIPID METABOLISM AS A SALVAGE PATHWAY UNDERLIES FUNCTIONAL DIFFERENCES OF T CELL SUBSETS IN NUTRIENT POOR ENVIRONMENTS……….………..……...28
Introduction…………..………...28
Results…………...31
Discussion…………..………...47
Materials and methods………….………...49
Figures…………..…...56
viii
CHAPTER 4. UNDERSTANDING MITOCHONDRIAL REMODELING DURING T CELL
ACTIVATION ………...105
Introduction…………...105
Results…………...107
Future directions and discussion…………...111
Materials and methods…………..………...114
Figures…………..…………...119
CHAPTER 5. SUMMARY, DISCUSSION, AND FUTURE DIRECTIONS………133
Summary, discussion, and future directions of chapter 3……….134
Summary, discussion, and future directions of chapter 4……….140
Defining the next frontiers of immunotherapy………..144
ix
LIST OF TABLES
CHAPTER 3. Differential reliance on lipid metabolism as a salvage pathway underlies functional differences of T cell subsets in nutrient poor environments.
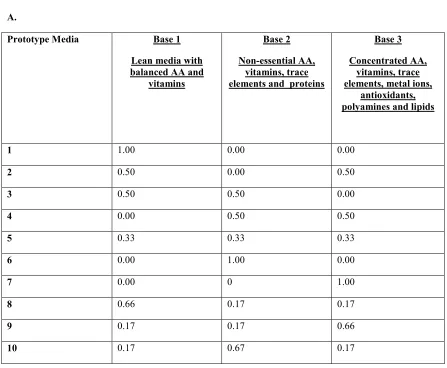
Table 3-1. Creation of prototype media and spent media analysis for development of 1B2H medium.
x
LIST OF ILLUSTRATIONS
CHAPTER 1. Connecting T cell metabolism to effector function. Figure 1-1. Why do cells engage Warburg metabolism? Figure 1-2. Glycolysis provides biosynthetic intermediates.
CHAPTER 2. Translating in vitro T cell metabolic findings to in vivo tumor models of
nutrient competition.
Figure 2-1. Metabolic challenges T cells encounter in the solid tumor microenvironment.
Figure 2-2. Challenges of applying immunometabolism findings to tumor models
in vivo.
CHAPTER 3. Differential reliance on lipid metabolism as a salvage pathway underlies functional differences of T cell subsets in nutrient poor environments.
Figure 3-1. Development and testing of 1B2H media.
Figure 3-2. 1B2H supports and robustly expands human T cells in the absence of human serum.
Figure 3-3. Durable tumor control by CAR T cells expanded in the absence of human serum.
Figure 3-4. Durable control of tumor growth of patient T cells expanded with 1B2H serum-free media.
Figure 3-5. Generation of a chemically defined, customizable media that can expand human T cell subsets in the absence of serum.
Figure 3-6. Gating strategy and purities for sorting human naïve, central memory, and effector memory CD4 T cell subsets.
Figure 3-7. Effector memory T cells are resistant to glucose-mediated IFN-γ suppression.
xi
Figure 3-9. Effector memory T cells express CD25 for a longer duration post-activation in limiting glucose.
Figure 3-10. Effector memory T cells are unable to augment oxidative phosphorylation in low glucose.
Figure 3-11. Effector memory T cells contain fewer lipid droplets than other T cell subsets at optimal glucose.
Figure 3-12. Quantification of loss of lipid droplets and autophagy by activated T cells in limiting glucose.
Figure 3-13. Intracellular abundances of acetyl-CoA and TCA intermediates in activated T cell subsets.
Figure 3-14. Effector memory T cells cannot perform reductive glutaminolysis for fatty acid synthesis in low glucose.
Figure 3-15. Effector memory T cells are less reliant on fatty acid metabolism for survival and expansion in low glucose.
Figure 3-16. Reliance on fatty acid metabolism in low glucose inhibits IFN-γ production.
Figure 3-17. Inhibition of fatty acid synthesis does not significantly affect cytokine production in optimal glucose.
Figure 3-18. Lung T cells lose mitochondrial mass independently of the tumor microenvironment in non-small cell lung cancer patients.
Figure 3-19. Working model for subset-specific adaption to limiting glucose.
CHAPTER 4. Mitochondrial remodeling upon T cell activation
Figure 4-1. Quantitative Scale for Mitochondrial Cristae Disturbance.
Figure 4-2. CD4 T cells reversibly alter mitochondrial structure upon activation in a glucose dependent manner.
Figure 4-3. CD4 T cells adjust mitochondrial structure acutely to changes in glucose availability.
xii
Figure 4-5. Mitochondrial dysfunction correlates to glycolytic rate and not oxidative phosphorylation.
Figure 4-6. Mitochondrial dysfunction correlates to mitochondrial ROS production and polarization.
1
Chapter 1- Connecting T cell metabolism to effector function
Upon antigen encounter in T cells or toll like receptor signaling in macrophages and dendritic cells, glycolysis even in the presence of oxygen is dramatically upregulated in a phenomenon known as the “Warburg effect” (Everts et al., 2014; Frauwirth et al., 2002; Galván-Peña and O'Neill, 2014). Warburg metabolism was first described in cancer cells, in which proliferating cells rely on high rates of aerobic glycolysis (Vander Heiden et al., 2009). Much of the early focus on cancer metabolism examined why highly proliferating cells rely on aerobic glycolysis, as it is far less efficient than oxidative phosphorylation for production of ATP. A number of hypotheses were proposed to explain why proliferating malignant cells largely utilize aerobic glycolysis: 1) cancer cells are forced to use glycolysis because of mitochondrial damage from transformational mutations; 2) the rate of aerobic glycolysis occurs 10-100 fold faster than oxidative phosphorylation; 3) increased glucose uptake allows tumor cells to outcompete healthy cells in nutrient limiting environments; 4) aerobic glycolysis generates biosynthetic intermediates that can be used to produce the necessary building blocks for
2
From a bioenergetic standpoint, it is unclear whether ATP demand ever reaches limiting values during proliferation and there are some models that propose ATP
requirements for division are less than those of normal cellular maintenance (Pfeiffer et al., 2001). The most well supported view is that proliferating cells rely on aerobic glycolysis to generate the cellular building blocks necessary for proliferation. For instance, glycolytic intermediates can produce nucleotides, fatty acids, and amino acids required for creating a new cell (Vander Heiden et al., 2009). In addition, altered concentrations of metabolites can promote proliferation though epigenetic
modifications and reactive oxygen species (ROS) signaling (Kong and Chandel, 2018; Reid et al., 2017). Many of the original hypotheses focused on why aerobic glycolysis was necessary for rapid cellular proliferation, and were specifically applied in the context of T cell metabolism during activation (Fig 1-1). However, these ideas do not
sufficiently explain why macrophages and dendritic cells increase aerobic glycolysis upon TLR stimulation since these cells do not proliferate (Galván-Peña and O'Neill, 2014). It was this observation combined with early work by Chang et al. that proposed a bold new hypothesis, that aerobic glycolysis is necessary for immune cells to initiate effector programs (Chang et al., 2013).
3
functional consequences. T cells have been at the forefront of immunometabolism because they can be easily isolated, expanded, transduced, adoptively transferred, and exhibit dramatically different metabolic states upon activation. In addition, lessons learned from T cell metabolism have been applied and translated to other immune cell types.
Historically, glycolysis has been the most studied metabolic pathway in T cells because glucose is the most consumed metabolite by activated T cells. T cell activation increases glycolysis largely by driving surface expression of the glucose transporter in T cells, Glut1, through Akt signaling (Frauwirth et al., 2002; Jacobs et al., 2008). While T cells predominantly express Glut1, T cells also express transcript for other glucose transporters including Glut 3, 6, and 8 (most of which do not increase mRNA expression following stimulation). Co-stimulation receptor expression is required for maximal Akt activation and Glut1 surface expression and subsequent glycolysis (Jacobs et al., 2008; Macintyre et al., 2014; Siska et al., 2016). Glut1 is expressed in effector T cell subsets such as CD8+ T cells and CD4+ Th1, Th2, and Th17 cells, and all of these cells strongly engage glycolysis following activation to proliferate (Macintyre et al., 2014). Glycolytic intermediates contribute to the numerous biosynthetic and energy generating pathways (the pentose phosphate pathway and serine biosynthesis pathway to generate
4
stimulation in vivo (Macintyre et al., 2014). Interestingly, T regulatory cells appear in
higher numbers in those mice potentially due to increased niche space, and retain suppressive function in in vitro (Michalek et al., 2011). However recent work has suggested that glycolysis is still important in T regulatory cells for migration into inflammatory environments and for in vivo and in vitro proliferation (Kishore et al.,
2017; Procaccini et al., 2016). Furthermore limiting glucose availability specifically inhibits effector function by regulating IFN-γ production by at least two independent mechanisms: 1) available glyceraldehyde 3-phosphate dehydrogenase (GAPDH), a glycolytic enzyme, binds to the 3’ untranslated region of IFN-γ and inhibits translation, and 2) limiting glucose lowers the cellular pool of acetyl-CoA which subsequently lowers histone acetylation of the IFN-γ promoter (which may be highly sensitive to changes in acetylation (Chang et al., 2013; Peng et al., 2016). These mechanisms are further discussed in chapter 3. Interestingly, inhibiting glycolytic rate of proliferating T cells prevents terminal differentiation and promotes memory development of adoptively transferred T cells (Sukumar et al., 2013). The authors further demonstrated that
enforcing elevated glycolysis by overexpressing the glycolytic enzyme, phosphoglycerate mutase-1, promoted effector function at the cost of memory differentiation. Thus glucose works to fulfill the biosynthetic, proliferative, and functional needs of activated T cells and regulates memory development.
5
transporters, including SLC38A1 and SLC38A2 (Bhutia and Ganapathy, 2016; Carr et al., 2010). Glutamine can also be routed into diverse fates critical for proliferating cells. Besides from being used for protein synthesis directly, glutamine can be metabolized into glutamate and subsequently into TCA cycle intermediates, or used for fatty acid synthesis through reductive glutaminolysis, can produce several other amino acids (alanine, aspartate, etc.), and is a critical nitrogen donor for purine and pyrimidine nucleotide synthesis (Cluntun et al., 2017; DeBerardinis and Cheng, 2010). Utilization of glutamate or cell-permeable α-ketoglutarate is not sufficient to rescue effector T cell proliferation in glutamine-deficient media (Carr et al., 2010). These data suggest that glutamine’s roles outside of the mitochondria are critical for activated effector T cells. Interestingly, limiting glutamine availability also promotes T regulatory cell polarization of naïve CD4 T cells, but is reversed by adding cell-permeable α-ketoglutarate, a TCA cycle intermediate and glutamine derivative (Klysz et al., 2015). Interestingly,
glutamine utilization for oxidative phosphorylation and amino acid synthesis pathways may be increased during glucose limitation in T cells to compensate for losses in energy production (Blagih et al., 2015).
Other amino acids at least by magnitude are consumed less than glutamine, but nevertheless serve critical roles in T cell metabolism for proliferation and function. While the glycolytic intermediate 3-phosphoglycerate (3-PG) can be converted to serine, extracellular serine is required for optimal T cell expansion even when glucose
6
novo purine synthesis through one carbon metabolism. Ma et al. further demonstrated
that dietary restriction of serine impairs T cell responses in a mouse model of Listeria monocytogenes infection. In addition, T cells deficient in the neutral amino acid transporter Slc7a5 (most commonly transports leucine), were unable to proliferate or differentiate into effector cells in response to antigen (Sinclair et al., 2013).
Interestingly, these T cells produced equal amounts of IL-2 as wild-type cells but were compromised in glucose uptake and IFN-γ production. Limiting extracellular arginine impairs T cell glycolysis upon activation and subsequent proliferation (Fletcher et al., 2015). Furthermore, the absence of extracellular arginine in activated T cells impairs expression of CD3ε and CD3ζ and production of many cytokines such as IFN-γ, 5, IL-10, but not others like IL-2 (Zea et al., 2004). Tryptophan metabolites in the kynurenine pathway can be produced by the enzyme indoleamine 2,3-dioxygenase (IDO), and are expressed by many antigen presenting cells and tumor cells in the tumor
microenvironment (Schafer et al., 2016). High expression of IDO can cause local
7
Fatty acids perform numerous functions for the cell. They are essential
components of cell membranes, act as important secondary signaling molecules during T cell activation, can post-translationally modify important proteins, and act as an energy resource. T cells often acquire fatty acids from their environment through fatty acid transporters, but can also generate their own by de novo fatty acid synthesis. In
CD4+ T cells, inhibition of a critical enzyme for fatty acid synthesis, acetyl-CoA
carboxylase 1 (ACC1) promoted the polarization of T regulatory cells at the cost of Th1, Th2, and Th17 development (Berod et al., 2014). CD8+ T cells also require ACC1 for survival and proliferative responses during homeostasis and infection (Lee et al.,
2014a). Both Berod et al. and Lee et al. demonstrated that addition of extracellular fatty acids rescues many of these alterations in polarization or defects in proliferation. These data suggest that CD8+ T cells can overcome defects in fatty acid synthesis by
exogenous uptake of fatty acids, however for CD4+ T cells the source of fatty acids and the oxidation or synthesis of those fatty acids may impact polarization. Proliferating T regulatory cells require both fatty acid oxidation and glycolysis for proliferation and function (Procaccini et al., 2016). Promoting fatty acid metabolism by overexpressing carnitine palmitoyl transferase 1a (CPT1a) promotes T cell survival and memory development in vivo (van der Windt et al., 2012). Interestingly, driving fatty acid
8
Glucose, amino acid, and fatty acid effects on T cell polarization and memory development can partially be explained by the mammalian target of rapamycin (mTOR) activity. mTOR acts in two complexes, mTORC1 and mTORC2, and integrates nutrient availability, growth factors and energy levels (as well as other factors) to regulate metabolism and proliferation (Laplante and Sabatini, 2012; Sabatini, 2017). Glucose and many amino acids are required for mTORC1 activation following effector T cell
activation. In turn, mTOR activity can regulate numerous transcription factors involved in glycolysis, fatty acid oxidation, and fatty acid synthesis like hypoxia inducible factor 1α (HIF-1α), myc, peroxisome proliferator-activated receptor alpha, peroxisome
proliferator-activated receptor gamma, and the sterol regulatory element-binding protein family of transcription factors (Waickman and Powell, 2012; Zeng and Chi, 2017). Inhibition of mTORC1 in T cells promotes memory development during viral infection (Araki et al., 2009; Bengsch et al., 2016). Inversely, loss of tuberous sclerosis 1, a negative regulator of mTOR signaling, promotes effector function at the cost of
memory development in a mouse model of Listeria monocytogenes infection (Shrestha
et al., 2014). This patterning of mTOR activity is nearly identical to the observations that promoting glycolysis drives effector differentiation, while inhibiting glycolysis promotes memory development (Sukumar et al., 2013). T regulatory cell polarization and lineage stability require phosphatase and tensin homolog(PTEN), a negative regulator of Akt and mTORC1 activity, to maintain metabolic balance between glycolysis and
9
mTORC1, promotes glycolysis and effector T cell function and polarization (Dang et al., 2011; Doedens et al., 2013). Furthermore mice with deficiency in HIF-1α are strikingly defective in Th17 polarization, while simultaneously promoting T regulatory cell
polarization (Dang et al., 2011; Hsiao et al., 2015). Thus the proliferation, polarization, and function of effector, memory, and T regulatory cells are strikingly dependent on a careful balance of nutrient availability and mTOR activity.
However many of the observations listed above cannot be fully explained by simple mTOR activity. For example, metabolites and metabolic enzymes affect specific cytokine production by immune cells often in surprising and novel ways. None of our current understanding of immunometabolism could have predicted the glycolytic enzyme, GAPDH’s ability to bind specifically to IFN-γ mRNA and prevent translation (Chang et al., 2013). Multiple metabolic intermediates and cofactors (i.e. α-ketoglutarate, acetyl-CoA, S-adensoylmethionine, and nicotinamide adenine
dinucleotide) regulate, or are essential for, the activity of many epigenetic modifying enzymes (Etchegaray and Mostoslavsky, 2016; Wellen et al., 2009). The laboratory of Luke O’Neill has publically presented unpublished work that certain TCA intermediates like succinate may directly regulate the production of effector cytokines. Mitochondria-generated ROS are not just metabolic byproducts that cause damage to cellular
10
Kong and Chandel, 2018; Sena et al., 2013; Weinberg et al., 2010). In addition to their role in energy production, mitochondria appear to serve to produce many important metabolites that can regulate cellular signaling in numerous ways. These roles of the mitochondria in T cell activation are further explored in Chapter 4.
Metabolism is a highly regulated network of pathways simultaneously regulating cell processes well beyond energy production. Recent work has discovered surprising regulatory interactions between metabolites and molecules important for immune function. Future work will need to expand these concepts into in vivo tissue biology
11
12
Figure 1-1: Why do cells engage Warburg metabolism?
For many years researchers questioned why tumor cells relied so heavily on ATP-inefficient Warburg metabolism instead of oxidative phosphorylation. Most of the evidence has supported three main concepts. 1) Tumor cells may gain a proliferative advantage by drastically increasing glucose uptake and consumption, and thus starving nearby cells of the nutrients needed to support proliferation. 2) Glycolytic
intermediates also help to generate important cellular building blocks needed for proliferation. 3) Glycolysis promotes cellular signaling pathways that facilitate
14
Figure 1-2: Metabolic pathways generate intermediates important for biosynthesis in
T cells.
During activation T cells rapidly upregulate glycolysis for energy and to generate the building blocks of a new cells. Glycolysis produces ATP and facilitates de novo
nucleotide production through the pentose phosphate and serine biosynthesis pathway. While most pyruvate is shuttled out of the cell as lactate in activated T cells, some
pyruvate can be shuttled into the mitochondria for the TCA cycle. During activation T cells also upregulate oxidative phosphorylation by increasing fatty acid oxidation, glutamine uptake. T cells can further utilize fatty acid synthesis to generate de novo
15
Chapter 2- The perils of using adoptive T cell approaches to study
tumor/T cell metabolic competition
Parts of this chapter are currently under review in:
Christopher Ecker, James Riley. Translating in vitro T cell metabolic findings to in vivo tumor models of nutrient competition. Cell Metabolism. Submitted.
Exciting new technologies and conceptual advancements have re-energized the study of the metabolic competition between tumors and the adaptive immune system (Chang et al., 2015b; Ho et al., 2015a; Sugiura and Rathmell, 2018). Despite these advancements, there remains little discussion in the literature on how investigators should model nutrient depletion in the tumor microenvironment when studying immune cell/tumor cell metabolic interactions and competition. How can we more accurately distinguish and dissociate nutrient deprivation’s effects on immune cells from other immunosuppressive components of the tumor microenvironment in vivo? Are T
cells engineered with altered metabolic programming specifically overcoming a nutrient limitation or are they simply better tumor-specific T cells that function better in all nutrient environments? This essay will lay out some of the critical issues facing the field and hopefully spur the development of improved approaches for testing new immune therapies. We believe that greater mechanistic understanding of immunometabolism will fully harness the clinical potential of immune therapies.
16
In vivo, tumors alter the abundance of dozens of metabolites in the interstitial
fluid relative to healthy tissue (Kamphorst et al., 2015; Pavlova and Thompson, 2016). Most commonly solid tumor environments have been reported to be deprived of oxygen, glucose, glutamine, and arginine and highly acidic (Fig 2-1 A). Different tumors and even separate regions of the same tumor can host diverse nutrient environments and can experience intermittent blood flow and nutrient supply (DeBerardinis and Chandel, 2016; Vaupel et al., 1987). An abundance of pro-angiogenic factors (like vascular endothelial growth factor-A) promote disturbed vasculature characterized by large and leaky vessels, erratic branching, and irregular and slow blood flow which inhibits efficient nutrient delivery (Carmeliet, 2005; Lanitis et al., 2015). T cells require
glucose, glutamine, and mitochondrial pathways for activation, maximal proliferation and/or effector function (Cham and Gajewski, 2005; Macintyre et al., 2014; Procaccini et al., 2016; Ron-Harel et al., 2016; Sena et al., 2013). Aerobic glycolysis serves the
increased biosynthetic demands of highly proliferating cells. Glycolytic intermediates can produce nucleotides, lipids, and amino acids necessary for cellular proliferation in both T cells and cancer cells (Vander Heiden et al., 2009). Similar reliance on aerobic glycolysis between proliferating cancer cells and activated T cells intensifies a
competition for limited nutrients within the tumor microenvironment. Competition for glucose also plays a clear role in limiting effective anti-tumor responses in vivo (Chang et
17
glyceraldehyde-3-phosphate dehydrogenase (GAPDH) can inhibit translation of IFN-γ mRNA, while another study has demonstrated that the glycolytic enzyme, lactate dehydrogenase A (LDHA), promotes histone acetylation along the IFN-γ locus (Chang et al., 2013; Peng et al., 2016). Although some attempts to increase nutrient availability have been successful, we have little understanding how to make T cells more fit in a nutrient limiting environment (Chang et al., 2015b; Lanitis et al., 2015).
Due to dysfunctional vasculture and the high glycolytic rate of many tumor cells, the tumor microenvrionment is often acidic because of high lactate concentrations (Fig 2-1 B). Both tumor and T cells rely on monocarboxylate transporters to secrete and
uptake lactate generated from glycolysis and pyruvate. High lactate concentrations in the environment prevent T cells from efficiently transporting lactate out of the cell and increase intracellular acidity and inhibit functionality and NFAT activity (Brand et al., 2016; Fischer et al., 2007). Brand et al. demonstrated that melanoma tumor cells engineered to have low lactate dehydrogenase A (LDHA) activity, have greater immune infiltration and activity than tumor cells with normal LDHA expresion. LDHA is the glycolytic enzyme required for conversion of pyruvate to lactate. Furthermore the administration of the proton pump inhibitor, esomeprazole, can normalize tumor pH in
18
As T cells become exposed to chronic antigen in the tumor microenvironment they begin to terminally differentiate and become exhausted. As exhaustion becomes more severe, T cells increase expression of multiple inhibitory receptors, while
simultaneously inhibiting costimulatory receptor expression (Fig 2-1 C). Inhibitory receptors can inhibit co-stimulation and phosphorylation events downstream of T cell receptor (TCR) activation, and prevent activation signals (Akt and mTORC1) necessary for increasing surface expression of the major glucose transporter, Glut-1, in T cells (Jacobs et al., 2008; Siska et al., 2016). Without sufficient surface expression of Glut-1, the activated T cells are unable to properly upregulate glycolysis and have inhibited proliferation and effector function.
19
Furthermore, Scharping et al. demonstrated that overexpression of PGC1α in tumor-specific T cells is able to prevent downregulation of mitochondrial mass and enhance T cell functionality in the tumor microenvironment. Thus
Tumor infiltrating lymphocytes are exposed to large amounts of reactive oxygen species (ROS, Fig 2-1 E). ROS are highly chemically reactive and can damage cellular structures, and inhibit T cell activation. Production of ROS drastically increases in T cells exposed to hypoxia and is one of the major mechanisms of immune suppression by myeloid derived suppressor cells (Kusmartsev et al., 2004; Tafani et al., 2016). Myeloid derived suppressor cells are a heterogeneous immunosuppressive subset of cells overexpressed in patients and mice with cancer. While ROS are necessary for IL-2 production and proliferation by T cells, it remains unclear the quantities in which ROS will become harmful to T cells (Sena et al., 2013). Exposure to oxidative stress by low doses of exogenous hydrogen peroxide are sufficient to inhibit T cell functionality and survival (Ligtenberg et al., 2016).
Challenges of applying immunometabolism findings to tumor models in vivo.
Given the metabolic challenges tumor-specific T cells face, there have been numerous attempts to mitigate these effects via pharmacological or genetic modifications to improve tumor-specific T cell therapy in vivo. However our
interpretation of in vivo studies has been hindered by numerous technical and biological
20
Distinguishing mechanism(s) of therapy
It is incredibly difficult to distinguish whether newly designed immune
interventions targeting the metabolic challenges of solid tumors have generated T cells that operate better in nutrient depleted environments or simply have made a better T cell (that operates better in all environments). The key to distinguishing these
possibilities are 1) identifying how a modification improves the anti-tumor response and 2) understanding how individual metabolic interactions lead to distinct functional outcomes. For example, enhancing mitochondrial fusion, increasing L-Arginine media concentrations, or inhibiting glycolytic metabolism while T cells are being expanded for adoptive cell therapy all enhance the therapeutic activity of the infused T cells (Buck et al., 2016; Geiger et al., 2016; Sukumar et al., 2013). All of these interventions alter T cell metabolism, but do they enable T cells to function better in the tumor
microenvironment? It is challenging to envision a mechanism by which temporarily expanding T cells in low glucose empowers them to function better in the tumor microenvironment. Rather, previous studies demonstrate that T cells expanded in low glucose retain a less differentiated phenotype which enables improved engraftment of the expanded T cells which correlates with improved tumor control (Gattinoni et al., 2011). Expansion in the presence of higher levels of L- arginine also results in T cells that are less differentiated and more reliant on oxidative phosphorylation instead of
21
microenvironment. Likewise, T cells with enhanced mitochondrial fusion are less
differentiated in culture and exhibit greater reliance on oxidative phosphorylation (Buck et al., 2016). Enhanced fusion may enhance mitochondrial function and combat
mitophagy frequently observed during nutrient deprivation (Rambold et al., 2011). How do we determine to what extent differentiation or improved fitness in the tumor
microenvironment results in improved tumor clearance? Future studies must work to better distinguish mechanisms of metabolic immune interventions to provide
mechanistic understanding of immunometabolism (Fig 2-2 A).
Speed of metabolic adaption and metabolite decay
Unlike standard epigenetic or transcriptional changes that often occur over several hours or days, many metabolic changes occur incredibly quickly in response to different environments. This may even be more pronounced in immune cells, because these cells readily circulate and traffic to diverse areas of the body, and thus must be able to adapt rapidly in diverse metabolic environments. While researchers can observe cell intrinsic differences of different T cell subsets in vitro, how much information is lost
because of isolation and prolonged in vitro expansion (Dimeloe et al., 2016a; Pan et al.,
2017; Procaccini et al., 2016; van der Windt et al., 2012)? Quantification is further complicated during conventional in vitro extraction techniques because of metabolite
22
approaches such as utilizing isotopic tracers are highly compatible with in vivo models,
can be easily administered, and may better recapitulate in vivo biology (Hensley et al.,
2016; Sun et al., 2017).
Utilizing relevant cell populations in nutrient depletion studies
Immune cells isolated for nutrient depletion studies should represent the cells that would traffic to sites of inflammation and nutrient depletion in the tumor
microenvironment (Fig 2-2 C). Many in vitro T cell studies have examined nutrient depletion on total T cells isolated from the blood or spleens of mice or humans. However, naïve cells that often represent the majority of T cells in circulation or in the spleen do not travel to sites of inflammation where vasculature is often disturbed or injured (Klebanoff et al., 2006; Thome et al., 2014). Differentiated effector memory T cells or tissue resident memory T cells are the cells that reside in the environments that actually encounter nutrient depletion and have distinct responses to metabolic stress (Dimeloe et al., 2016a; Ecker et al., 2018). Thus, many previous studies have lacked sufficient resolution to determine whether T cells in the blood mimic the same metabolic and adaptive features of T cells that reside in the tissue.
Missing spatial organization of nutrient availability and immune function
23
have higher rates of death in sites of nutrient depletion or do they simply traffic away from those sites? Which nutrients are the most essential for function in vivo? Regions
of nutrient depletion can often be examined through florescent analogues like 2-NBDG for glucose distribution, staining with pimonidazole for regions experiencing hypoxia, or through distinct protein expression of hypoxic or nutrient depleted cells (Airley et al., 2001). These are well validated, and compatible with commonly used methods to identify immune cell localization and activity (Bennewith and Durand, 2004; He et al., 2008; Sukumar et al., 2013). Improvements in the resolution of mass spectrometry imaging techniques have also identified tissue-resident immune populations and metabolite gradients in tumors (Dilillo et al., 2017; Holzlechner et al., 2017). Additionally, sensitive reporter constructs could be useful to map the duration and regional location of nutrient limiting milieus. Elucidating the spatial organization of nutrient availability and immune populations will be crucial for greater insight of immune surveillance in the tumor microenvironment (Fig 2-2 D).
The last decade of research has led to incredible findings and a growing interest in immunometabolism. Researchers have only just begun to understand how to
translate the basic findings into in vivo tumor models and face many challenges. Future studies designed to overcome these challenges will be essential for providing
mechanistic understanding of in vivo immunometabolism and for translating these
24
25
Figure 2-1: Metabolic challenges T cells encounter in the solid tumor
microenvironment.
A. Nutrient limitation and competition. Disturbed vasculature of solid tumors are often unable to provide nutrients critical for T cell activation. Activated T cells and
proliferating tumor cells rely on aerobic glycolysis and compete for extracellular glucose.
B. High extracellular lactate concentrations. Reliance on aerobic glycolysis by tumor cells promotes a large buildup of the waste product lactate in the extracellular milieu of solid tumors. High extracellular concentrations of lactate hinder T cell activation by inhibiting efficient secretion of lactic acid from the cytoplasm and acidifying intracellular pH. C. Hypoxia and MDSC-induced ROS. T cells in the solid tumor microenvironment
are constantly exposed to reactive oxygen species, which are highly reactive and damage cellular structures. Hypoxia rapidly induces ROS production by T cells and myeloid derived suppressor cells frequently suppress effector T cells by secreting ROS.
27
Figure 2-2: Challenges of applying immunometabolism findings to tumor models in vivo.
A. Many researchers have found ways to improve anti-tumor efficacy of adoptively transferred T cells through metabolic manipulation or genetic engineering. Too often though we lack the resolution to distinguish the mechanism by which enhanced tumor efficacy is reached. B. The speed by which cells metabolically adapt to changes in the extracellular environment during extraction procedures, and how quickly some
metabolites can decay or be lost in commonly used isolation techniques hinder our understanding of in vivo biology. C. The most accessible cells in the blood or spleen
28
Chapter 3-Differential reliance on lipid metabolism as a salvage
pathway underlies functional differences of T cell subsets in
nutrient poor environments.
Parts of this chapter were previously published in:
Christopher Ecker, Lili Guo, Stefana Voicu, Luis Gil-de-Gómez, Andrew Medvec, Luis Cortina, Jackie Pajda, Melanie Andolina, Maria Torres-Castillo, Jennifer Donato, Sarya Mansour, Evan R. Zynda, Angel Varela-Rohena, Ian Blair, James Riley. Differential reliance on lipid metabolism as a salvage pathway underlies functional differences of T cell subsets in poor nutrient environments. Cell Reports. 2018.
Andrew Medvec, Christopher Ecker, Hong Kong, Emily Winters, Joshua Glover, Angel Varela-Rohena, James Riley. Improved Expansion and In Vivo Function of Patient T Cells by a Serum-Free Medium. Mol Ther Methods Clin Dev. 2017.
Introduction
T cell responses against tumor are often blunted by the recruitment of
29
well-characterized defect in effector response due to poor glucose availability is the pronounced reduction in IFNγ production following activation of T cells (Cham and Gajewski, 2005; Chang et al., 2013; Siska et al., 2016). Two mechanisms behind
glucose-mediated IFNγ down-regulation have been proposed including: 1) GAPDH, when not involved in glycolysis, binds to the 3’ UTR of IFNγ and prevents IFNγ RNA from being translated (Chang et al., 2013); and 2) the steady state levels of cytosolic acetyl-CoA is reduced in limiting glucose, reducing histone acetylation at sensitive sites like the IFNγ locus and thus lowering production of IFNγ (Peng et al., 2016). However, it is unclear whether either of these two mechanisms is operative, and equally active, in all T cell subsets.
Most data studying T cell responses in the presence of limiting glucose have used cells which are largely naïve (TN) cells rather than human effector memory (TEM) cells
which are the population enriched in the tumor microenvironment (Beura et al., 2016). T cell subsets have remarkably different proliferative capacities, trafficking patterns, and effector capabilities (Sallusto et al., 1999). TEM cells are defined by the lack of lymphatic
homing markers such as CCR7 and CD62-L and loss of the co-stimulatory molecule CD27. TEM cells do not proliferate well relative to naïve or central memory T cells (TCM) but
have enhanced effector functions such as cytotoxic potential and effector cytokine production.
Few studies have examined the metabolism of human TEM cells because they are
30
that have been performed have demonstrated that TEM cells in hypoxia have a survival
advantage and are uniquely adapted to produce IFNγrapidly (Dimeloe et al., 2016b; Gubser et al., 2013; Xu et al., 2016). Human TEM cells are the most common T cell to
reside in the tumor microenvironment and other inflamed environments (Farber et al., 2014; Pagès et al., 2005; Thome et al., 2014). Inflammation often disrupts the
vasculature and can induce hypoxia and deprive cells of valuable nutrients in the inflamed tissue (Eltzschig and Carmeliet, 2011). Thus, TEM cells are often forced to
function in environments that are nutrient deprived. We hypothesized that because TEM
cells must function in nutrient deprived environments, they may have unique metabolic mechanisms to adapt compared to TN or TCM cells. Recent work has shown that fatty
acid oxidation and synthesis is essential for survival, growth, and metastatic expansion of pancreatic cancer and other cancer cells in vivo (Ricciardi et al., 2015; Samudio et al.,
2010; Svensson et al., 2016). We speculated that if pancreatic cancer cells became reliant on fatty acids, T cells found in the same limited nutrient environment might rely on a similar metabolism.
Here we demonstrate like many cancer cells, when TN and TCM cells are starved of
glucose, they augment fatty acid metabolism which drives oxidative phosphorylation and allows these two T cell subsets to survive in limited glucose. This increased reliance on fatty acid oxidation and synthesis correlated with reduced IFNγ expression upon T cell activation. In contrast, TEM cells did not upregulate fatty acid synthesis and could
31
these data suggest that TEM cells are programmed to have limited ability to synthesize
and metabolize fatty acids and as a result TEM cells maintain functionality in limiting
glucose conditions.
Results
Generation of a chemically-defined, customizable medium that can expand human T cell
subsets in the absence of serum
To date, studies that have examined the effects of nutrient availability on T cell function in vitro have relied on media supplemented with dialyzed serum (Blagih et al.,
2015; Chang et al., 2013; Keppel et al., 2015). Serum is ill-defined, making
characterization of key nutrients challenging. Moreover, dialysis of serum is nonspecific. To overcome these limitations, we sought to create a chemically-defined medium that could expand all human T cell subsets without supplementation of human serum. Three different basal media that contained selected groups of components, including fatty acids, metal elements, polyamines, and antioxidants were generated for the study. These media were used alone or mixed at different ratios to generate ten media for the Design of Experiments (DOE) screen (Fig 3-1 A, Table 3-1 A). T cells from seven healthy donors were activated with anti-CD3/CD28 coated beads and their expansion rates were monitored in each of the ten media (Fig 3-1 B). Statistical analysis, harmonization to
32
source supplied to the T cells was optimized (Fig.3-1 E, Table 3-2) and compared to that of medium actively being used in clinical trials of adoptive T cell therapy, X-VIVO 15TM
media supplemented with 5% human serum.
There is no consensus on what is the best media to use for adoptive T cell therapy; however, most groups to date have used RPMI 1640, AIM V,or X-VIVO 15 media (Cruz et al., 2013; Lee et al., 2015; Maude et al., 2015). Both AIM V and X-VIVO 15 are defined as serum-free media, but in the T cell manufacturing process used to treat patients, human serum is universally added, largely because patient-derived T cells fail to grow optimally in serum-free media and exhibit reduced efficacies of gene
transfer resulting from less than optimal T cell activation. We decided to examine which medias could maximally expand human T cells in the absence of human serum. As expected, RPMI 1640 required the addition of human serum to promote T cell
33
An in vivo model of CAR T cell therapy was developed, which has proven
informative for predicting clinical results in humans (Grupp et al., 2013; Kalos et al., 2011; Porter et al., 2011). In this model, NALM6, a pre-B cell leukemic cell line that naturally expresses CD19, was engineered to express luciferase and engrafted into NOD/SCID-γc−/− (NSG) mice. If CD19-specific CAR T cells are added within a week, tumor
clearance is observed within 10–14 days. However, if the experiment is extended, leukemia returns in most animals and durable cures are not observed. We sought to determine whether T cells expanded in 1B2H could perform in vivo as well as T cells
34
mouse studies and clinical data from patients have shown a strong correlation with the level of T cell persistence after adoptive transfer and the ability to provide durable control of tumors (Maude et al., 2014; Milone et al., 2009). Likewise, we observed superior T cell engraftment that was sustained for much longer in cells expanded in the absence of serum (Fig 3-3 C, D). Together, these data suggest that human serum is not only dispensable, but is also hindering the ability of CAR T cells to function, persist, and control tumor growth.
Traditionally most CAR studies have focused on ex vivo transduction and
expansion and subsequent autologous transfer of a patient’s own cells, which are highly differentiated and poorly proliferative compared to a healthy donor’s T cells. Thus we examined the functional properties of the multiple myeloma patient T cells expanded in X-VIVO 15 or 1B2H, with and without serum. Here, the addition of serum did not
significantly alter the functional profile of the expanded CD19-specific CAR T cells because there were no consistent differences between T cells grown in 1B2H or X-VIVO 15 (Fig 3-4 A, B), suggesting the functional abilities of fully differentiated T cells are not modulated by the presence of human serum or media in which they are expanded. We then addressed the ability of these expanded T cells to control NALM6 tumors in vivo. As
a control, we also expanded CD19-specific T cells from a healthy individual so we could compare in vivo function of T cells from healthy donors and multiple myeloma patients.
35
tumor burden after 12 days of treatment (Fig 3-4 C) and none of these mice durably controlled tumor growth (Fig 3-4 D). As before, the leukemia relapsed in most mice treated with CD19-specific T cells expanded in either 1B2H or X-VIVO 15 supplemented with human serum. Impressively, T cells isolated from multiple myeloma patients engineered to be CD19 specific and expanded in 1B2H SFM provided durable control of tumor in all mice treated and had equivalent therapeutic potency as similarly
engineered and expanded T cells isolated from a healthy donor.
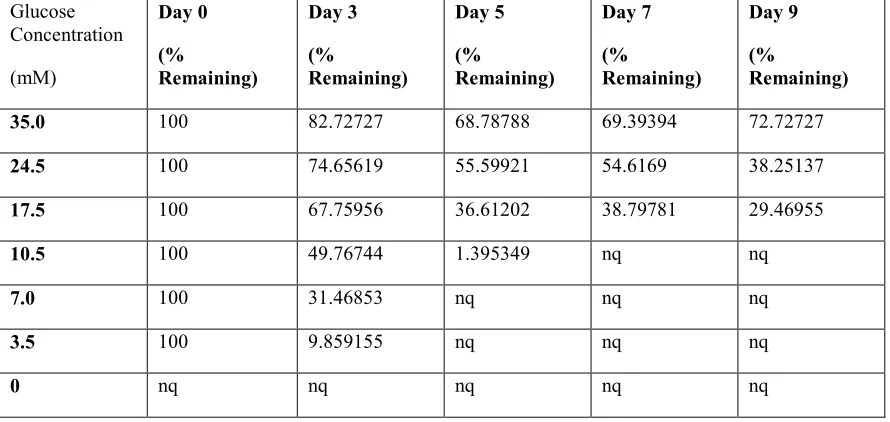
While physiological glucose concentration in human blood is around 5mM, we found that the static optimal glucose concentration that allowed maximal T cell
expansion and maintained high glucose concentrations throughout culture conditions is 35mM (Table 3-2). To ensure that our medium, called 1B2H, could be customized to study T cell metabolism, we generated 1B2H variants that were glucose or glutamine free. We found that T cells could not divide in media free of glucose or glutamine, demonstrating that our media contained no nutrients that could substitute for either glucose or glutamine (Fig 3-5 B). To examine how well human T cell subsets grew in our created medium in the absence of serum, we sorted TN, TCM and TEM CD4 T cells and
36
medium that can facilitate the study of metabolic differences between human T cell subsets. We were able to utilize our collaboration with Thermofisher Scientific to further customize this defined media to add and withdraw specific nutrient components
specifically, without the need for dialysis.
Effector Memory T cells are resistant to glucose-mediated IFNγ suppression
We next examined how low glucose altered human T cell subsets’ ability to expand, adapt functionally, and differentiate. We sorted TN, TCM, and TEM (Fig 3-6 A-I)
and stimulated them with anti-CD3/CD28 coated beads in the presence of optimal glucose (35mM) or low glucose (0.35mM). As expected, all T cell subsets have
substantially reduced growth in low glucose (Fig 3-7 A). We next examined the ability
of freshly sorted human T cell subsets to produce IFNγ in the presence of optimal or low glucose after PMA/ionomycin stimulation. TN and TCM cells made less IFNγ in low
glucose, consistent with previous reports (Cham and Gajewski, 2005; Chang et al., 2013; Chang et al., 2015b; Ho et al., 2015a). However, TEM cells made equivalent levels of
IFNγ (Fig 3-7 B, E), suggesting that the effector functions of TEM cells are not
compromised in poor nutrient environments. Interestingly IL-2 and TNFα (Fig 3-7 B,C, Fig. 3-8 A-F) are not affected by glucose availability. Therefore, we expanded T cells from Fig 3-7B for 10-12 days and determined their ability to make IFNγ and IL-2 upon re-stimulation. We observed expanded TN cells still have a profound defect in their ability
to produce IFNγ in low glucose, whereas both expanded TCM and TEM cells produced
37
ability of expanded but not freshly isolated TCM cells to make high levels of IFNγ in the
presence of optimal or low glucose is likely tied to their more differentiated phenotype after expansion (Fig 3-7 D, G, H). Furthermore, we found that while all cells up-regulate CD25, the IL-2 receptor, following anti-CD3/CD28 bead activation in both optimal and low glucose, TN and TCM cells lost CD25 expression quickly following activation in low
glucose whereas TEM cells were able to maintain heightened CD25 expression in limiting
glucose (Fig 3-9 A-D), suggesting that they can maintain an activated phenotype in poor nutrient conditions. Cumulatively these data show that TEM cells maintain function in
low glucose whereas TN and TCM make less IFNγ and lose CD25 expression.
Effector memory T cells do not augment oxidative phosphorylation in low glucose
38
the increase in OCR in limiting glucose was blocked by etomoxir, a drug that blocks fatty acid intake into the mitochondria by inhibiting carnitine palmitoyltransferase (Fig 3-10 D). However, etomoxir treatment did not significantly alter ECAR, intracellular lactate or extracellular lactate production (Fig 3-10 C, G, H). TN and TCM cells behave in a similar
fashion to total T cells by exhibiting reduced glycolysis and augmented OCR when cultured in low glucose (Fig 3-10 E, F). Furthermore, etomoxir inhibited the OCR of all T cell subsets only in low glucose, without altering their glycolytic rate (Fig 3-10 I-N). These data show that effector memory T cells metabolically respond to low glucose distinctly from other T cell subsets by not augmenting oxidative metabolism.
Effector memory T cells contain fewer lipid droplets than other T cell subsets in optimal
glucose
Because TN and TCM, but not TEM could compensate for low glucose by
augmenting oxidative phosphorylation in a fatty acid dependent manner, we wanted to examine the supply of lipids stored within the cell. Lipid droplets are dynamic
39
glucose could not store lipid droplets, because they were using lipids as fuel for
oxidative phosphorylation. To determine whether lipids were being consumed in T cells when cultured in low glucose, we first activated T cells in optimal glucose for 48 hours, and then placed them in low glucose for an additional 0, 4, 8, 24, or 48 hours. We further quantified lipid droplets by staining cells with the lipophilic dye bodipy 493/503 which is commonly used to mark neutral lipids (Singh et al., 2009). Significant
decreases in bodipy florescence of stained lipid droplets were observed after placing cells in low glucose for greater than 24 hours, indicating that T cells consume lipid droplets when placed in nutrient poor conditions (Fig 3-11 B, Fig 3-12 A). After 6 days of
culture, we observed significant number of autophagosomes (Fig 3-12 B). Under normal conditions autophagic protein microtubule-associated protein 1 light chain-3B (LC3B) consists largely of its cytoplasmic form LC3B-1. However during autophagy, LC3B becomes conjugated to phosphatidylethanolamine forming LC3B-II and is recruited to the membrane of autophagosomes (He et al., 2003). We found that T cells cultured in optimal glucose maintained higher levels of LC3B-I compared to LC3B-II whereas T cells cultured in low glucose had much more LC3B-II than LC3B-I (Fig 3-11 C-E, Fig 3-12 D-E), confirming that T cells were performing autophagy in response to low glucose.
40
lipid droplets, we transduced T cells with a lentiviral vector expressing LC3B fused to mCherry, a pH insensitive fluorescent reporter. We found that lipid droplets marked by bodipy 493/503 often co-localized with the autophagosomes (Fig 3-11 D), suggesting that autophagy was responsible for lipid droplet breakdown and consumption.
Furthermore, we found that inhibiting mTORC1 via rapamycin, a well-known method of inducing autophagy, increased T cell growth in low glucose but not in optimal glucose. We found that the enhanced growth by rapamycin was blocked when co-administering Lys05, while expansion was not significantly inhibited by Lys05 alone in low glucose (Fig 3-12 F-H). These data support the idea that promoting autophagy can increase T cell
expansion in low glucose possibly by increasing lipid consumption. Next, we isolated T cell subsets to examine if TEM cells may fail to up-regulate oxidative phosphorylation
because they cannot uptake lipids and store them as well as TN or TCM cells. We observed
TN and TCM cells cultured in optimal glucose had significantly higher amounts of lipid
droplets per cell per micrograph than TEM cells (Fig 3-11 E, G). These data demonstrate
that TEM cells acquire fewer lipid droplets in optimal glucose, suggesting that lipids may
not be the preferred alternative fuel for TEM.
Effector memory T cells are unable to perform reductive glutaminolysis for fatty acid
synthesis when cultured in low glucose
41
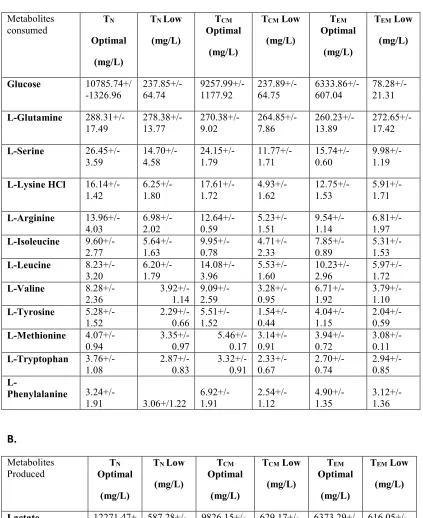
glucose (Blagih et al., 2015). We quantified the rates of consumption/production of glucose, amino acids and a few organic acids in the supernatant of activated T cells (Table 3-3 A, B). As expected, T cells primarily consumed glucose and glutamine. Additionally, we observed high consumption of serine, supporting recent findings that serine is essential for de novo nucleotide biosynthesis (Ma et al., 2017a). T cells in low
glucose regardless of subset, consumed fewer amino acids, likely due to overall reduced level of T cell activation. Interestingly glutamine was equally consumed by T cells at optimal or low glucose; thus, relative to other amino acids, glutamine was preferentially consumed by T cells cultured in low glucose. Surprisingly, TCA cycle intermediates demonstrated different patterns of abundance, suggesting complex regulation of the TCA under nutrient stress (Fig 3-13 A-G). To examine how glutamine was utilized, we cultured T cells in the presence of labeled glutamine and examined how it was
42
A citrate with 5 heavy carbons suggests reductive glutaminolysis where glutamine is being routed into fatty acid synthesis (Fig 3-14 B). We found that TN and
TCM cells had higher relative amounts of citrate M+5 when cultured in low glucose,
suggesting that some of the glutamine imported into T cells was being converted to fatty acids (Fig 3-14 A). TEM cells, on the other hand, did not to appear to upregulate
fatty acid synthesis in the presence of low glucose since the relative percentage M+5 was the same regardless of the T cells being cultured in optimal or low glucose. To confirm this, we examined both M+2 and M+4 palmitate which would directly show glutamine being converted to fatty acids. Interestingly, we observed that TN and TCM
cells expanded in optimal glucose had higher levels of M+2 palmitate than their respective groups grown in low glucose, but higher M+4 palmitate (Fig 3-14 H-J). In contrast, TEM cells have low levels of M+2 palmitate when cultured in both optimal and
low glucose, suggesting that very little glutamine gets converted to fatty acids in TEM
regardless of the glucose levels present. These data indicate that reductive
glutaminolysis is occurring at a higher rate in TN and TCM cells cultured in low glucose.
Only small amounts of M+4 palmitate was detected in TEM cells further confirming very
little glutamine is converted to fatty acids in TEM regardless of the glucose levels present.
43
reductive glutaminolysis (Fig 3-14 D). Interestingly, all T cells subsets redirect glutamine into production of pyruvate by having increased M+3 labeling of pyruvate, making an estimated 20% of the intracellular pool in low glucose (Fig 3-14 K). Additionally, ~10% of the intracellular pool of lactate is made from glutamine, suggesting that this glutamine-derived pyruvate is converted into lactate (Fig 3-14 L). We found that all subsets when cultured in optimal glucose secreted approximately 1.5 moles of lactate per mole of glucose consumed, consistent with previous reports showing that most of the glucose utilized is converted into lactate (Frauwirth et al., 2002). However, when T cells were cultured in low glucose, we found that lactate/glucose ratios exceeded 2, suggesting that a carbon source other than glucose was being used to produce lactate (Fig 3-14 M). Together, T cells appear to be adept at using glutamine to fulfill a diverse array of metabolic needs when glucose is limiting with the notable exception that TEM cells are
unable to use glutamine to produce fatty acids.
Effector memory T cells are less reliant on fatty acid metabolism for survival and
expansion at low glucose
With evidence of fatty acid droplets being consumed in low glucose and data demonstrating that glutamine was being redirected into fatty acid synthesis by TN and
TCM cells, we sought to explore the importance of fatty acid metabolism for the survival
44
glucose and significant inhibition of T cell expansion in low glucose (Fig 3-15 A, B). We further examined how TOFA affected the expansion of T cell subsets grown in low glucose. TN and TCM cells behaved in a similar manner to total T cells and suffered
severe proliferative defects when cultured in low glucose (Fig 3-15 C). In contrast, expansion of TEM cells was only marginally affected by TOFA in both optimal and low
glucose. However, T cells can also uptake fatty acids from exogenous sources (O'Sullivan et al., 2014). We quantified surface expression of CD36, a scavenger receptor that is thought to be important for uptake of long-chain fatty acids (Glatz and Luiken, 2016; Schwenk et al., 2010). We observed that TN and TCM cells could
up-regulate CD36 when grown in low glucose, while TEM cells did not (Fig 3-15 D-E).
Together these data suggest that TEM cells are not as reliant as TN or TCM cells on fatty
acid synthesis or uptake of exogenous fatty acids to expand in limiting glucose.
To further characterize which T cell subsets, if any, are dependent on exogenous fatty acids we prepared fully defined, serum free media that lacked all species of lipids (Fat-Free). Despite an early defect in proliferation, we found that total T cells in optimal glucose in the absence of lipids expanded nearly as well as T cells in the presence of lipids (Fig 3-15 F). However, in low glucose, the lack of fatty acids severely impaired T cell expansion. This pattern remained consistent in TN and TCM cells, their expansion was
severely inhibited in fat free media when grown in low glucose (Fig 3-15 G). Surprisingly, TEM cells grew equally well in the presence and absence of lipids in low
45
exogenous lipids into the TCA cycle. In agreement with our data in Figure 2, we found that all subsets equally increased their incorporation of exogenous fats into acetyl CoA (Fig 3-15 H). We examined the viability of T cells and observed that most of the TN and
TCM cells were dead in low glucose, fat-free media whereas TEM cells had near equivalent
viability in the presence and absence of lipids (Fig 3-15 I-J). Cumulatively, these results show that TEM cells are not as reliant as TN or TCM cells on lipid metabolism to expand or
survive in low glucose.
Impairment of fatty acid synthesis in naïve T cells augments IFNγ expression
Our data demonstrate a strong correlation between a T cell subset’s ability to utilize fatty acids and subsequent ability to produce IFNγ in limiting glucose. To determine whether there is a relationship between IFNγ expression and fatty acid metabolism, we first asked whether a reduction in fatty acid synthesis would augment IFNγ production. To do this, we used a dose of TOFA (5µM) that permits TN cells to
survive in low glucose and then examined their ability to make IFNγ. Blocking fatty acid synthesis in TN cells significantly increased their ability to make IFNγ (Fig 3-16 A,B). This
did not however impact TEM cells ability to produce IFNγ, further confirming the notion
that TEM cells are not actively synthesizing fatty acids and thus are insensitive to TOFA.
Interestingly, blocking fatty acid synthesis did not impact the production of other cytokines such as IL-2 in any of the subsets (Fig 3-16 C), suggesting that IFNγ is