COMMISSION OF THE EUROPEAN COMMUNITIES
REGIONAL DEVELOPMENT
IN THE COMMUNITY
ANALYTICAL SURVEY
REGIONAL DEVELOPMENT
IN THE COMMUNITY
ANALYTICAL SURVEY
Contents
GENERAL INTRODUCTION
Part One: DEMOGRAPHIC ASPECTS
Introductory remarks
1. Limitations of statistical material
2. Layout of the analysis
I. II.
I.
II. I. II. III.Regional population variations
1. Variation rates - general survey
2.
Changes in regional shares between1950
and1968
The factors determining population size
1. Natural movements (birth and death rates) 2. Migrations
Regional population densities
1. Statical analysis
2. Geographical analysis
3.
Lorenz curvesThe relationship between population density and population growth
Indicators of population movement
1. Cumulation and counteraction of natural movements and migrations
2. The most marked rates of change
Population density and indicators
1. Sparsely populated regions
2. Re?ions with a very dense population
-3-Part Two: LABOUR FORCE AND EMPLOYMENT
Introductory remarks
page
50
1. Limitations of statistical material
2. Layout of the analysis
I.
II.I.
II. I. II.General survey at national and Community level
1. Trends in absolute terms
2. Employment in agriculture as a proportion of total employment
Regional trends
1. Trends in the share of total employment
54
54
54
55
56
accounted for by agriculture 56
2. Percentage changes in agricultural employment 60
3.
Links between the initial situation and the changes63
General survey at national and Community level
1. Trends in absolute terms
2. Secondary employment as a proportion of total employment
Regional trends
1, Rates of change in secondary employment
2. Changes in secondary employment, in relation to agricultural employment
3,
Trends in the share of the secondary.sector in total employmentGeneral survey at national and Community level
1. Trends in absolute terms
2. The tertiary sector in total employment
Re,e:ional trends
1. Rates of change in tertiary employment
2. Correlations between trends in the tertiary and secondary sectors
3.
Trends in the share of the tertiary sector in total employmentE,
Total employment
===c============
I.
II,
General survey at national and Community level
Regional trends
1.
2,
Percentage changes
Offsetting
The share of the main geographical areas in total
=================================================
I. Changes in the distribution of total employment
II. Changes in the distribution of employment in
the primary sector
III. Changes in the distribution of employment in
the secondary sector
IV. Changes in the distribution of employment in
the tertiary sector
Part Three: PRODUCT AND INCONE
A,
B,
General Remarks
---
---I.
1. 2.3.
4.
Shortcomings of the statistical material
The different concepts of product
The notion of "gap"
Plan of study
Regional product in the Federal Republic of Germany
1 •
2.
3.
4.
Initial situation
Regional economic growth
The trends in differences
Regional contributions to national gross domestic product
II. III.
IV.
v.
VI.c.
-5-Regional aggregates in France
1 • Presentation of the various sources of data
2. Distribution and growth of direct households
income
j. The development of differences
4.
Hegional shares of direct national incomeRegional product in I-taly
'1.
2.
).
4.
Initial situation
Hegional economic growth
The development of differences
The share of the regions in the gross naticnal domestic product
Hegional product in Belgium
1 •
')
"-•
).
4.
Initial situation
Regional economic growth
The development of differences
The share of the regions in the gross national domestic product
Hegional product in the Netherlands
1 •
2.
3.
4.
Initial situ~tion
Regional economic growth
The development of differences
The share of the regions in the gross national domestic product
The product of the Grand Duchy of Luxembourg
1 •
2.
Main conclusions to be drawn from the trends in the Member States
The trends at Community level
GENERAL INTRODUCTION
In 1969 the Commission submitted a preliminary analysis of regional development
in the Community, as an annex to the memorandum on regional policy in the Community
and the proposal for a Council decision on the organization of Community instruments for regional development, published under the title "A regional policy for the
Community". The analysis covered three aspects - population, employment and
product-on the basis of the 40 regiproduct-ons and 19 main geographical areas of the Community; it
sought to identify the main structural features and the changes that had taken place
in the previous 15 to 20 years.
The following "Analysis 197111 also has three parts dealing with trends in
population, employment and regional product and, in general, uses the same data as
the previous analysis. It is thus a horizontal survey, providing a detailed picture
of regional, demographic, employment and product trends in the Community but
disregarding the vertical correlations between these fields (such as the correlation
between population growth and the labour force, between employment and product, etc.) and the specific problems of certain regions.
This attempt to identify more clearly the regions, on an individual or group basis, with the help of quantitative criteria has led to the development of a
number of indicators which can be used to classify the regions from various angles and to identify specific problems.
Furthermore, the findings of the 1969 analysis have been updated in the light of the latest available data.
Finally, the use of smaller regional units means that the analysis is more detailed and thorough.
These territorial units or "basic regions" are:
in Germany (FR) the 38 Regierungsbezirke and
city-states 1
in France the 21 programmed regions 2
in Italy the 20 administrative regions
in Belgium the 9 provinces
in the Netherlands the 11 provinces
in Luxembourg the entire country.
-7-It was necessary to resume the analysis on the basis of these 100 regions for several reasons:
(i) certain important demographic, economic and social phenomena only become apparent at this level;
(ii) the basic regions often constitute the framework for regional development plans, programmes and measures;
(iii) the basic regions are often socio-economic and administrative units with a certain degree of autonomy.
These points are not, of course, equally valid for all the countries in question, Furthermore, the imbalances between the basic regions reveal the inherent relativity of all regional delimitations; this is why the use of the 100 regions does not rule out reference to other units when necessary. Main geographical areas and regions are also referred to in this report from time to time.
The key features - total popula~ion, population density, area, product, etc. - are set out in the annexed tables.
In onler to give a general picture of how the 100 basic regions compare with the other administrative units, in particular the regions used in the 1969 analysis, Table 1 below gives the indices of the average population of these various types of territorial units (Community = 100), Furthermore, Table 2 compares the population of the basic regions with the national average.
Table 1
Population of administrative regions in 1968 ('000)
Main geographical areas Regions Basic regions Subordinated adminis-trat.$Ve units
···-·
I
Number average index number average index number average index number average index
population population population population
Germany (FR) 4 a 14 446.3 147.66 11 5 449.9 120.02 38 1 577.6 84.87 564 106.3 99.61
France 3 16 561.2 169.27 9 5 520.4 121.76 21 2 365.9 127.27 95 523.0 490.10
Italy 4 13 414.0 137.11 1'1 4 877.8 107.59 20 2 682.8 144.32 92 583.2 546.54
l:lelgium 3 3 201.8 32.73 5 1 921 • 1 42.37 9 1 067.0 57.40 44 218.3 204.58
Netherlands 4 3 165.2 32.35 4 3 165.2 69.81 11 1 151.0 61.92 9'35 13.5 12.69
Luxembourg 1 335.0 3.42 1 335.0 7-39 1 335.0 18.02 12 27.9 26.16
COMMUNITY 19 9 783.7 :too.0o 41 4 533.3 100.00 100 1 858.9 100.00 1742 106.7 100.00
Table 2
Population of the basic regions: Maximum divergence f'rom averages (in 1968)
minimum maximum average coeff. of variation (%)
Germany (FR) 277.0 5 605.2 1 577.6 65.8
France 736.3 9 2-38.3 2 365.9 75.6
It,{ly 106.9 8 129.9 2 582.8 75.6
Belgium 219.4 2 148.5 1 067.3 53.0
Netherlands 298.5 2 922.5 1 151.0 69.9
Luxembourg 335 .. 0
Community 106.9 9 238.3 1 858.9 82.7
a Excluding Berlin (West)
i
I
-9-Part One: DEMOGRAPHIC ASPECTS
1. Limitations of statistical material
Like its predecessor, this analysis was hampered by the shortcomings of the available demographic statistics, namely
(a) the absence of certain data
(b) the heterogeneity of the definitions and methods employed.
The shortcomings were discussed in detail in the previous analysis and will not be described here.
The study was able to take into account the Luxembourg and French census returns of 1966 and 1968 respectively, but not those of censuses held in other
countries in 1970 and 1971. Consequently, some of the figures given below will
have to be revised.
In the case of Italy, where the next census will not be held until 1972,
the differences between the national and regional resident (de jure) and present-in-area (de facto) population as revealed by the last two censuses, of 1951 and
1961 (see annexed Table D VI) were calculated. In these two years, the
differences were 0.75% and 1.4% respectively at nation~l level, and reached a
maximum of 6.6% at regional level.
The shortcomings of these statistics were clearly revealed by attempts to
obtain a clearer picture of intra-regional migrations. These are fundamental
Finally, the chapter on the concentration of the population deals with a number of problems concerning the delimitation of conurbationsand rural areas
on the basis of uniform criteria. The Community study of these problems is
still in .its very early stages.
A thorough study of these two types of areas should be begun promptly at
Community level, since the most important structural changes result from this inter-regional migration.
2. Layout of the analysis
The following chapter takes up and discusses in more detail, at the level
of the 100 basic regions, the subject matter of the analysis annexed to the
Memorandum on regional policy in the Community.1
Accordingly, demographic trends and their determining factors (natural
increase and migration) are studied in the first part; changes in the
distribution of the population are discussed in more detail in the second part,
with special reference to concentration; finally, the regions are clas:;;ified
according to various criteria in the third part.
It will appear in the course of the analysis that emphasis has been put on
compiling a synoptic set of indicators for demographic trends an\! situations. The
main indicators are listed below.
(i) Individual :regional indicators
(a) Rate of variation of the total population;
(b) Rate of natural increase broken down according to birth rate and death
rate;
(c) Migration rate (migration per 100 inhabitants), broken down according to inter-regional migrations and international migrations;
1
-11-(d) Regional (percentage) shares of the total national or Community
population;
(e) Population density;
(f) Ratio of population density to population growth.
(ii) Overall indicators
(a) Standard deviation, 1 giving the range of above-mentioned absolute figures or rates around the arithmetic mean of the relevant series;
(b) Coefficient of variation, or the ratio of the above-mentioned standard
deviation to the arithmetic mean of the relevant series;2
~ (ai - bi)
(c) Concentration index I
=
,
where i represents the different2
classes of density, ai the population percentages of each class and
bi the corresponding percentages of area.
1The standard difference
6
is defined asv~(x
- - 2 x)1
x
being the narithmetic mean of the series, n the number of elements x1, x2 •••
2v
=
tf..
I. Regional population variations
1. Variation rates - general survey
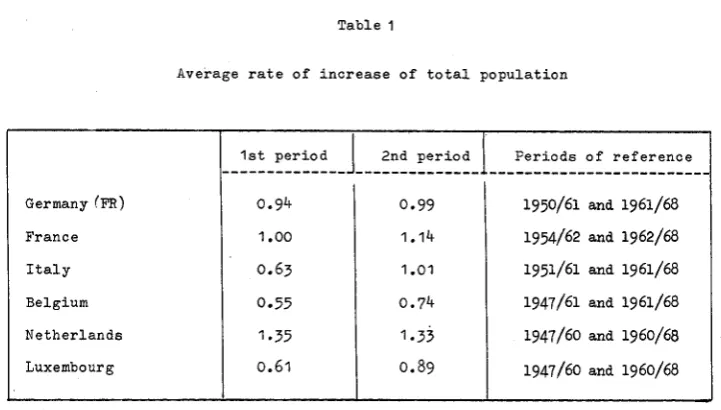
In the two periods in question, 1950/60 and 1960/681 the total
population increased - though at fairly different rates - in all the Member States (see Table 1 below).
Table 1
Average rate of increase of total population
--~~=-:~~=~~--J---=~~-:~~=~~-1
___
::~=~~~-~:-~~:~~~~=~--Germany (FR) 0.94 0.99 1950/61 and 1961/68
France 1.00 1.14 1954/62 and 1962/68
Italy o.63 1.01 1951/61 and 1961/68
Belgium 0.55 0.74 1947/61 and 1961/68
Netherlands 1.35 1.3:3 1947/60 and 1960/68
Luxembourg 0.61 0.89 1947/60 and 1960/68
In all Member States except the Netherlands, the average annual rate of increase was slightly higher in the second period than in the first.
As regards regional trends, the annexed tables D II 1-5 give, for each of the 100 regions, the trend in absolufe terms and the average rate of increase in the two periods of reference.
These tables show that regional demographic trends, as measured by rates of increase, differed fairly sharply both between the countries concerned and between the two periods.
[image:14.464.69.430.168.373.2]COMMUNITY BASE REGIONS: CHANGES IN TOTAL POPULATION
1950·1960
o"'\1'
~
THE BASE REGIONS CLASSIFIED BY RATE OF CHANGE IN POPULATION
F 1& £)..~9
F 17 0.'6 035 0,1,5 IIJ 032
D 3 0,1,5 F 8 0.92
FIS O,H F6 031
N/0.0 B 1 0.86 017 '·"
o 1 o.•o F20 Q8J 019 ' "
110 0.39 F J 0,78 018 1.J7 FlO QJ6 I 5 0.75 02'1 1.36 N111.95 1 a 0.1' B 2 0.73 fo/8 1,J2 Nlo 1.8' N 2 QJ2 I 2 072 F/9 1.2' 02~ 1.83
036 O.J2 F 2 0.72 0 2 12' F I 1.18
B' 0.31 Fll 0,65 I< 121 0" 1.77 B 6 0.29 fo/9 0.6' N7 1,16 N' 1.71
B 9 0.26 OJ' 0.6' 021 1.11 112 1,71
I 17 0.25 022 0.6' OJ/ uo N6 1,66
OJJ 0.25 016 0.61, DJ7 1.09 N 5 1.65 Fll, 0.22 F 5 0.6J 030 1,0& B 7 1.60 OJ8 0.22 L 0,61 N 3 1,07 017 158 F12 0,19 116 0.60 120 1.07 DIS 1.58
s so." 02J 0.59 I 1 107 029 1.57
B 8 0.11 F16 0.56 F' 1P7 025 1.56
OJ2 0,07 I 19 0.51 I J !OJ F21 151
\~
...
_
118 0.00 8 J 0.50 F9 1,00 F 7 1.50
LEGEND
~ ... State frontiers
Regwnal boundar1es Boundanes of base admmlstra!IOO UOI!S
INCREASE
-
>
2,00•1. A¥trogt annual rate1,50
<
2,00/,00
<
/,50~
0,50<
/,00w~
0<
0,50DECREASE
1 ... ...
>>.
:
,
j
-o
.
so
<
o1
1
-1.00<
-'0,50[
!!!!!!~::::::::::::::::::~:
::~
<
-
1,00-;./ZO..
100
"
THE BASE REGIONS CLASSIFIED BY RATE OF CHANGE IN POPULATION
5QQ:LQJI o-<oso II oso-<100 II 1oo-< 1so II 1so-< 200 I~
F2 0,99 N7 0.9~
Nl 0.~
12 0.~
FT'l D.97 020 0.97 I 5 0,95
011 0.95
116 092
q
06 0.90 I I "~
<0
L 0~9 Fl "6
DJ' 0,66 N' 1,,3 N 2 0.~7 026 1.'2 8 I 0,85 a 5 1.39 DIS o.as 027 1,31
032 0.~3 023 1.2'
0
037 0.~1 I J 1,20 I 6 0.~0 113 1.19
~
Fll 0.~0 F~ 1,16 120 0.77 a 1 1,16
025 0.75 F5 1.15
8 J 0.73 F' 1.15 Fl2 ~g FJ~ 0.72 036 1,15
8 6 FlO g~b 02, 1.15 8 ' 0.'' F6 au
'·"
0 Fl5 QJ' N9 0.68 010 1.13 N5
m
j a• 033 110 0.67 82 1.12 NIO
~
~
DJJ 0.30 I 7 0,32 a 012 0.63 J o,67 035 F9 1.12 1.09 87 013 1,45 1,81s g. /18 0,27 119 0.61 019 1,09 029 !.71.
~ ~ 88 ~fg I 8 0.61 FJ (06 028 1,70 85 F7 0.60 016 (05 NJ 1.68
0:
..
09 0.13 OJI 057 DB 1,05 N6 1,62IU 0.12 022 0,57 Fl6 1,0, I ' 1,62 F21 2,58
19 0.11 8 9 0,5, 021 1,0, F/9 /,60 112 2.2'
\~
,_
FIJ
ggg
F" g~g NB !02 F20f.M
DJO 2.0202 017 07 00 Nil 018 2,02
LEGEND
---INCREASE
Statefront1ers
Regional boundanes
Boundanes of base
admmlshatJOn un1ts
- •2.00% A ... ag• a'"ual ••••
- 1,50( 2.00
1B!
1.00<
1.50~
Q50(1,00~
o (a5oDECREASE
!
::.:·,:::
!
o>
-o.so·t.100
-
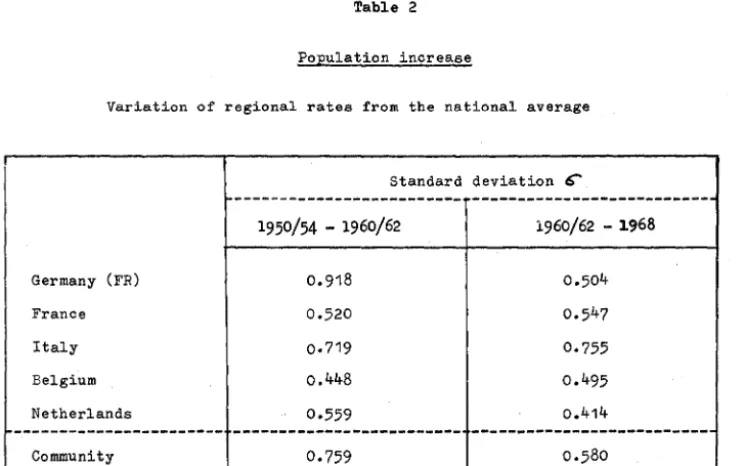
13-Table 2
Population increase
Variation of regional rates from the national average
Standard deviation 6"
---
---1950/54 - 1960/62 1960/62 - 1968
Germany (FR) 0.918 0.504
France 0.520 0.547
Italy o.719 0.755
Belgium 0.448 0.495
Netherlands 0.559 0,414
--- ---
---Community 0.759 0.580
In the first period, the marked variations from the national average registered
in the ~daral. Republic of Germany were doubtless due to the expellees and
refugees. This was also the case in Italy where such political factors
did not obtain.
In the second period the range of variations narrowed appreciably inthe Federal Republic of Germany but widened still further in Italy, indicating that the regional
demographic structures in Italy are still subject to radical change,
In the Community as a whole, the range of regional population growth
rates narrowed between the two periods.
2, Changes in regional shares between 1950 and 1968
Above- or below-average population increases are reflected in the changes
in the regional percentage shares of national (community) totals. The annexed
!ables D II 1·5 show the changes in the percentage share of each basic region
[image:17.475.34.407.63.296.2](a) At the level of the basic regions
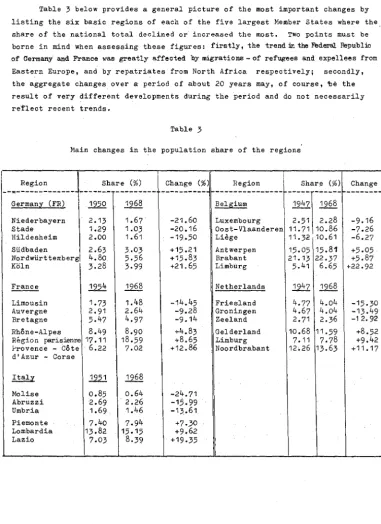
Table 3 below provides a general picture of the most important changes by listing the six basic regions of each of the five largest Member States where the. share of the national total declined or increased the most. Two points must be borne in mind when assessing these figures: firstly, the trend :in the Federal Republic of Germany and France "'as greatly affected by migrations -of refugees and expellees from Eastern Europe, and by repatriates from North Africa respectively; secondly, the aggregate changes over a period of about 20 years may, of course, 1:Je the result of very different developments during the period and do not necessarily retlect recent trends.
Table 3
Main changes in the population share of the regions
Region Share (%)
Germany (FR) 1950 1968
Niederbayern Stade Hildesheim Siidbaden Nordwiirt tembergl Koln Limousin Auvergne Bretagne Rhone-Alpes Region parisienne 1-'rovence - Cote d'Azur- Corse Molise Abruzzi Umbria Piemonte Lombardia Lazio 2.13 1.29 2.00 2.63 4.80 3.28 1954 1.73 2.91 5.47 8.49 17.11 6.22
122.:!.
0.85 2.69 1.69 7.40 13.82 7.03 1.67 1.03 1. 61 3.03 5.56 3.99 1968 1.48 2.64 4.97 8.90 18.59 7.02 1968 0.64 2.26 1.46 7.94 15.15 8.39Change (%)
-21.60 -20.16 -19.50 +15.21 +15.83 +21. 65 -14.45 -9.28 -9.14 +4.83 +8.65 +12.86 -24.71 -15.99 -13 .• 61 +7.30 +9.62 +19.35
Region ~ Share (%)
~:~:~:=---~
-~;:;~-~;~;-Luxembourg 2.51 2.28
Oost-Vlaanderen 11.71 10.86
Liege 11.32110,61
Antwerpen 15.05 15,81
Brabant 21.13 22.37
Limburg 5.41 6.65
Netherlands Friesland Groningen Zeeland Gelderland Limburg Noordbrabant
4.77
4.67 2.71 10.68 7.11 12.26 4.o4 4.o4 2.36 11.59 7.78 13.63Change (%)
[image:18.472.57.439.83.608.2]6
-
15-The last comment is particularly applicable to the evolution of the main
geographical areas, as defined elsewhere.1 The annexed TableD III shows that,
in the period 1950-68 as a whole, five main areas increased considerably their
share of the respective national totals:
in Germany (FR) the West
in France the Paris region
in Italy the North-East
in Belgium the North
in the Netherlands the South
The same tables show that this trend has not altogether ceased in these main areas; especially in the Federal Republic of Germany and, to a lesser extent, in France.
Table 4 below provides a general picture of the situation at Community
level by giving the changes in the percentages of the total Community population living in the main geographical areas over the three years of reference (1950, 1960 and 1969).
Regardless of the changes within the above period, it can be seen that the
most marked percentage increases were in the South of the Federal Republic of
Germany, the Paris region, and the North-West of Italy.
The most appreciable percentage decreases occurred in the North of the
Federal Republic of Germany, Berlin (West), the West of France, the North-East of Italy and, above all, in. the South of Italy.
POPULATION OF THE MAIN GEOGRAPHICAL AREAS
Table 4
Absolute figures as a
%
of EEC total1950 I 1960
1969 1950 1960 1969
f
GERMANY (FR)
I
North 11 409
I
11 447 12 230 7.2 6.6 6.5West 13 075 15 799 17 130 8.3 9.1 9.1
Centre 8 211 9 230 10 221 5.2 5.3 5.4
South 15 486 17 112 19 479 9.8 9.9 10.3
Berlin (West) 2 155 2 197 2 134 1 .4 1.3 1. 1
FRANCE
Paris region 7 009 8 297 9 518 4.4 4.7 5.0
West 16 595 17 222 18 391 10.5 9.9 9.7
East 18 406 20 385 22 617 11.7 11.8 12.0
ITALY
North-West 11 373 13 156 14 694 7.2 7.6 7.8
North-East 8 981 9 504 9 991 5.7 5.5 5.3
Centre 8 573 9 388 10 238 5.4 5.4 5.4
South 17 511 18 575 19 381 11 .1 10,7 10.2
BELGIUM
North 4 361 4 689 4 932 2.8 2.7 2.6
South 2 969 3 065 3 184 1.9 1. 8 1.7
Brussels region 1 323 1 425 1 545 0.8 o.8 o.8
NETHERLANDS
North 1 215 1 272 1 406 0.8 0.7 0.7
East 1 783 2 071 2 427 1 .1 1.2 1.3
West 4 884 5 486 6 214 3.1 3.2 3.3
South 2 284 2 691 3 093 1.4 1 .6 1 .6
LUXEMBOURG 291 315 339 0.2 0.2 0.2
-
17-(c) !h! !orth~e!t_~d_the_P!r!Phe!a!·!eji~n! ~f_t~e_c~~~i~y
Going beyond the national level, it is interesting to note whether there has been
any change in the proportion of the total Community population living in the
North-West of the Community (one of the main geographical areas defined in item B I 2 below).
The changes in this proportion are given below.
1954 1960
1969
1954 1960
1969
Main area in the l'rorth-West of the Community
Population
(•ooo
000)First definition
---31.9
34.6
37.5
Second definition
---47.5 51.1
58.1
Share (%)
29.2"/o
29.5%
30.1%These figures ehow that the North-West of the Community, in the narrower sense of the term, was unable to increase further its relative geographical importance.
This is not surprising, if we remember that the most important region in this area is
the West of.the Federal Republic of Germany (Rheinland- Pfalz and Nordrhein-Wee~~),
whose relative decline since 1960 has just been mentioned.
The picture changes if we look at the North-West of the Community, in the wider
sense of the term. The marked increase in the percentage share of this area between the three dates of reference, shows that the most dynamic regions, as far as
The pe~iphe~al areas of the Community form another group of regions and play an important role in regional policy. The following regional delimitation -by no
means the only possible onJ- shows the peripheral areas to be: Basse-Normandie1
B~etagne1 Pays de la Loire, Poitou-Charentes, Aquitaine, Midi-Pyrenees, Languedoc, Corse, Abruzzi, Molise, Puglia, Basilioata, Calabria, Sicilia, Sardegna,
Schleswig-Holstein, Liineburg1 Braun'l!chweig1 Hildesheim1 Kassel, Unterf~anken, Oberfranken,
Oberpfalz and Niederbayern. The percentage of the total Community population living in this a~ea has changed as follows:
1954 1960
1969
Periphe~l areas of the Community
Population
(•ooo
000) population (%) Share of22.7% 21.7% 21.1%
These changes are admittedly not considerable, but they ought to indicate the
virtual absence of any direct link between the ~espeotive trends in tbe two main
geographical areas unde~ consideration,at least not if the first definition of the
North-West of the Community is used.
It should also be ~emembered that these areas are not homogeneous, and that their
constituent regions a~e often subject to fairly different internal movements.
While they do not provide a complete picture, these results are, none the less, an i~dication that, as far as population is concerned, oversimplifications as regards
any comparison between the central and periphe~al a~eas of the Community are not
justified.
1 It should here be remembered, in particular, that in F=ce it is not so much the
-
19-Fairly clear-cut trends come to light if we consider changes in the proportions
of the total Community population living in the three socio-economic categories of
regions mentioned in the Memorandum on regional policy.1
Table 5
.!.2!!:!
Population ( 9000 000) Share C%)~g::i~!. t"!:r!!:l_ !e~£11!
1955 45.0 27.1
1960 45.5 26.3
1969 47.8 25.3
~e~i:i~W:s!r~a!.i!e~ !e~~n!
1955 51.1 30.B
1960 53.1 30.7
1969 59.0 31.3
!~u!t!i!!:l~z!d_ ~e~~n!
1955 69.9 42.1
1960 74.6 43.0
1969 61,9 43·4
It can be seen from Table 5 that between 1955 and 1969 there was a marked decrease in the percentage of the total Community populatiort living in agricultural regions and
an increase in the percentage of the same population living in the industrialized regions.
1
[image:23.478.47.447.43.472.2]II. The factors determining population size
1. Natural movements (birth and death rates)
Among the factors determining population size, mention should be made, first of all, of the natural movement of the population, i.e. the difference between birth and death rates.1
(a) ~i!!_P!!:_r~t~e!!. ~e!_w!e~ ::e~!1.n!!.
!::ll!!
~OJEl!r~e!!.As shown by the annexed Tables D II 1-5, there were fairly marked differences in birth rates between Community regions in the period 1960-67. The highest annual.birth rate, 2.46 births per 100 inhabitants,
was recorded in Campania (Italy); all the other regions in the South of Italy had a birth rate well above
2%
too.Conversely, a particularly low birth rate - less than 1.5% - was recorded in Hamburg and Berlin (West),2 in the Belgian provinces of Liege
and Brabant, in Limousin and Languedoc in France, and in seven regions of Northern and Central Italy.
It should also be pointed out that a high death rate is often
accompanied by a low birth rate, both being largely attributable to the same factor - an unfavourable age pyramid.
As a result of this negative correlation between births and deaths,
rates of natural increase are much more marked than birth rates considered in isolation.
1 All birth rates, death rates and natural and overall rates of population increase are expressed as percentages, to facilitate comparisons between them.
-
21-In the period under review, the following extreme rates were attained at national level:
Netherlands Luxembourg
Difference
Birth rate Death rate
0.79 1.20
Natural increase
1.24
0.37
0.87
Differences between regions were still more marked. If we exclude Berlin (West) - its figures being given for information's sake -we have the following picture:
Birth rate Death rate Natural increase
Noordbrabant 2.29 0.66 1.63
Limousin 1.30 1.38 -0.08
Difference 0.99 -0.72 1.71
Berlin (West) 1.14 1.74 -0.60
The above-mentioned differences lead one to ask whether there are any
correlations between regional rates of natural increase and regional social stl'llctures.
Two correlations found in certain Member States are worth mentioning
in this connection.
The first point, mentioned in the "Raumordnungsberioht 1968" of the Government of the Federal Republic of Germany, is that in the Federal Republic of
Gel'!Dal1y birth rates above the national average are confined mainly to the
If we take the relative size of the agricultural labour force as the
criterion for determining rural regions, the above statement also seems to be true for most regions of Southern Italy; but not for the other Member
States - in particular France where the steady outflow of young people from the traditionally agricultural regions, such as Limousin may conceivably
have already led to an excessive "deterioration" in the age pyramid. This aspect, however, should be studied in more detail.
The second point concerns the correlation between birth rates and the size of communes. Certain statistics, especially of Dutch and Belgian
origin, indicate clearly that the larger the commune the smaller the birth
rate (S$e graph below).
If these two correlations turned out to be generally valid, they would have substantial implications for the population growth of a country,
since the national capacity for demographic reproduction might be reduced by the gradual conversion of traditionally agricultural regions - which
l 2
3 4 5 6
-
23-BIRTH RATES AND THE SIZE OF COI-IMUNES
Birth rate o/oo
26"P---r---.
24r----r---r----r~~
~.r,~r-~~==~~~~~1'
2 5 10 20 50
IV
100
290
500 1000Average number of inhabitants
(-Jooo)
Categories of communes
Netherlands
( 5 000 inhabitants
5
000 -<
20 00020 000 -
<
50 000 50 000 -<
100 000>
100 000Amsterdam - Rotterdam - Den Haag
I
II III IV
Belgium
<
5 000 inhabitants5 000 -
<
25 000>
25 0002. Migrations
Apart f'rom natural increase, regional population trends are determined
by
migrator,y movements.Unfortunately, the statistics available for each countr,y on migrator,y
movements are extremely difficult to compare owing to the different ways in which the relevant data are recorded and set out. Furthermore, data in one and
the same countr,y are not always consistent and depending on the statistics chosen are sometimes even contradictory. The following findings should therefore be interpreted with caution.
Bearing this in mind, certain particularly important aspects and data which
seem to merit special attention are considered below: namely, the size of migrations at th,e level of the basic regions, the main geographical areas and
the Member States; changes in the directions of migrator,y flows within countries, and, finally the total mobility of the population {coefficient of mobility).
For the period 1960-67, the annexed Tables D IV 1-5 give the net inter-regional and international migration figures for each basic region,
expressed as a percentage of their average annual population.
The following ·table lists the regions particularly affected by migration, namely those with an average annual net immigration or
-
25-Table 6
Average annual net regional immigration and emigration as a percentage of the population (1960-67)
Regions of i~igration (+1%) Regions of emigration (-0.7%)
Provence - Cote d'Azur Corse
Oberbayern
Koln
Darmstadt
Languedoc
Piemonte
Lazio
+2.3
+1.6
+1.4
+1.4
+1.3
+1.3
+1.0
Basilicata -1.6
Molise -1.5
Calabria -1.4
Sardegna -1.0
Abru.zzi -1.0
Umbria -1.0
Puglia -().9
Sicilia
-().8
Marche -0.7
It can be seen from the above that the basic regions with the largest net emigrations were concentrated in Italy, while those with the highest net immigration rates were found in several countries.
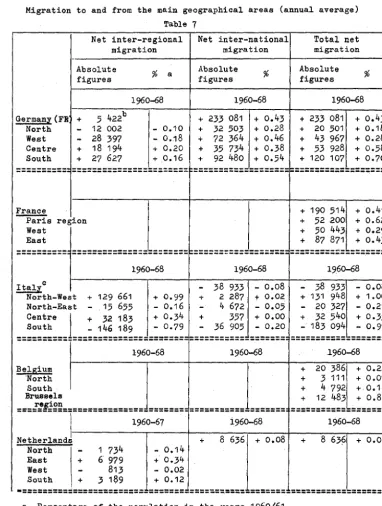
To obtain a more extensive picture, the net migration rates of the
main geographical areas were determined for the period 1960-68. Table 7 confirms the leading role played by Southern Italy as a region of emigration.
This was, in fact, the only main area of the Community to have a substantial net outflow during the period under review.
Migration to and from the main geographical areas (annual average)
Table
1
Net inter-regional Net inter-national
migration migration
Total net migration ---+---+---~
Absolute figures
Germany (FR + 5 422b
%
a1960-68
North - 12 002 - 0.10
West - 28 397 - 0 •. 18
Centre + 18 194 + 0.20
South + 27 627 + 0.16
==================================
Absolute
figures
%
1960-68
+ 233 081
+ 32 503
+ 72 364
+ 35 734
+ 92 480
+ 0.43 + 0.28 + 0.46 + 0.38 + 0.54
---Absolute
figures
%
1960-68
+ 233 081 + 20 501
+ 43 967
+ 53 928
+ 120 107
+ 0.43
+ 0.18 + 0.28 + 0.58 + 0.70
---
---
---+ 190 514 + 0.41
+ 52 200 + 0.62
+ 50 443 + 0.29
+ 87 871 + 0.43
==============================-========
1960-68 1960-68 1960-68
Italy0 - 38 933 - o.o8 - 38 933 - o.o8
North-West + 129 661 + 0.99 + 2 287 + 0.02 + 131 948 + 1.00
North-East - 15 655 - 0.16 - 4 672 - 0.05 - 20 327 - 0.21
==~~:!::==1===~=~~;=~!!====:=~:~~=~=:==~~=~~~-=:=~:!~::::::~!=~~~-===~:~!:
1960-68 1960-68 .1960-68
a Percentage of the population in the years 1960/61
b Net German inter-regional migration is not zero, since it was impossible to determine the figures for Berlin-West for the whole of the period under review.
0.08
c In the case of Italy, the figures for inter-regional and international
~igration are based on information supplied by Residents' Registration
[image:30.475.50.432.58.564.2]-
27-Table 8
Net migration from Southern Italy ('OOO)
- based on information supplied by Resident~ Registration Offices
Period
1881-01
1901-11
1911-.21
1921- :;6
1936-51
1951 61
1961- 69
Sources:
1881-.51:
1951- 69:
Total Annual average
-
930
- 46·5
-
859
- 85·9
-
920
- 92.0
-
796
- 53.1
-
934
- 62.3
-1 879
-187.9
-1 325
-165.6
"Un secolo di statistische italiane" Comitate dei Ministri per il Mezzogiorno "Studi monografici sul mezzogiorno"
(c) At the level of the Member States
The (very inconsistent) statistics for international migrations show that none of the flows between Community countries are of any
real importance, except those from Italy.
It should be remembered, however, that in the past the total migratory flows of Member States have not been dominated by inter-Community flows.
For instance, the majority of Italian emigrants
(60.8%
between1960
and1968)
still go to non-member countries, i.e. coun~riesoutside Europe. Similarly, most migrants to the other Member States
come from outside the Community (see annexed Tables D V -VIII).
~brings out the small size of inter-Community migration in comparison
{d) The direction of migratory flows
The data available here reveal some changes in the direction of
migratory flows inside the Member States over the two periods under review.
In Germany, for instance, the marked migratory flow to the West
during the fifties has been replaced sinoe 1960 by a flow to the South.
In France, there has been a reversal of the migratory flows registered in the Champagne, Picardy, Limousin and Auvergne regions, where the net exodus of 1954-62 became a net influx in 1962-68. The opposite is true of the Lorraine region. In the 1962-68 period the traditional net immigration into the Paris. region dwindled appreciably while that into the Mediterranean region increased still further.
In the Netherlands, the Western region which had for a long time
attr~cted migratory movements has since the beginning of the sixties lost
more than it has gained from migration whereas the South and the East have become regions with net immigration.
In Belgium, the historic direction of migratory flow from the North to the South has been reversed, the North becoming the sole region
with net immigration.
In Italy the volume of migrations from the South to the Centre and
North has varied; expected to change.
the direction of migrations, however, is not
-H-Given the importance of these flows for regional and other
policies - employment, housing, etc. - the harmonization of migration statistics and the compilation of such matrices on the basis of the regional units adopted seem to merit special attention in future
statistical programmes.1
(e) The coefficient of mobility
The regional migrations considered above are only part of total
migrations within a country, which comprise all changes of domicile
between two communes and so, when correlated with the total population, provide an indicator of population mobility (coefficient of mobility).
Two questions arise in this connection:
(i) Does mobility differ appreciably between the Member States of the Community?
(ii) What is the trend in population mobility?
It is impossible to answer the first question, owing to the
heterogeneity of available data. With reg.ard to the second question,
however, the series of mobility coefficients set out in the annexed
Table D IX allow the following conclusions to be made: mobility has
declined slightly in Germany and Belgium and remained virtually unchanged in the Netherlands; variations are slightly more substantial in Italy
but no clear-cut trend emerges.
From these data it can be concluded that, for the Community as a
whole, the mobility of the population did not change substantially during the period under review.
[image:33.471.47.412.53.437.2](f) Commuting
In the broad sense, migration also includes commuting, be it daily,
weekly or monthly. Commuting can be an important feature of regional
structures; and will, of necessity, expand as geographical interdependence
increases. Commuting within the Community is not analysed in this
-
31-The problems of geographical distribution and, in particular, of population concentration are complex, especially in view of the various regional levels at which they can arise and the various criteria which must be used when assessing
them. The limited compass of this analysis rules out a study of more than a
few aspects of this matter.
The first chapter begins with the population density figures for the basic
regions in 1960-62. Classification of these regions into categories provides a
preliminary picture of population concentration in the ~~mber States and a baais
for comparing them. Some major features of regional population densities in the
Community will come to light by reference to the map below. Finally, the
plotting of Lorenz curves and calculation of an index of concentration at three different dates will reveal the changes which have occurred in the distribution of population at Community level.
A second chapter studies the ratio between population density and growth, so as to provide a dynamic picture of the process of population concentration
in the Community.
When assessing the following findings, it should be borne in mind that they refer to a clearly determined regional framework which only provides a relative
view of the phenomenon. The choice of smaller regional units, for instance
Kreise, D~partements, etc., would certainly provide more detailed pictures and
sometimes reveal
a
fair number of subtle distinctions. Finally, it is commonknowledge that· the most acute problems of population density occur today at the level of the communes, and more particularly in the relationship between urban
and rural areas. More detailed studies should make it possible to define these
I, Regional population densities
1, Statical analysis
The regional density statistics provide a preliminary indication of
population distribution inside the Community. Those for the years 1960-62
are given in the annexed tables.
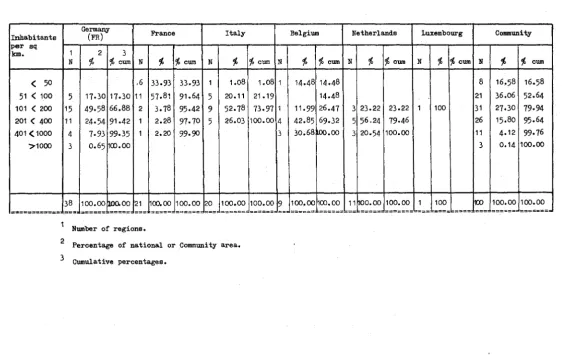
Table 9 below divides the regions into six classes of density and gives the percentages of national area which they cover.
In particular, the table reveals the great differences that exist between
the Member States as regards the importance of thinly populated regions.
The regions of the first two classes - less than 50 and less than 100
inhabitants per sq. km - cover 34 and 9~fo respectively of France but a far
smaller proportion of all other Member States, Indeed, the Valle d'Aosta in
Italy and the province of Luxembourg in Belgium are the only other regions to
fall in the first class. And none of the regions in the first two classes of
density are Dutch,
The following graph shows the distribution of regions between the six
classes, and the respective national average densities.
2, Geographical analysis
The geographical distribution of the population in the Community is
shown on the map below which was compiled from the aforementioned data. 1
1The graph in the bottom left-hand corner of the map shows the distribution of the 100 regions by class of density and reveals, once again, the
Inhabitants per sq
km.
<
50 51<
100 101<
200 201<
400 401<
1000 >1000============
Table
9
Basic regions b,y classes of density, in 1960-62
Germany
(FR) France Italy Belgium Netherlands Luxembourg Community
1 2 3
N % %cum N
f.
%cum Nf.
'f.cum Nf.
%cum Nf.
%cum Nf. f.
cum Nf.
f.
cum.6 33.93 33.93 1 1.08 1.08 1 14.48 14.48 8 16.58 16.58
5 17.30 17.30 11 57.81 91.64 5 20.11 21.19 14.48 21 36.06 52.64
15 49·58 66.88 2 3.78 95.42 9 52.78 73.97 1 11.99 26.47 3 23.22 23.22 1 100 31 27.30
19·94
11 24·54 91.42 1 2.28
91·10
5 26.03 100.00 4 42.85 69.32 5 56.2419·46
26 15.80 95·644
1·93
99.35 1 2.20 99·90 3 30.68'-'>o.oo
3 20.54 100.00 11 4.1299·16
3 0.65 1CO.OO 3 0.14 100.00
38 100.00
!Joooo
21 00.00 100.0012o
100.00 100.00 9 100.00 100.00 11 00.00 100.00 1 1001m
100.00 100.00===
======-=====· === =====-=~========-======-======-==
============-==
=====-=======-===-===~ be===-===-======-~=======Number of regions.
2 Percentage of national or Community area.
3 Cumulative percentages.
[image:37.697.76.639.66.424.2]CLASSIFICATION OF BASIC REGIONS BY DENSITY
-
35-The map reveals two outstanding features of population distribution:
(i) A strip of very sparsely populated regions, of varying width, stretching
from Belgian Luxembourg in the North-East to the Midi - Pyrenees region in the South-West;
(ii) An extremely substantial concentration in the "Nord" region of France, the West and Central parts of Belgium (the two Flanders, Hainaut, Brabant and Antwerp), the Vlest and South of the Netherlands excluding Zeeland, the West German "Land" of Nordrhein-Westfalen excluding the Regierungsbezirk
Detmold and, finally, the Regierungsbezirk Wiesbaden. All these regions
are adjacent and have a density of at least 300 inhabitants per sq. km.
In 1960-62 this area had an average density of 492 inhabitants per sq. km, making a total of 33 million inhabitants or 20% of the entire population
of the Community in
6.5%
of its area.With the addition of neighbouring regions with a density of more than 200 inhabitants per sq. km, this area takes in four additional Benelux
provinces and also extends somewhat to the North-East (to include the
Regierungsbezirke Detmold, Hannover and Braunschweig), and to the South-East
(to include the Regierungsbezirke Darmstadt, Rheinhessen, Pfalz, Saarland,
Nord-Wiirttemberg and Nord-Baden). This larger area has 50.7 million
inhabitants. Geometrically, it lies within a circle with a radius of
300 km, centred close to Cologne, which also covers some neighbouring
regions-including the important regions of Alsace and Lorraine - and lies adjacent to another area of very high concentration, the Paris region, which has a density of 705 inhabitants per sq. km and a population of 8.5 million but is surrounded by low-density regions (generally less than 100 inhabitants per
3. Lorenz curves
Lorenz curves are particularly suitable for illustrating population
distribution in a specific area.
For the purpose of this analysis, it was decided to plot these curves in order to provide a synoptic picture of the trend of population concentration within the Community.
The annexed Tables D XIV 1-3 give the data that were necessary for plotting
Lorenz curves for the years 1950, 1960 and 1968.
A perfectly even distribution is represented by the diagonal, so that the fairly sharp bend of the 1950 ·distribution curve (1) shows that there is a fairly high degree of concentration in the Community.
In fact, 78% of the population were concentrated in half the total area
whilst the other half accounted for only 2~fo.
The 1960 curve (curve 2) is slightly more convex than that for 1950, showing that concentration had increased in the intervening decade.
A closer examination of certain,sections of the curve shows that marked deconcentration had occurred in 45% of the total area covered by the regions
with the lowest density. This, however, was more than offset by the trend in
the other 55%.
The third curve, for 1968, shows that a trend towards deconcentration had reoccurred in the second period of reference•
100"/o Population
-
37-CHANGES IN THE GEOGRAPHICAL DISTRIBUTION OF POPULATION
IN THE CO~lMUNITY
751~---~---~---~~----~---4L-~
- 1 9 5 0
- - - · 1960 ... 1968
25
5075
100"/,In quantitative terms, this trend can be expressed by the index of concentration,
I
2
where i stands for the various classes of density, ai the percentages of the
population in each class, bi the corresponding percentages of area covered.
The smaller the index, the more even the distribution of population; in
the extreme case of a zero index, the curve would correspond to the diagonal.
At the pther end of the scale, an index approaching the limit value of 50 indicates a very heavy concentration, with nearly all the population being found in a minimum area.
The index for the three years of reference is
1950:
1960:
1968: I
I
I
30.10
31.40
30.60
These figures go a l?ng way to substantiating the conclusions reached
above. They show that the 1950-60 period of concentration was partially
THE BASE REGIONS. CLASSIFIED BY POPULATION DENSITY
I 11 112 F 4 114 D 7 115 D 8 118 N 1 118 N I 204
L 122 I 6 209 015 128 N4 211 016 111 0] 221 liB 116 025 228 FIS 56 020 117 N 5 228 Fl6 56 029 119 112 210 F20 57 I 9 119 8 7 216
! F9 57 N 2 W 018 246
:; I 5 58 010 142 016 248
0
j ~ 120 59 117 65 021 141 ITO 141 86 256 09 274 ¢::,
~
i
FlO 69 0]] "5 026 287•
j F21 75 D I 148 F6 296..
FJ 76 I 7 151 014 102~ .!; FIT 77 I I 154 NIO 101 /14 81 021 159 DIS 110 8 4 427 06 86 FB 159 I 4 111 017 469 I 2 ]I OS 87 N9 151 81 ]19 81 505 FIJ 4] Fl2 88 028 161 I 1 120 N 6 511 F/7 45 011 89 I 8 166 027111 011 514 Fl4 45 012 92 0]0 169 024 ]]5 8 2 596 F2 47 Fl9 92 116 T77 8 5 147 F I 705 F5 48 F7 91 014 180 115 150 N7 765 Fl4 49 022 94 04 181 019 158 N8 945
88 49 Ill 94 /19 184 Nil 196 012 979
COMMUNITY BASE REGIONS: POPULATION DENSITY
A
-
....'
\d
_.,.
<)
~
0111749
02 2452
\
....~
_
0184585
LEGEND
Slate front1ers
Regional boundaues
Boundar 1es of base
admm1strat1on umts
INHABITANTS PER SQ. KM.
I
I
-(50
50 -100
101- 200
201- ,00
401-1000
- )1000
Census figures 1960-1962
II. The_relationship between population density and population growth
The relationship between population density and population growth enables us to study the dynamic developments in concentration.
Concentration is increasing if the correlation betweeen these two variables is positive (in which case the greater the density, the higher the rate of increase) and decreasing if it is negative.
Between 1960 and 1968,there was no significant correlation between the two variables at the level of the basic and larger regions.
But if we list all the regions of each country in increasing order of density, and then divide them into thirds, their respective rates of increase reveal the following trends:
Table 9
Average density Average rate of increase Basic regions
in 1960-62 Period I Period II
1. Germany (FR)
1st third 226 0.08 1,11
3rd third 355 1.62 0.84
2. France
1st third 48 0.46 0.87
3rd third 168 1.26 1.16
3· Italy
1st third 71 0,18 0.28
3rd third 242 0.84 1.20
4. Belgium
1st third 110 0.86 1.14
3rd third 513 0.65 0.86
5· Netherlands
1st third 165 1.06 1.22
-40-In the Federal Republic of Germany and the Netherlands, not only did the respective rates of increase of the three categories come appreciably closer
together, but that of the regions with the lowest density even rose to above
that of the most heavily populated regions. Between the two periods in question,
and within the framework of the regional units adopted, the population
accordingly became more evenly spread in these two co~tries.
On the other hand if we compare the Italian figures for the two periods we find that the rate of increase showed a proportionally greater acceleration
in the least densely populated regions but rose enough in absolute terms in the densely populated regions to widen the gap between ·the two categories of regions and thus to speed up the trend towards greater concentration.
In France, the population of the high-density regions increased more
slowly in thB second period than irt the first, whilst that of the low-density
regions increased more rapidly. The first category, however, still had a
higher rate of increase, so that the process of concentration continued though
at a markedly slower pace.
As the problems of over-concentration attributable to population increase arise, above all, in the high-density regions, it seems worth giving closer
consideration to whether the population of _the latter has increased more than the national average and if so by how much.
The situation during the period 1960-68 was as follows:
(a) In the Federal Republic of Germany and the Netherlands, the national rate of
population increase was slightly above that cf the hig)l-density basic
regions - the City Lander and the Regierungsbezirk DUsseldorf,
Noord-Holland and Zuid-Noord-Holland). The same applies to the areas of maximum
densit~ in these two countries (Nordrhein-Weatfalen and the West o! the
main areas account for a very substantial proportion of the total national
population (more than a quarter in the Federal Republic of Germany and more that 45% in the Netherlands), it follows that the geographical
concentration has declined somewhat.
(b) In three countries, however - France, Italy and Belgium - the basic regions
or main geographical areas of relatively high density increased their
population faster than the national rate during the period under consideration. They are the Paris region, Lazio, Lombardia and Campania and the provinces of
Antwerp and Brabant. Since these regions account for a relatively large
proportion of the total national population - 18% in France, more than 3~fo
in Italy and Belgium - the population concentration within these countries
has increased to some e.xtent.
In this connection, it should be mentioned that the process of
concentration seems to have lost momentum in the 1962~68 period in France,
at least, since the Paris region's growth rate is no longer so markedly
-
42-I. Indicators of population movement
1. Cumulation and counteraction of natural movements and migrations
By combining the indicators studied separately in the previous chapters, we can classify regions from several angles,
One relationship can be established between the two variables - natural
increase and migratory movements which can operate in the same or opposite directions, that is to say reinforce or counteract each other,
During the period under consideration (1960-68), migration and natural movements worked in the same direction in the Regierungsbezirke Darmstadt, Oberbayern and Lazio, where the sharp population increase was attributable to
both very heavy immigration and a birth rate above the national average,
Conversely, significant emigration coincided with a low birth rate in
certain other regions, namely: Hamburg, Hildesheim, Braunschweig, Oberfranken and
Berlin (West) in the Federal Republic of Germany; Limousin and Poitou-Charentes in
France; Friuli-Venezia-Giulia, Marche, Umbria, Abruzzi and Molise in Italy; the provinces of Hainaut and Luxembourg in Belgium.
The first type of coun.teraction occurs in regions where a heavy natural
increase coincides with substantial emigration. This is notably the case in
Solthern Italy. Despite a heavy natural increase, in the period under review
the total rate of population increase:
(i)Hardly exceeded the national average in Campania and Puglia;
(ii) Remained markedly below the national average in Calabria, Sicilia and
Sardegna;
The main type of counteraction occurs, though to a lesser extent, in the Regierungsbezirke OsnabrUck, Aurich, Oldenberg, MUnster, Trier,
Niederbayern, Oberpfalz and Nit tel franken in the Federal Republic of Germany, and
in the North and Lorraine programme regions in France.
In other regions, by way of contrast, counteraction operates the other
way: immigration is responsible for the substantial growth of the total
population of certain regions with a small or average natural increase. This
is the situation in the Regierungsbezirk Wiesbaden, the four programme regions
of Aquitaine, Midi-Pyrenees, Languedoc and Provence- C8te d'Azur- Corse,1
certain regions in the North-West of Italy (~iemonte, Liguria and Valle d'Aosta)
and Brabant in Belgium.
1Migration to Provence - Cote d'Azur - Corse is so substantial that the annual
-
44-2. The most marked rates of change
The above-mentioned cumulative effects account for the particularly sharp
changes in the total population of certain regions.
The regions with the most marked rates of change can be grouped under two
headings:
(i) Firstly regions with a negative rate, and more especially those listed under (b) and (c) below whose population declined in the second period
only or in both periods.
(a) Regions whose population declined in the first period:
Germany: (FR)
France:
Italy:
(b) Regions
Ge{~jny:
Italy:
(c) Regions
GYfii."JY:
Italy:
Schleswig-Holstein, Hildesheim, Ltineberg, Stade, Aurich, Braunschweig, Oldenburg, Kassel and Berlin (West)
Limousin
Veneto, Friuli-Venezia-Giulia, Marche, Umbria, Abruzzi and Molise.
whose population declined in the second period:
Berlin (West)
Umbria, Molise, Basilicata.
whose population declined in both periods:
Berlin (West)
Umbria, liJolise.