oxide fuel cells (IT-SOFCs).
Thesis submitted in accordance with the requirements of the
University of Liverpool for the degree of Doctor in
Philosophy by:
Darren Wayne Hodgeman
April 2014
Supervised by
Professor M. J. Rosseinsky
2
The work presented in this thesis focuses on the synthesis of long axis A-site ordered perovskites, which have ordered oxygen vacancies. The materials discussed have also been assessed as potential cathodes for solid oxide fuel cells (SOFCs), targeting an intermediate temperature (IT) -SOFC operating range of 500 - 800 °C.
In chapter 3 of this thesis, a 16ap phase (ap = 1 perovskite unit, ABO3-δ),
Y2.24Ba2.28Ca3.48Fe7.44Cu0.56O21-δ, was first observed in a powder X-ray diffraction (PXRD)
pattern that resulted from the attempted Cu doping of a 10ap phase
(Y0.9Ba1.7Ca2.4Fe5-xCuxO13-δ). This phase was indexed as ap √2 × 16ap × ap √2 by selective
area electron diffraction (SAED). Mössbauer spectroscopy identified that Fe3+ existed in three different coordination environments and a Rietveld refinement was carried out using combined powder synchrotron (S) XRD and powder neutron diffraction (ND) data. High Angle Annular Scanning Transmission Electron Diffraction (HAADF-STEM) confirmed the A-site ordering from the refinement.
The 16ap phase exhibited good thermal stability, CO2 stability and chemical compatibility with state-of-the-art electrolytes (GDC, SDC and LSGM), as well as a close matching thermal expansion coefficient (TEC) with the same electrolytes. Although possessing low electronic conductivity, 3.5 S.cm-1 at 750 °C, a good area specific resistance (ASR) of 0.12 Ω.cm2 at 750 °C was achieved, within the IT-SOFC operating range.
In chapter 4, a 10ap phase, Y0.9Ca2.4Sr1.7Fe5O13-δ (YCSFO), was discussed. The space group Imma was identified from SXRD data, while the structure was closely related to brownmillerite. A Rietveld refinement carried out with the addition of SXRD data collected at the K absorption edge for Sr determined A-site ordering. The ASR of YCSFO was three times higher than that of the 16ap phase, highlighting the ordering of oxygen vacancies.
The final phases investigated in chapter 5 of this thesis belong to a family of Co doped 10ap
phases (Y0.9Ba1.7Ca2.4Fe5-xCoxO13-δ). A range of compositions were synthesised by varying the cation ratios, in order to obtain high Co content phase pure samples. The highest Co content was x = 1.85 for compositions Y1.24Ba1.85Ca1.91Fe3.15Co1.85O13-δ (annealed in O2) and Y1.6Ba1.8Ca1.6Fe3.15Co1.85O13-δ. AC impedance measurements carried out showed that
3
Firstly, I would like to thank my supervisor Prof Matt Rosseinsky, who provided me with the fantastic opportunity to undertake my PhD within his research group. Throughout my time within the group, he has provided much valuable input and support for my research projects, for which I am grateful. I would also particularly like to thank my second supervisor Dr John Claridge for his help throughout my PhD, particularly enabling me to make use of his encyclopaedic knowledge in seemingly all areas.
With working in such a large research group, I have worked with many people, so I would like to thank them all for their part, but I will particularly highlight those that I worked most closely with.
At the outset of my PhD, Dr Antoine Demont showed me the ropes in terms of synthesis, powder diffraction and solid state chemistry, whilst Dr Ruth Sayers helped me get to grips with electrochemical measurements. As I progressed and Antoine left the group, I was lucky enough to work with Dr Phil Chater, who really helped me improve my Rietveld refinement skills. Most recently Dr Alex Corkett has been on hand for refinement discussions, though I have also enjoyed conversations with Dr Mike Pitcher and Dr Christophe Didier in this area.
Contents
Abstract ... 2
Acknowledgements ... 3
1 Introduction ... 9
1.1 Energy concerns ... 9
1.2 Fuel cells ... 9
1.3 Solid Oxide Fuel Cells (SOFCs) ... 11
1.3.1 SOFC Overview ... 11
1.3.2 SOFC Cathode limitation ... 14
1.3.3 General SOFC component requirements ... 15
1.4 Mechanisms of conductivity in SOFC components ... 17
1.4.1 Electronic conductivity ... 17
1.4.2 Electronic conductivity in transition metal oxides ... 19
1.4.3 Ionic conductivity ... 21
1.5 Magnetic ordering ... 22
1.6 Structures of Particular Interest ... 23
1.6.1 Fluorite... 23
1.6.2 Perovskite ... 24
1.7 SOFC Materials ... 29
1.7.1 Electrolytes ... 29
1.7.2 Anodes ... 32
1.7.3 Cathodes ... 33
1.8 Aims of Thesis ... 39
2 Experimental Methods ... 40
2.1 Synthesis... 40
2.2 Powder Diffraction Techniques ... 42
5
2.2.3 X-ray Diffraction (XRD) ... 43
2.2.4 Neutron Diffraction (ND) ... 47
2.2.5 Electron Diffraction (ED) ... 49
2.2.6 Powder Diffraction ... 51
2.2.7 Rietveld Refinement ... 52
2.2.8 Laboratory X-ray Sources ... 56
2.2.9 Synchrotron Radiation ... 56
2.2.10 Neutron Sources ... 57
2.3 Electron Microscopy Techniques ... 58
2.3.1 General Electron Microscopy ... 58
2.3.3 Scanning Electron Microscope (SEM) ... 59
2.3.4 Transmission Electron Microscope (TEM) ... 60
2.3.5 Selective Area Electron Diffraction (SAED) ... 61
2.3.6 High Angle Annular Dark Field Scanning transmission Microscopy (HAADF-STEM) ... 62
2.3.7 Energy Dispersive X-Rays (EDX) ... 63
2.4 Thermogravimetric Analysis (TGA) ... 63
2.5 Mössbauer Spectroscopy ... 64
2.6 Iodometric Titrations ... 65
2.7 Cathode Stability and Chemical Compatibility Testing ... 67
2.7.1 Thermal Stability ... 67
2.7.2 CO2 Tolerance ... 67
2.7.3 Chemical Compatibility ... 68
2.8 Densification ... 68
2.9 Thermal Expansion Coefficient (TEC) Measurements ... 69
2.9.1 VT-SXRD ... 69
6
2.10 Electrochemical Characterisation ... 71
2.10.1 Four probe DC conductivity ... 71
2.10.2 AC Impedance Spectroscopy ... 73
2.11 Extended Module Materials Assembly (EMMA) ... 79
2.11.1 General method ... 79
2.11.1 Searching a phase diagram ... 80
3 Synthesis and Characterisation of the 16aP, Y2.24Ba2.28Ca3.48Fe7.44Cu0.56O21 ... 81
3.1 Introduction ... 81
3.2 Experimental ... 83
3.2.1 Discovery of the new phase ... 83
3.2.2 Reactivity with crucibles ... 85
3.2.3 Isolation using the phase diagram approach ... 87
3.2.4 Obtaining a Phase Pure Sample ... 90
3.2.4 Other A-site ordered synthesis attempts ... 92
3.2 Crystal Structure Characterisation ... 93
3.2.1 Obtaining a Starting Model ... 93
3.2.2 Crystal Structure Refinement ... 95
3.2.3 Cu Free 16ap ... 101
3.3 Physical Properties ... 101
3.3.1 Stability and Compatibility ... 102
3.3.2 Electrochemical behaviour ... 107
3.3.3 Post Impedance analysis ... 111
3.4 Discussion ... 113
3.5 Conclusion ... 117
4 Synthesis and Characterisation of Y0.9Ca2.4Sr1.7Fe5O13±δ, YCSFO ... 118
4.1 Introduction ... 118
7
4.2.1 Discovery ... 118
4.2.2 Isolation using the phase diagram approach ... 120
4.3 Crystal Structure Characterisation ... 122
4.3.1 Testing models ... 122
4.3.2 Magnetic model ... 126
4.3.3 Combined refinement ... 127
4.3.4 Combined refinement including anomalous data set ... 133
4.4 Physical Properties ... 141
4.4.1 Stability and Compatibility ... 141
4.4.2 Electrochemical behaviour ... 146
4.5 Discussion ... 150
4.6 Conclusion ... 154
5 Doping studies of the 10ap, Y0.9Ba1.7Ca2.4Fe5O13-δ ... 155
5.1 Introduction ... 155
5.2 Co doping Y0.9Ba1.7Ca2.4Fe5-xCoxO13-δ ... 156
5.2.1 Synthesis ... 156
5.2.2 Highest Co content synthesis ... 157
5.2.3 O2 annealing of high Co content 10ap ... 159
5.2.4 Variation in Y to Ca/Ba ratio, forming a solid solution for Fe3.15Co1.85 ... 160
5.3 Crystal Structure Characterisation ... 164
5.3.1 Modelling magnetic structures ... 165
5.3.2 Combined refinements using SXRD and ND data ... 165
5.3.3 x = 0.5 Rietveld refinement ... 166
5.3.4 x = 1 Rietveld refinement ... 170
5.3.5 x = 1.85(I) Rietveld refinement ... 173
5.3.6 x = 1.85(II) Rietveld refinement ... 176
8
5.4 Physical Properties ... 184
5.4.1 Thermal stability and chemical compatibility ... 184
5.4.2 Electrochemical performance ... 187
5.5 Other Dopants ... 190
5.5.1 Dopants explored ... 190
5.5.2 Property characterisation ... 193
5.6 Discussion ... 194
5.7 Conclusion ... 197
1 Introduction
1.1 Energy concerns
A constant source and supply of energy is highly important, without which today's society would likely crumble without access for long periods of time. Access to a supply of electrical energy is particularly relied upon as it is used in all aspects of life, from powering hospital equipment to powering computers and light bulbs. Industrial economies are particularly reliant, as they contain 25 % of the world's population, which consumes 75 % of the world's energy supply. 1, 2
Traditional power generation is based upon non-renewable fossil fuels such as coal, oil and natural gas. Although fossil fuel supplies are finite, they are still currently plentiful, nevertheless, in the long term it is inevitable that they will have to be replaced by sustainable resources. The problems for use of fossil fuels in the short term are linked to pollution, with their combustion releasing CO2 among other things, which has been linked to global warming.3-5 These factors lead to a search for alternative methods of power generation. It appears that while there are many alternative methods of power generation, each has its own disadvantages, such as solar power and wind farms, which although renewable, are very much "fair weather" technologies.6 The ideal situation would likely be a good mix of energy generation methods, from renewable forms to high efficiency, reduced fuel consumption processes in order to fulfil demand.7-10
1.2 Fuel cells
10
Fuel cells have been known since 1838 when German scientist C. F. Schœnbein first demonstrated that energy can be produced through a combination of hydrogen and oxygen whilst conducting electrolysis of H2O.13 Sir William Grove built the first fuel cell, which he called "gas voltaic battery" after observing the generation of an electric current from the conversion of hydrogen and oxygen into water using a platinum electrode with a sulphuric acid electrolyte.14 Ludwig Mond and Carl Langer are credited as the first to coin the term "fuel cell" in 1889, when they used coal gas and air in their cells, showing early fuel flexibility of fuel cells.15
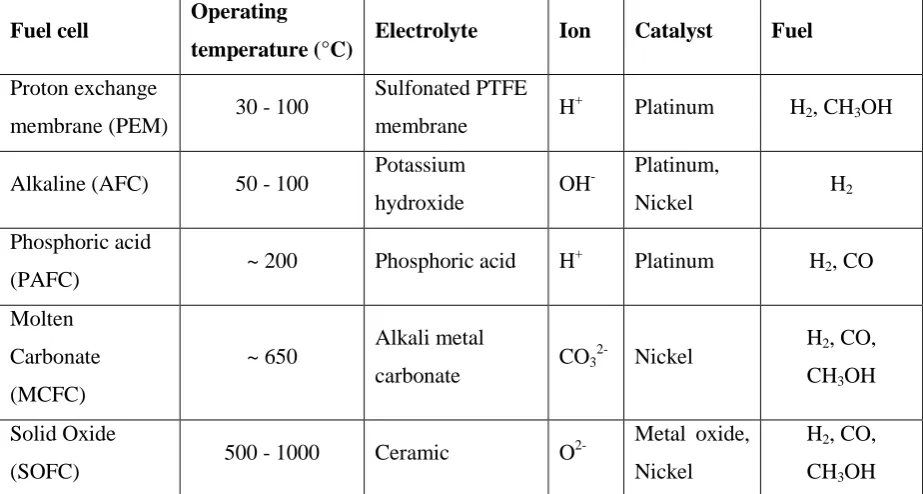
Today there are many types of fuel cell under development, each with its own materials and mechanism for electrical energy generation, leading to advantages and disadvantages over other fuel cells in certain aspects of their operation. A selection of different types of fuel cell are summarised in Table 1.1. It is the electrolyte used in each case that primarily determines the operational temperatures used as well as the type of ion transport mechanism utilised for each fuel cell type.11, 12, 16
Fuel cell Operating
temperature (°C) Electrolyte Ion Catalyst Fuel
Proton exchange
membrane (PEM) 30 - 100
Sulfonated PTFE
membrane H
+
Platinum H2, CH3OH
Alkaline (AFC) 50 - 100 Potassium
hydroxide OH
- Platinum,
Nickel H2
Phosphoric acid
(PAFC) ~ 200 Phosphoric acid H
+
Platinum H2, CO
Molten
Carbonate
(MCFC)
~ 650 Alkali metal
carbonate CO3
2-
Nickel H2, CO,
CH3OH
Solid Oxide
(SOFC) 500 - 1000 Ceramic O
2- Metal oxide,
Nickel
H2, CO,
CH3OH
Table 1.1 Shows fuel cell types, along with their electrolyte, conducted ion and common operating temperatures, catalyst and fuel.11, 12, 16
[image:10.595.67.529.414.661.2]11
"solid electrolyte fuel cell" was carried out in Westinghouse Electric Corporation in 1962, and has proved to be a landmark in fuel cell technology.17 There has since been intense research into new materials suitable for the development of large scale devices. The focus of this thesis is the development of cathodes for solid oxide fuel cells (SOFCs), which are discussed next in section 1.3.
1.3 Solid Oxide Fuel Cells (SOFCs)
1.3.1 SOFC Overview
Solid oxide fuel cells (SOFCs) are all solid-state devices that operate at high temperatures and have great potential in the power generation industry due to having one of highest electrical energy conversion efficiencies of available technologies, reported from 45 - 65 %.18 This is higher than is possible for conventional heat engines. An even higher efficiency is attainable with the additional use of turbines powered by the out flowing gas, as well as using them for combined heat and power, with a possible efficiency of up to 90 % suggested.18, 19 The power and voltage of a SOFC can be increased by stacking individual cells in a series, with an electrically conducting interconnect between adjacent cells to distribute reactants across the surface of the electrodes using flowing gas channels.12
As well as the promise of high efficiency, SOFCs have the flexibility of using a range of fuels, unlike many other types of fuel cell which require high purity hydrogen. For example, CO can be utilised as a fuel as opposed to a poison, as is the case with lower temperature fuel cells such as PEMs.20 Hydrocarbon fuels can also be used directly due to the high operating temperatures, through internal reforming or direct oxidation.21 When H2 is used as the fuel, the main by-product is H2O, hence they do not contribute to air pollution. Another advantage of SOFCs compared to other types of fuel cell is the use of solid electrolyte does not lead to corrosion problems caused when corrosive liquids are used for electrolytes.
12
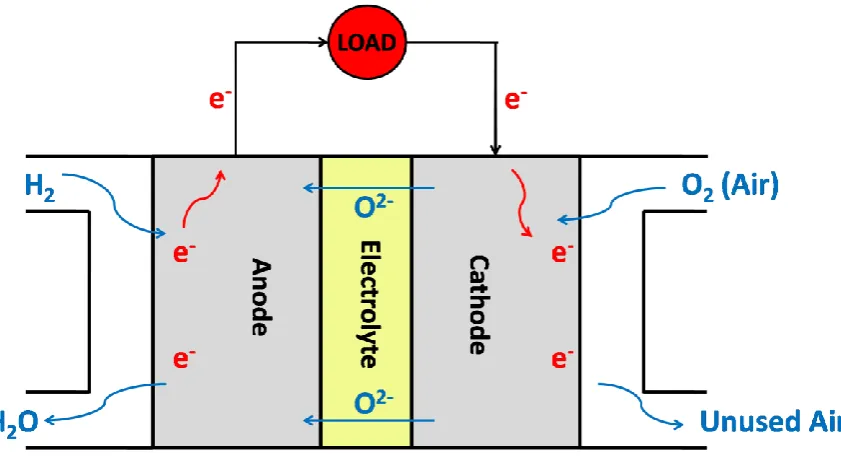
[image:12.595.89.510.214.442.2]producing electrons, which are passed through an external circuit to the cathode, where they are used to catalytically reduce oxygen. The oxygen ions are then transported across from the cathode, through the electrolyte (which exhibits high ionic and negligible electronic conductivity) to the anode to complete the circuit. The flow of electrons through the external circuit provides a source of electrical energy that can be used to do work.
Figure 1.1 Schematic diagram of the basic workings of a SOFC, with oxygen reduced at the cathode, hydrogen oxidised at the anode and an external circuit transporting the generated electrons. H2O is produced as the by-product.
The electrode reactions for a SOFC when using hydrogen as the fuel with oxygen from air are given below, together with the area of the SOFC where the reaction occurs:
→
Equation 1.1 Cathode reaction
→
Equation 1.2 Anode reaction
→
13
As can be seen in the above equations, the migratory ions are oxygen anions. The ceramics in SOFCs do not become electrically and ionically active until they reach very high temperatures. This is in part due to the high charge and size of the oxygen ion species that is transported, consequently leading to an operating temperature range of 500 - 1000 °C. The high operation temperature does have the benefit of enabling internal reforming of fuels (such as hydrocarbons, CO and CO2), resulting in the fuel flexibility discussed earlier. Thus SOFC technology is not so restricted by the hydrogen economy and its associated limitations (e.g. hydrogen storage problems), giving it advantages over other fuel cell.22, 23
Typically, SOFCs are operated at the high temperature region of 800 - 1000 °C in order to overcome low ionic conductivity of the electrolyte. For example, a typical electrolyte of a PEM, Nafion®, has a conductivity of ~ 0.1 S.cm-1 at 100 °C, while a SOFC electrolyte yttrium stabilised zirconia (YSZ) achieves this same conductivity at 1000 °C.24 In order to operate at high temperatures, there are stringent requirements for the components used in SOFC stacks, such as a high melting point, structural stability and compatibility of components at high temperatures, leading to the need for materials to be made from ceramics and high temperature stable alloys. For reduced scale applications, such as small electrical generators, lower operating temperatures are desirable, which moves operation into the intermediate operating temperature range of around 500 - 800 °C.11 Reducing the operating temperature to the intermediate range (IT-SOFCs) of 500 - 800 °C provides an opportunity for cheaper materials to be used for components such as the interconnect.12 Lower temperature operation also decreases the start-up and shut down time, reduces corrosion of metallic components, improves durability and enables a more robust construction.12, 25
14 1.3.2 SOFC Cathode limitation
Cathodes operating within the high temperatures region of 800 - 1000 °C have sufficiently rapid reaction kinetics that cell losses are only minor. As temperatures are reduced down to the intermediate range, there are increases in the polarisation losses related to the slow kinetics of the oxygen reduction reaction (ORR), which involves O2 dissociation, subsequent reduction and incorporation and transport of the ions. The activation energy (Ea) of the ORR
(often > 1.5 eV)28-31 is high compared to other processes within a fuel cell, such as ionic conductivity (often < 1 eV)32, 33 and electronic conductivity (< 0.5 eV),34, 35 therefore the cathode requires particular attention. A significant amount of recent research has gone into the improvement of cathodes at reduced temperatures.36-38 The key to this is to accelerate the ORR, which is quite complex and comprises of a number of steps. At a simplified level, the reactions involved are:
↔
Equation 1.4: O2 dissociation
↔
Equation 1.5: O2- Incorporation
↔
Equation 1.6: Transport of O2- to the electrolyte
In Equation 1.4, there is the reduction of oxygen and subsequent adsorption onto the surface of the cathode. Equation 1.5 represents diffusion of the reduced oxygen ions into the bulk of the cathode, followed by Equation 1.6, where the oxygen ions are transported from the cathode to the electrolyte.39
15
favouring the surface path. Accordingly and as shown in Figure 1.2 A, the reactive site for the ORR occurs at the triple phase boundary (TPB) where the gas, electrolyte and cathode all come into contact. Oxygen (gas) is reduced using electrons supplied by the cathode, before being incorporated into the electrolyte and transported away.
With the performance of a cathode limited by the kinetics of the ORR, which is significantly slowed at reduced temperatures, it makes sense to look for ways to improve it. Cathodes displaying mixed ionic-electronic conductivity (MIEC) are considered to be a viable solution to this as they allow incorporation of oxygen ions into the bulk of the cathode, as well as at the TPB, increasing the number of active sites and surface area for the ORR to occur (see Figure 1.2 B).40-43 It has been shown that the ORR in a porous MIEC cathode is limited by oxygen surface exchange and oxygen diffusion within the cathode, meaning that a cathode needs high ionic conductivity for maximum bulk diffusion and a surface area as large as possible for greatest possible surface exchange, along with catalytic activity for the oxygen dissociation reaction.42, 44
Figure 1.2 schematic representation of A) triple phase boundary (TPB) of oxygen, cathode and electrolyte and B) extended reaction surface for the ORR in a mixed ionic-electronic conductor (MIEC) cathode.
1.3.3 General SOFC component requirements
16
As well as the resistance, there are other properties that are required for fuel cell components. As components must function at high temperatures, the materials are required to be thermally stable at the desired operating temperature. The components are also in contact with each other, therefore reactivity between them needs to be negligible to prevent new, potentially insulating phase formation.45 The thermal expansion coefficients (TEC) need to be close matching, otherwise thermal cycling can lead to stresses and delamination of layers, ultimately leading to failure of the device. All materials must possess enough mechanical and structural stability for the conditions required for fabrication into and operation as a SOFC device.
Component Ionic
conductivity Electronic conductivity Atmospheric stability Morphology
Cathode Desired High Oxygen/Air Porous
Anode Desired High Reducing/Fuel Porous
Electrolyte High Negligible Both above Fully dense
Table 1.2 Desired properties of SOFC components.38
Additionally, as summarised in Table 1.2 above, each of the components needs to be stable in the atmospheres that they are exposed to. The cathode will operate in air (or oxygen), the anode will operate in the presence of the fuel and the fuel cell reaction products (i.e. water for hydrogen) and the electrolyte will need to be stable in both environments.
The electrolyte should be fully dense in order to prevent the direct passage of gas from one side of the cell to the other. It is required to be highly ionically conducting at the operating temperature, with a targeted conductivity of > 10-2 S cm-1. The electrolyte requires negligible electronic conductivity to prevent significant leakage current.46
17
of the electrochemically active sites. The combination of properties displayed by the electrodes is accounted for together in the area specific resistance (ASR).38, 47 A description of how the ASR is measured is described later in section 2.10.2.
1.4 Mechanisms of conductivity in SOFC components
SOFC components are required to display electronic and/or ionic conductivity. Electronic conductivity in SOFC materials is often attributed to transition metals with mixed oxidation states, which provide a charge carrier. Ionic conductivity is attributed to point defects within the structure, commonly ion vacancies or interstitials. Through doping a material with aliovalent ions, vacancies/interstitials and charge carriers can be generated, due to the need to maintain charge neutrality. Below is a description of mechanisms of electronic and ionic conductivities.
1.4.1 Electronic conductivity
According to band theory, widely spaced orbital levels of free atoms combine in a molecule forming bonding and antibonding combinations. As the number of atoms increases, the orbitals become closer in energy, until they merge together to form continuous bands for a solid (infinity atoms).
In semiconductors and insulators, there is an energy gap (Eg) between the top filled energy level, the valence band, and the bottom empty energy level, the conduction band (see Figure 1.3). In a metal, there is a partially filled band of electrons, with a delocalised cloud of electrons that are free to move throughout the solid.
18
Figure 1.3 Schematic diagrams of band structures of A) a metal, B) a semi-conductor, C) an insulator.
In a metal (Figure 1.3 A), there are a large number of electrons that are completely delocalised, free to move throughout the structure. Band theory depicts a partially filled conduction band, allowing the electrons to move, which are responsible for the high electronic conductivity. For materials displaying insulating behaviour, electrons are localised and Eg is very large, meaning few electrons have sufficient energy to be promoted from the valence band to the conduction band (see Figure 1.3 B), thus electrical conductivity is negligible. In semi-conductors, the band structure is similar to that of insulators, however Eg is not so large, which allows more electrons with sufficient energy to be promoted to the conduction band (Figure 1.3 B).
When electrons are promoted into the conduction band, they are described as negative charge carriers. The vacant electron levels that are left behind are described as positive holes. The number of electrons that are promoted to the conduction band are dependent on the magnitude of Eg, as well as temperature. At 0 K, no electrons will have the thermal energy required to be promoted to the conduction band.
19
the conduction band (Figure 1.4B), and hence electrons require less energy to be promoted from the valence band.
Figure 1.4 Schematic of the band structure of A) p-type and B) n-type semi-conductors.
A requirement of SOFC cathodes and anodes is the ability to transport electrons to and from an external circuit. Most cathodes used for SOFCs are semi-conductors, with more discussion in section 1.4.2.48
1.4.2 Electronic conductivity in transition metal oxides
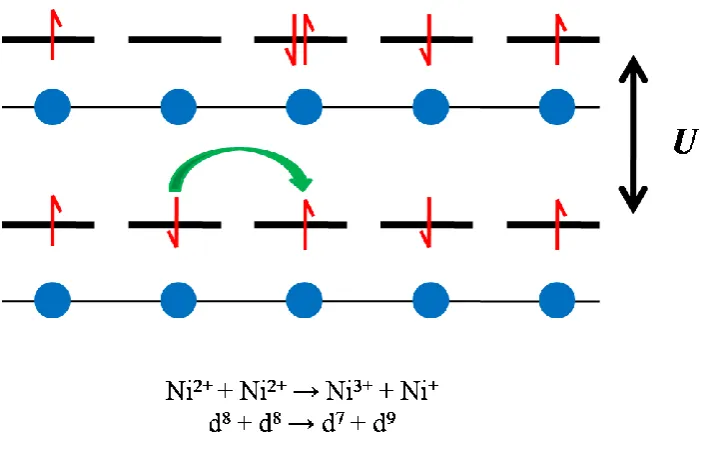
The materials synthesised in this thesis all exhibit semi-conducting behaviour. They all contain at least one transition metal on the entirely transition metal occupied perovskite B-site. Simple band theory suggests that most transition metal oxides, such as NiO (Ni2+ 3d84s0 and O2- 2p6), should display electron delocalised metallic properties due to partially filled d-levels. However, many like NiO are insulators, as the d-electrons are localised with short range Coulomb repulsion of electrons preventing the formation of band states, instead stabilising localised electron states. These materials are known as Mott-Hubbard insulators.
20
Figure 1.5 Schematic diagram showing the correlation energy (U) penalty for transferring an electron between two adjacent sites.
Figure 1.6 shows that electron repulsion can make even the half-filled band insulating when the interaction between (Bandwidth, W) atoms is small (i.e. when there is poor orbital overlap between atoms). When U > W, the d-band is split into sub-bands and an electron must overcome U, making the material a Mott-Hubbard insulator. When U ≈ W, the bandwidth is sufficient for overlap to occur and the material is metallic as there is no energy gap.49-52
Figure 1.6 Schematic diagram demonstrating the relationship of Bandwidth (W) with U in a Mott-Hubbard insulator (Ef,
21 1.4.3 Ionic conductivity
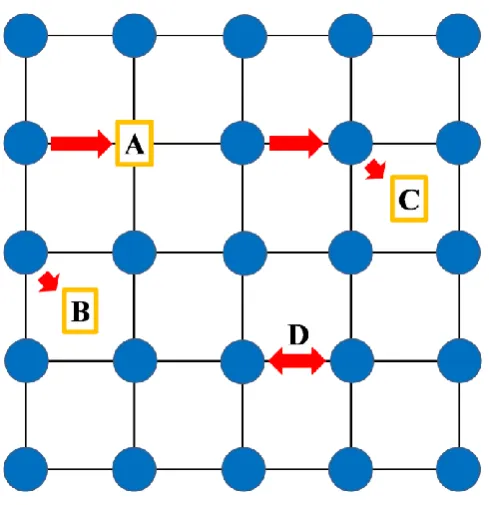
[image:21.595.177.422.406.659.2]In ionic solids, ions will vibrate continuously, and if they have enough thermal energy to escape from their lattice sites into an adjacent site, they may be in the process of becoming an ionic conductor. Ionic conductivity is generally thermally activated, involving a defect structure. Ionic conductivity can proceed when an ion moves into a vacancy, into a vacant interstitial site, or exchanges with another ion. Figure 1.7 shows four types of ion migration; A) shows the ion moving into an equivalent neighbouring but vacant site, B) shows the ion move into an interstitial site, or vice versa C) shows the movement of an ion onto a site occupied by another ion, which is then displaced into an interstitial, D) shows the exchange of positions between two ions. The vacancy defects can also be thought of as Schottky defects, which are described by cation and anion vacancies in stoichiometric units in order to maintain charge neutrality, while the vacancy plus interstitial defect can describe a Frenkel defect.48
Figure 1.7 Schematic representation of ion migration mechanisms; A) vacancy, B) interstitial, C) interstitialcy, D) exchange.
22
commonly used as electrolytes, as well as anion-deficient perovskites mainly used as both electrolytes and cathodes. The interstitial mechanism has been documented for some Ruddlesden-Popper phases used for electrode materials, as discussed later in section 1.7.3.4.53
1.5 Magnetic ordering
For a material to display paramagnetism, there must be unpaired electrons present, meaning many compounds containing transition metals or lanthanides are paramagnetic. In condensed matter, high concentrations of paramagnetic ions may interact with each other through covalent bonds to produce ordered magnetic states. Some of the more common magnetic ordering phenomena are described below.
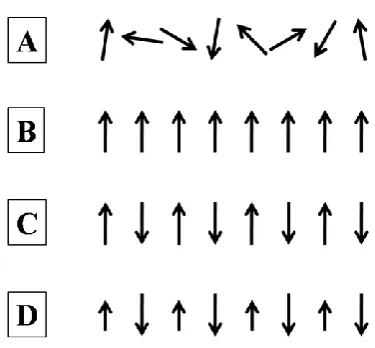
[image:22.595.204.392.503.677.2]When orientation is completely random on different atoms, a material is paramagnetic. When the electrons interact with each other, they can align parallel leading to an overall magnetic moment (ferromagnetic) or anti-parallel with zero overall magnetic moment (antiferromagnetic). If electrons align anti-parallel, but with unequal numbers, a net magnetic moment will result (ferrimagnetic). Schematic representations of these four effects are displayed below in Figure 1.8.48
23
The interaction of magnetic ions in a solid can be through direct exchange, where there is a direct coupling of magnetic ions, or superexchange, where coupling occurs via an intermediary ion.54 This coupling requires overlap of the intermediary ions orbitals with both of the magnetic ions orbitals. In the case of Fe3+ (d5) in octahedral coordination, the d orbitals are overlapping with oxygen 2p orbitals, which leads to an anti-parallel alignment and antiferromagnetic ordering as shown in Figure 1.9.
Figure 1.9 Antiferromagnetic coupling of spins of d electrons on Fe3+ ions through p electrons of O2-.
In this thesis, the materials prepared mostly contain Fe3+ on the perovskite B-site, which formed magnetically ordered antiferromagnetic structures at room temperature. Neutron diffraction was used in the characterisation of these materials, and is able to detect magnetic ordering (see Chapter 2 section 2.2.4). Modelling of the magnetically ordered structure was required in order to obtain a good fit of the data. The fitting of the magnetic data is discussed in each of the results chapters.
1.6 Structures of Particular Interest
1.6.1 Fluorite
24
Figure 1.10 Fluor spar, CaF2, representing the structure of the fluorite, with eight coordinate Ca cations (blue) and Td
coordinate F anions (red).55
Oxides adopting the fluorite structure with the general formula AO2 (A4+, O2-), have shown great utility as oxide ion conductors. As discussed above, the fluorite has a number of interstitial body centred sites vacant of a cation, which gives it quite an open structure that may lend to rapid ion diffusion. However, the main mechanism of oxide ion conductivity comes from mobile oxygen vacancy defects. Further modification of the structure is possible, with the creation of more oxide vacancies through the substitution of trivalent and divalent cations. In order to maintain electroneutrality, the lower charge cation will be compensated for through the creation of oxide ion defects.56-58 Some examples of fluorite oxide conductors are discussed in section 1.7.1.
1.6.2 Perovskite
25
lanthanide or group II cation, B is usually a transition metal and X is an anion, usually O2- or a halide). Perovskites can show great compositional diversity, forming with a combination of many elements, displaying the flexibility of the structure. Figure 1.11 below shows that the primitive unit cell of the perovskite contains A-site cations that are in the 12 coordinate cubo-octahedral sites, B-site cations in six coordinate corner sharing octahedral (Oh) sites, and X anions coordinated to four A-site cations and two B-site cations. The ideal structure adopts the cubic space group Pm ̅m, which have a cell edge length a Å (usually ~ 4 Å), which can be donated as ap.48, 59
Figure 1.11 Perovskite structure, as displayed by the archetypal SrTiO3,60 with oxygen atoms (red), strontium atoms
(yellow) and titanium atoms (blue) all represented in the primitive cubic unit cell Pm ̅m (highlighted in black box).
26
√
Equation 1.7
Where , and are the ionic radius of the anion, A-site cation and B-site cation respectively. In real systems, due the differences in sizes of X, A and B, the relationship is modified to include a tolerance factor, t:
√
Equation 1.8
For the ideal structure, t = 1, however perovskites are known to form with t = 0.81 - 1.11. The tolerance factor can give an indication whether a perovskite structure may form during synthesis, the further from unity, the less likely a perovskite structure will form.59
As the size mismatch between atoms increases and the tolerance factor moves away from 1, perovskites may form with distortions away from the ideal cubic structure. These distortions may arise from tilting or rotating of the Oh due to A-site cations being too large or small for the 12-coordinate environment. Also, B-site cations can be displaced from the centres of the Oh, or the distortions of the Oh could occur due to Jahn-Teller effects (not related to t).59 Oh tilting has been studied in detail by Glazer in 1972,61 where he developed a notation to help explain the tilting system. The tilt system is described in terms of Oh rotations about the three orthogonal Cartesian axes. That is, tilts along x, y and z of the ideal cubic structure with the magnitude a, b and c. Positive superscripts are applied if the rotations of Oh are in the same direction in successive layers, whereas negative superscripts indicate rotation of neighbouring Oh in the opposite sense. A zero superscript is used for no rotation.
Tilting of Oh leads to a reduction in symmetry from the ideal Pm ̅m Glazer tilt system
( , creating sub-groups of lower symmetry. For example, the orthorhombic space
group Pnma can be produced through tilting the original cubic cell Oh , giving
27
Ordering within a perovskite can occur when A-site or B-site cations are partially substituted by cations of a different charge or size. Ordering is most common for B-site cations and can result in compounds with the general formula A2BB'X6, where B and B' are both in Oh coordination, but located on crystallographically distinct sites. The phase would be called a double perovskite, as with the example shown in Figure 1.12, K2NaAlF6.62 A-site ordering can also occur, for AA'B2X6, the A and A' would also be located in distinct crystallographic sites.
Figure 1.12 Crystal structure of the double perovskite K2NaAlF6,62 with oxygen atoms (red), potassium atoms (purple),
sodium (dark yellow) and aluminium (blue) all represented in the cubic unit cell ̅ .
28
are tilted, leading to the coordination of the A-site being either 7, 8 or 9 and generating conditions for A-site ordering.
Figure 1.13 Crystal structure of brownmillerite phase Ca2AlFeO5,64 with oxygen atoms (red), calcium atoms (blue), iron
atoms (brown) and aluminium atoms (pale blue, within polyhedra) all represented in the orthorhombic unit cell .
[image:28.595.168.383.157.435.2]29
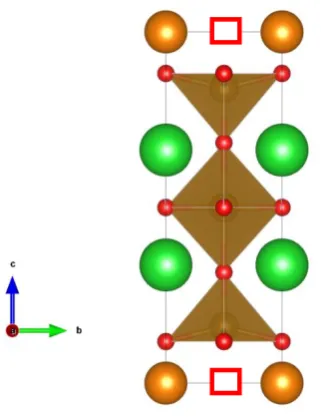
Figure 1.14 YBa2Fe3O8 crystal structure,65 displaying oxygen vacancies (red box), oxygen atoms (red), barium atoms
(green), yttrium atoms (orange) and iron atoms (brown) represented in the tetragonal unit cell .
A-site ordering and brownmillerite structure types are important to the work carried out in this thesis, with the structures presented closely related to them. Intergrowths between these structure types are also possible, creating extended structures that are presented in the results chapters 3, 4 and 5.
1.7 SOFC Materials
1.7.1 Electrolytes
[image:29.595.188.349.76.285.2]30
mechanically strong enough to prevent cracking.66 Below are some examples of current electrolyte materials, with the main focus on those used in this thesis.
1.7.1.1 Stabilised ZrO2
Yttria-stabilised zirconia (YSZ) is the most common electrolyte material used in SOFCs. Pure ZrO2 adopts the cubic fluorite structure above 2300 °C,67 with substitution of Y3+ for Zr4+ not only stabilising the structure in a cubic fluorite structure at room temperature (see section 1.6.1 and Figure 1.10), but also increasing the concentration of oxide vacancies through charge compensation, increasing the ionic conductivity.68 YSZ shows its highest conductivity at 8 - 10 mol% Y2O3, with a value of 1.3 x 10⁻¹ S.cm-1 achieved at 1000 °C.69-71 YSZ is chemically stable in oxidising and reducing atmospheres in the oxygen partial pressure range of 1 - 10-17 atm.72 The TEC of YSZ has been reported to be 10.5 x 10⁻⁶ K-1 between room temperature and 1000 °C.73
There are some potential compatibility issues for YSZ, as reactions with common cathode phase La1-xSrxMnO3-δ (LSM) have been reported at fabrication temperatures of 1250 °C, with the formation of pyrochlore phase La2Zr2O7,74-79 or perovskite SrZrO3,80-82 leading to degradation of cell performance due to the lower conductivities of the reaction products.83 An alternative doped zirconia is scandia-stabilised zirconia (ScSZ), which shows the higher conductivity than YSZ and the highest oxygen ion conductivity of all the zirconia based oxides, with a conductivity of 0.32 S.cm-1 at 1000 °C for 8 mol% Sc2O3 and a TEC of 10.7 x 10⁻⁶ K-1.84-86 The highly conducting cubic phase exists above 600 °C; below this, a rhombohedral phase exists with much reduced conductivity. It has been shown that the cubic phase can be stabilised at room temperature through co-doping with cations as Y.87
1.7.1.2 Doped CeO2
31
compared to YSZ, especially at reduced temperatures, as well as a lower polarisation resistance.91 Gd0.1Ce0.9O1.95 has been reported with a conductivity of 3.2 x 10⁻² S.cm-1 at 700 °C, higher than that observed for YSZ.73
The main problem with doped ceria is that it displays electronic conductivity at low oxygen partial pressures due to the partial reduction of Ce4+ to Ce3+, making it only viable for a SOFC operating at ≤ 600 °C.73, 91, 92 Doped ceria does however, shows improved chemical stability when compared to YSZ for LSM (in this case M = Mn, Co, Fe),93-95 and has been used as a buffer layer between YSZ electrolyte and electrode.96, 97 The TEC of doped ceria range around 11.5 - 12.5 x 10⁻⁶ K-1.98
In this thesis, Gd0.1Ce0.9O1.95 and Sm0.2Ce0.8O1.9 were used as electrolyte substrates for symmetrical cell fabrication.
1.7.1.3 Doped LaGaO3
The perovskite lanthanum gallate, when suitably doped, has been shown to display very high oxide ion conductivity within the intermediate temperature range identified for SOFCs.99 Sr and Mg co-doping (LSGM, La1-xSrxGa1-yMgyO3-δ) produce a material that has higher conductivity when compared to YSZ and ScSZ, but lower than that of doped ceria (0.11 S.cm-1 at 800 °C).100 The main advantage that LSGM possesses over doped ceria is that it does not contain any easily reduced cations, meaning that it displays negligible electronic conductivity, even at low partial pressures of oxygen.99
LSGM is more stable with La containing perovskites such as LSM compared to YSZ, with no new phase formation observed. There are however, reports of cation diffusion between LSGM and LSM (La1-xSrxMnO3-δ) cathodes, though this is not necessarily detrimental to performance.101, 102 There are some reactivity issues with Ni, when using the most common anode, Ni-YSZ. The formation of La2NiO4 has been observed, which resulted in decreased performance.101 For the composition La0.9Sr0.1Ga0.8Mg0.2O2.85, a TEC has been recorded at 11.9 x 10⁻⁶ K-1, measured from room temperature to 1000 °C.103, 104
32
Figure 1.15 Crystal structure of La0.9Sr0.1Ga0.8Mg0.2O2.85,105, 106 with oxygen atoms (red), Lanthanum atoms (green),
strontium atoms (yellow), gallium atoms (pale purple), magnesium atoms (orange, within polyhedra) all represented in the orthorhombic unit cell . 105, 106
1.7.2 Anodes
As a summary from section 1.3.3, SOFC anodes are required to display electronic conductivity in order to transport electrons that were generated by electrochemical reactions to an external circuit. They are also required to be catalytically active for the oxidation of fuels, chemically and thermally compatible with the electrolyte, thermally stable up to operating temperatures in the presence of the fuel. Ionic conductivity is also a desired property in order to transport oxygen ions from the electrolyte to the reactive sites. The anode should also be fabricated with high porosity in order to increase the number of electrochemically active sites.107
[image:32.595.191.409.95.309.2]33
hydrogen is used as the fuel.108 Although Ni has a higher TEC (13.3 x 10⁻⁶ K-1) when compared to YSZ, in a cermet the TEC is reduced and becomes comparable to that of YSZ. Ni also has a very high electronic conductivity of σ 2 x 10⁴
S.cm-1.109
Ni/doped ceria cermets have also been used as anodes, using the same approach as for Ni/YSZ cermets. The CeO2 however, become a MIEC under the reducing atmosphere at the anode, which leads to an enhancement of catalytic activity.107
As Ni cermets are a problem for LSGM electrolytes with the formation of La2NiO4, alternatives have been investigated. Such alternatives include the rhombohedral perovskite phase La1-xSrxCr0.5Mn0.5O3-δ seen below in Figure 1.16.110, 111
Figure 1.16 Crystal structure of La0.75Sr0.25Cr0.5Mn0.5O3-δ,112 with oxygen atoms (red), lanthanum atoms (green), strontium
atoms (yellow), manganese atoms (purple) and chromium atoms (blue, within polyhedra) all represented within the rhombohedral unit cell ̅ .
1.7.3 Cathodes
34
at intermediate temperatures. A porous microstructure is also required in order to maximise the surface area for the ORR to occur over.
In this next section, the most common cathodes will be discussed, as well as the more novel layered perovskite cathodes, which are structurally related to the materials studied in this thesis.
1.7.3.1 La1-xSrxMnO3-δ (LSM)
The perovskite LSM (La1-xSrxMnO3-δ) is among the most widely investigated electrode materials for SOFCs.113 The electronic conductivity of LSM is enhanced through the A-site substitution of Sr2+ for La3+, which creates an electron hole on the B-site to maintain electroneutrality. Sr is the preferred alkaline earth dopant as it results in a stable perovskite that exhibits high electronic conductivity in oxidising atmospheres.114, 115 A conductivity as high as 320 S.cm-1 has been recorded for LSM at a temperature of 800 °C.116 The TEC of LSM varies from between 11.2 - 12.7 x 10⁻⁶ K-1, which is slightly higher than YSZ, but in close match with the doped ceria and LSGM phases.117, 118 LSM has minimal oxygen vacancies within its structure, which leads to very low ionic conductivities, such as 5.9 x 10⁻⁸ S.cm-1 at 800 °C for La0.9Sr0.1MnO3-δ.119 The low ionic conductivity is considered to be the main cause for the high polarisation losses of LSM cathode for the ORR in IT-SOFCs, making only appropriate to use as a high temperature cathode.120 Both the ionic and the electronic conductivity can be increased through increased substitution of Sr for La, however at levels of greater than 30 mol% Sr, insulating SrZrO3 will form with YSZ.37 Composites with ionic conductors YSZ and GDC have also been reported, which has been shown to enhance the performance of LSM.121
1.7.3.2 La1-xSrxCoO3-δ (LSC), La1-xSrxFeO3-δ (LSF) and La1-xSrxCo1-yFeyO3-δ (LSCF)
35
not just limited to the TPB for this material.37 LSC shows high oxygen diffusivity and high catalytic activity towards the dissociation of oxygen molecules,122 and the electronic conductivity has been reported as high as 1600 S.cm-1 at 800 °C. It does however, have a very large TEC, in the region of 20 x 10-6 K-1, much higher than that of current electrolytes and likely to lead to delamination during operation.123 The high TEC of this phase and other cobalt systems is related to the formation of oxygen vacancies, spin-state transitions associated to Co3+,124 and the relatively weak Co-O bond.125
The total substitution of Fe for Co has the effect of lowering the TEC, but it also lowers the cathode performance. La1-xSrxFeO3-δ (LSF) has been shown to have a TEC of 12.2 x 10⁻⁶ K-1, which is a good match for ceria based electrolytes.126 An ASR of 0.1 Ω.cm2 at 800 °C has also been reported for LSF.95
Partial doping of LSC with Fe results in compounds with the general formula La1-xSrxCo 1-yFeyO3-δ (LSCF), which have a TEC around 15 - 20 x 10-6 K-1, with the lower TEC attained for higher Fe content.37, 127 An electronic conductivity in the order of 102 S.cm-1 and an ionic conductivity in the order of 10-3 S.cm-1 at 750 °C have been observed.127, 128 There are also reports that show composites of LSCF with GDC not only reduce the TEC, but also lead to improved cathode performance.94, 129 The main drawback of LSCF as a cathode is related to the reduced performance during long term operation, which is caused by Sr diffusion out of the cathode.130, 131
1.7.3.3 Ba0.5Sr0.5Co0.8Fe0.2O3-δ (BSCF)
36
Another potential problem for this material is that it has a low tolerance for CO2, readily decomposing in its presence to form carbonates of Ba.133-136 This low tolerance appears to be an issue for many perovskite phases containing alkaline-earth elements.137-139 A further drawback for BSCF is that the phase undergoes decomposition into insulating Co rich hexagonal phases and a cubic Sr rich phase at temperatures below 900 °C.140-143 Much of the work being carried out on this phase involves attempts to improve the stability of the phase, whilst retaining as much of the performance as possible.144
1.7.3.4 Ln2NiO4+δ
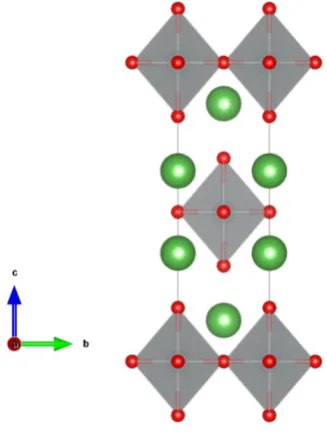
[image:36.595.195.359.494.711.2]The general formula of a Ruddlesden-Popper (RP) material can be written as An+1BnO3n+1,145 which consists of nABO3 perovskite layers sandwiched between AO rock-salt layers. The crystal structure of the n = 1 phase, as represented by Ln2NiO4,146 is shown in Figure 1.17. RP phases have been studied as potential SOFC cathodes, as they have been shown to display oxygen non-stoichiometry, enabling a mechanism for fast ionic conductivity.147 For n = 1, the most noted SOFC phase is based on Ln2NiO4+δ (Ln = La, Nd, Pr most common) with interstitial oxygen accommodation shown in the AO rock-salt layers, leading to fast ion conduction.53
Figure 1.17 Crystal structure of Ruddlesden-Popper, represented by La2NiO4,146 with oxygen atoms (red), Lanthanum atoms
37
Ln2NiO4+δ has shown electronic conductivity of ~ 65 S.cm-1 at 750 °C,148, 149 and a TEC of 11 - 14 x 10-6 K-1, within the range of common electrolytes.37 An ASR of 0.5 Ω.cm2 at 610 °C has been recorded for Ln = Pr, which is the lowest achieved for this phase.150 Ln2NiO4+δ has however, been shown to react with electrolytes YSZ and GDC at temperatures above 800 °C,151 as well as leading to phase segregation to n = 2, 3 RP phases when annealed at 950 °C for two weeks.152
1.7.3.5 LnBaCo2O5+δ
Double perovskites, that form due to ordering of the A-site (AA'B2O5+δ, where A = rare earth, A' = alkaline earth) are another structure type to have shown great promise as SOFC cathodes. With ordering of the A-site, ordered O vacancies are created in the rare-earth planes, forming channels that are known to enhance oxygen transport properties, which was demonstrated in GdBaCo2O5+δ (GBCO) and PrBaCo2O5+δ (PBCO).153, 154 The crystal structure of GdBaCo2O5.5 is shown in Figure 1.18, which highlights the vacancy channels created in the lanthanide plane of the ordered phase.155
Figure 1.18 The structure of the ordered double perovskite GdBaCo2O5.5,155 with oxygen atoms (red), gadolinium atoms
(purple), barium atoms (green) and cobalt atoms (dark blue) all represented in the orthorhombic unit cell .
38
of 0.25 Ω.cm2 at 625 °C for GBCO and at 550 °C for PBCO has been reported, with this material showing great promise as a cathode.154, 156, 157 GBCO has also showed good stability in the presence of up to 500 ppm CO2.158 GBCO has also shown excellent stability with LSGM and doped ceria electrolytes, though it reacts with YSZ forming BaZrO3.158-161
1.7.3.6 Y0.9Ba1.7Ca2.4Fe5O13-δ (10ap)
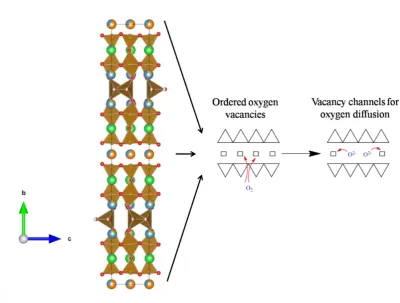
[image:38.595.93.494.406.709.2]The 10ap phase, Y0.9Ba1.7Ca2.4Fe5O13-δ, forms with a ~ 38 Å stacking axis due to A-site ordering, which leads to oxygen vacancy ordering and therefore B-site cations in three different coordination geometries, tetrahedral (Td), octahedral (Oh) and Square pyramidal (Sq) in a 1:2:2 ratio. It has structural similarities with LnBaCo2O5+δ, through the presence of channels of ordered oxygen vacancies forming between Sq sites. Figure 1.19 shows the structure and representations of the ordered oxygen vacancies for the 10ap.
Figure 1.19 Structure of 10ap,35 showing ordered oxygen vacancies that provide sites for oxygen dissociation and oxygen
39
This phase shows good performance as a SOFC cathode, attaining an ASR of 0.87 Ω.cm2 at 700 °C when first published,35 then being lowered to 0.25 Ω.cm2 after some modifications to cathode processing.162 The 10ap phase is also thermally stable and chemically compatible
with SDC and LSGM, although it reacts with YSZ forming BaZrO3. The average linear expansion of the 10ap phase is 11.8 × 10⁻⁶ K-1,35 which matches well with doped ceria and
LSGM. The main drawback for this material is its low electronic conductivity of 2.06 S.cm-1, which is 102 S.cm-1 lower compared to LSCF and 101 S.cm-1 lower than BSCF.37
1.8 Aims of Thesis
The aims of this thesis have focused on work involving A-site ordered perovskites, leading to the formation of extended structures with ordered oxygen vacancies. The doping of a previously reported phase, Y0.9Ba1.7Ca2.4Fe5O13-δ (10ap),35 was carried out in order to try to
improve the performance of the material as a cathode. What follows in this thesis are the results from the attempted doping of this phase, which has led to the discovery of a new phase, as well as the successful doping of the aforementioned phase.
2 Experimental Methods
2.1 Synthesis
Solid state synthesis was the method used in this thesis for the preparation of target phases. The formation of thermodynamic products is achieved through the grinding of appropriate quantities of starting materials in an agate pestle and mortar, followed by subsequent reaction at high temperatures. Grinding reduces particle size and increases homogeneity within the sample, with mixing aided by the use of a solvent such as acetone. The mixed samples are typically contained within an Al2O3 crucible for reactions, due to its refractory properties and perceived inert nature, followed by annealing at high temperatures for a wide range of timescales, from hours to weeks depending on requirements. High temperatures are required, often exceeding 1400 °C, in order to enable ion diffusion to overcome kinetic barriers, along with long timescales due to the slow rate of diffusion in many cases. In order to decrease reaction timescales, the reactant powders are pressed into pellets to maximise contact between individual grains. Repeated grinding and annealing can be required to aid a reaction to completion, resulting in the formation of a thermodynamic product. Although there may be good mixing and contact between individual particles, on the atomic scale samples will generally be very inhomogeneous, meaning for reactions to reach completion, ions have to diffuse over long distances.48
41
completion, indicated through the use of laboratory powder X-ray diffraction (PXRD) patterns, which stopped changing between cycles on reaction completion. After noticing that the starting materials had reacted with Al2O3 crucibles (discussed in Chapter 3), Pt foiled lined Al2O3 or Pt metal crucibles were used in the synthesis of all materials discussed in this thesis.
When scaling up synthesis of a previously isolated phase (typically on a 3 - 5 g scale), additional steps were undertaken to ensure homogeneity. The starting materials were milled in a Fritsch pulverisette planetary mill for at least 4 hours at 350 rpm in Yttrium Stabilised Zirconia pots using 8 5 mm ceramic balls made from the same material as grinding media with 4 ml isopropanol for every 1 g of sample. The resultant slurry had the solvent removed by evaporation from a Pyrex evaporating basin on a hot plate at ~ 60 °C in a fume hood. Hand grinding of the dried powder was carried out before undergoing identical annealing treatment as the same sample does on the 0.5 g scale.
Cooling rates are particularly important when considering the ordering of materials investigated in this thesis, particularly as discussed in chapter 3. Depending on the system in question, many phase transitions can occur at different temperature ranges, with systems often becoming more disordered at high temperature.163-165 In order to access phases that form at higher temperatures, quenching can be a useful technique. For the 16ap phase in
Chapter 3, on the final annealing step, the sample was directly removed from the furnace at its synthesis temperature of 1200 °C and placed on a Al metal quenching block, which is highly thermally conducting,166 enabling the sample to reach < 100 °C within a few seconds and room temperature within minutes. Quenching helped to preserve the metastable high temperature phase, preventing the formation of an unwanted secondary 10ap phase.
The use of different atmospheres was also utilised during this thesis. Under "normal" synthesis conditions, a box furnace was used, subsequently samples were annealed under static air. For synthesis in an alternate atmosphere, a tube furnace was used that enabled flowing gas from a compressed gas cylinder to be used to deliver the chosen atmosphere.
42
2.2 Powder Diffraction Techniques
2.2.1 Diffraction and Crystal Symmetry
All phases prepared in this thesis are crystalline in nature, which has allowed the extensive use of powder diffraction for characterising their crystal structures. An ideal crystal structure can be described as a 3-dimentional lattice with a repeating structural motif made up of atoms or molecules ordered in a periodic way. The lattice can be described by choosing a parallelepiped unit cell with edges a, b and c and angles α, β and γ containing atoms in a specific spatial arrangement. Stacking of the unit cell in all three dimensions results in the crystal structure. It can be classified into seven different crystal systems depending on the geometry of the unit cell, which are summarised in Table 2.1.
Crystal system Cell edge Cell angle
Triclinic a ≠ b ≠ c α ≠ β ≠ γ ≠ 90°
Monoclinic a ≠ b ≠ c α = γ = 90°, β ≠ 90°
Orthorhombic a ≠ b ≠ c α = β = γ = 90°
Tetragonal a = b ≠ c α = β = γ = 90°
Hexagonal a = b ≠ c α = β = 90°, γ = 120°
Trigonal a = b = c α = β = γ ≠ 90°
Cubic a = b = c α = β = γ = 90°
Table 2.1 The seven crystal systems together with their characteristic unit cell parameters.
The Bravais lattice, combined with the unit cell, describes the translational symmetry of the crystal structure. The possible types of centring are; primitive (P), body centred (I), face-centred (A,B,C) and rhombohedral (R).
43
is combined with all possible symmetry elements for the unit cell, 230 unique space groups are defined.167
2.2.2 Diffraction
Due to the periodic nature of a crystalline material, structural characterisation by diffraction is a powerful tool. X-rays, neutrons and electrons can all be used in diffraction experiments due to their appropriate wavelength, which is in the order of magnitude of atomic radii and inter atomic spacing. Diffraction and the use of these radiation sources are described in the following sections.
2.2.3 X-ray Diffraction (XRD)
When a beam of X-rays propagates through a solid, they can interact leading to various processes occurring. One such process, fluorescence, occurs when photons are absorbed by ionising core electrons, with secondary photons emitted in random directions as the ions relax to their ground state. Although fluorescence contributes to the background signal of a diffraction experiment, it can be minimised through careful selection of wavelength.
Another process is the scattering of photons by electrons, caused by Coulombic interaction of the electron with the oscillating field of the X-ray beam. If energy is lost from a photon during collisions with core electrons, with an associated wavelength increase, the scattering process is inelastic. Elastic scattering occurs when a scattered X-ray beam is radiated by an oscillating electron at the same frequency and wavelength as the incident wave. This process gives rise to Bragg scattering and is used in crystallography.
44
Figure 2.1 Schematic diagram showing Laue scattering by a 1-Dimensional lattice of monochromatic radiation from a single source. Labels of angle and distances used in construction of Laue equation (Equation 2.1).
The condition for constructive interference from a row of atoms along the x-axis is satisfied if, for a specific diffraction angle, the path length differs by an integer (n) of wavelength (λ) such that:
Equation 2.1
45
Figure 2.2 Examples of lattice planes with their corresponding Miller indices.
According to Figure 2.3, constructive interference occurs when the difference in path lengths (xyz = xy + yz, and from trigonometry xy = zy = dsinθ) for beams A and A' is equal to an integer number (n) of wavelengths (λ). This is known as Bragg's law and is shown in Equation 2.2. Bragg's law is not satisfied when scattered beams are out of phase, leading to destructive interference.
Figure 2.3 Bragg reflection of monochromatic radiation from a single source from regularly spaced planes of atoms. Labelled angles and distances used to construct Bragg equation (Equation 2.2).
Equation 2.2
46
Bragg's law relates d-spacing to the angle of diffraction (θ) at a given wavelength (λ). This means that a diffracted beam, monitored at variable θ, only has constructive interference at discrete values of θ that is dependent on the dhkl (spacing of diffracting planes). Assigning hkl
Miller indices to observed reflections is known as indexing, and it allows determination of unit cell parameters and crystal system. Bravais lattice type can be deduced based on systematic absences identified, caused by translational symmetry within the unit cell.
Although information derived from Bragg's law is of importance, it is not able to describe the actual arrangement of atoms within a real crystal. The intensity of each reflection (Ihkl) needs
to be considered, which is dependent on the structure factor (Fhkl), the Lorentz factor (L)
which is dependent on instrument geometry, a polarisation correction (p) and a scale factor (s), which are related in Equation 2.3.
| |
Equation 2.3
As the structure factor dominates, the equation can be considered as follows:
| |
Equation 2.4
The structure factor describes a number of crystal characteristics and can be defined by the complex mathematical function shown in the equation below:
∑
[ ]
47
Where fn(θ) is the atomic form factor, which is the θ dependent scattering amplitude of an
atom n. The coordinates of n are given by xn, yn, zn and the temperature dependent
Debye-Waller factor is q.
For X-rays, fn(θ) is proportional to the electron count (Z) of the scattering atom, therefore
heavy atoms are the strongest scatterers. The dependence on θ comes about due to a small amount of destructive interference introduced as photons are scattered from different regions of the same atom, giving slightly different path lengths.
The Debye-Waller factor, q, models temperature dependent vibrations of atoms about their equilibrium positions, with atoms existing at larger average distances from their equilibrium positions at higher temperatures. With a larger effective size, intensities observed decrease rapidly with increasing θ. Equation 2.6 for a simple isotropic thermal motion of atoms, with Biso and Uiso experimentally determined isotropic temperature factors, is as follows:
(
)
Equation 2.6
If the scattering amplitudes of atoms within a unit cell are known, in principle the intensity of the observed Bragg reflections can be used to determine their coordinates and fully describe the crystal structure. This is used in the Rietveld method, as described in section 2.2.7.167
2.2.4 Neutron Diffraction (ND)
48
Equation 2.7
Equation 2.8
Where h is Planck's constant, m is a particle's rest mass and v is the particle's velocity and p is particle momentum. Neutrons can therefore be diffracted by a crystal if they have suitable energy. Although the same conditions apply for the scattering of neutrons as those for the scattering of X-rays, the scattering mechanisms are somewhat different. Neutrons are scattered directly by the nucleus of an atom via nuclear force, which acts over a considerably shorter distance than that of the incident neutron wavelengths (10-15 m and 10-10 m respectively). As the scattering points for neutrons are so small, atomic form factors are independent of θ. It also means neutrons interact fairly weakly with matter, leading to generally large samples required (3 - 6 g) for neutron powder diffraction (ND) experiments if data collections are kept to reasonable timescales.
49
Element Atomic number (Z) Bound coherent scattering length (fm)
O 8 5.803
Ca 20 4.70
Fe 26 9.45
Co 27 2.49
Cu 29 7.718
Sr 38 7.02
Y 39 7.75
Ba 56 5.07
Table 2.2 Elements used in materials for this thesis, together with atomic number and coherent scattering lengths.168
Neutrons can also be diffracted by a lattice of ordered magnetic moments due to them being spin-½ particles. The intensity of the diffracted beam of neutrons is proportional to the square of the magnetic scattering factor and in turn, to the magnitude of the magnetic moment. When a beam of neutrons is incident upon a magnetically ordered crystal, two diffraction patterns, a structural and magnetic pattern are superimposed together. Neutron diffraction can be used to solve magnetic structures, with Shull et al first demonstrating this in 1951.169 Magnetic scattering occurs from localised unpaired electrons, generally in the outermost orbitals, leading to strong θ dependency, with magnetic Bragg reflections appearing at appreciably greater intensities at low scattering angles.167
2.2.5 Electron Diffraction (ED)
Electrons, like neutrons in section 2.24, can also be described by de Broglie's ideas of wave-particle duality, as described by Equation 2.8. The momentum of an electron is created by accelerating it through a potential drop, V, which gives it potential energy, eV. With the kinetic energy equal to potential energy:
50
And when momentum is equated to mass through substitution for v:
Equation 2.10
And substitution into Equation 2.8 gives:
Equation 2.11
The inverse relationship between λ and V means that by increasing the accelerating voltage, the wavelength is decreased, therefore allowing wavelength to be controlled.
As the electron is a low mass negatively charged particle, it can be easily deflected when passing close to other electrons or the positive nucleus of an atom. These Coulomb interactions cause scattering of the electrons, which makes diffraction experiments possible. The probability of a scattering event can be related to the cross-section (σatom), or effective
radius of a single isolated atom, r:
Equation 2.12
51
Radiation Wavelength, λ
X-rays Region of a few Å48
Neutrons 0.5 - 3 Å48
Electrons 0.0087 - 0.037 Å170
Table 2.3 Types of radiation and their usual associated wavelengths.
The elastic scattering of electrons can be described as:
(
)
Equation 2.13
Where e is the elementary charge. Hence the heavier atoms more strongly scatter electrons than lighter atoms within a crystalline material, similar to the behaviour of X-rays.
Electron beams diffracted within a crystal may undergo a secondary diffraction event, resulting in secondary diffraction. As a consequence, additional reflections can appear, making analysis of the crystalline material more difficult. In order to alleviate this problem somewhat, very thin samples are required, reducing the chances of secondary diffraction occurring. Despite this, ED is a powerful technique, especially reliable for space group identification since kinematically forbidden reflections in XRD can be observed.
Electron radiation can also interact with matter inelastically, causing additional processes, which can be useful in other analytical techniques. Some of these techniques will be discussed in section 2.3.170
2.2.6 Powder Diffraction