International Journal of Innovative Technology and Exploring Engineering (IJITEE) ISSN: 2278-3075, Volume-8, Issue-10, August 2019
Published By:
E-Learning Attributes Selection Through Rough
Set Theory and Data Mining
C.S.Sasikumar, A.Kumaravel
Abstract: Recent research makes wide efforts on attribute selection methods for making effective data preprocessing. The field of attribute selection spreads out both vertical and horizontal, due to increasing demands for dimensionality reduction. The search space is reduced very much by pruning the insignificant attributes. The degree of satisfaction on the selected list of attributes will only be increased through verification of more than one formal channel. In this paper, we look for two completely independent areas like Rough Set theory and Data Mining/Machine Learning Concepts, since both of them have distinct ways of determining the selection of attributes. The primary objective of this work is not only to establish the differences of these two distinct approaches, but also to apply and appreciate the results in e-learning domain to study the student engagement through their activities and the success rate. Hence our framework is based students’ log file on the portal page for e-learning courses and results are compared with two different tools WEKA and ROSE for the purpose of elimination of irrelevant attributes and tabulation of final accuracies.
Keywords: E-Learning, Data mining, Rough Set Theory, Classifications, Selection of Attributes, Search methods, WEKA, ROSE
I. INTRODUCTION
One of the main prime factors for the society is Education. There are two modes available firstly the direct mode through conventional educational institutions and the second recently familiarized mode by e-learning. The data collected on courses, assessments and learners are inherently having the hidden patterns about the quality of education and it becomes more explicit in case of the integrity and completeness of the available data [1]. The earlier studies [22-26] students’ academic performance was evaluated by different techniques. Application of data mining over students’ data in the context of e-learning is gaining popularity and the authors find chances for applying parameter tuned classifiers [2,3] augmented with attribute selection by types of search methods and preprocessing e-learning dataset [14-16]. Discovering the patterns in educational data by EDM to resolve the issues in student’s academic performance is depending on the fundamental principles of statistical and data mining techniques [4]. Stakeholders of education industry are badly in need of models for students’ performance prediction as the student’s individual future career climbing as well as the reputation of the institution providing the courses are tied down to it. The e-learning datasets are rare in comparison to conventional education dataset and it can be treated as subset of the other as sometimes most of the attributes are common to both. However,
Revised Manuscript Received on August 05, 2019
C.S.Sasikumar, Research Scholar in Bharath Institute of Higher
education and Research, Chennai.
A.Kumaravel, Professor and Dean, School of Computing, Bharath
Institute of Higher education and Research, Chennai.
the quality in the data matters for quality prediction which in turn can be used for enhancing the students’ performance. Most of the time the redundancy in the data gives more time for processing and misses the chances of getting optimal accuracy. The problem of searching for redundant attributes demands either equivalence classes in which the equivalent attributes are put together and among which any one of them can be treated significant and the rest of the equivalent attributes as insignificant or by ranking them using criteria measures and removing the attributes in the tail end of the rank list. Such elimination of the attributes should not contribute to an error or loss of information eventually. Attribute selection is one of the filters in data preprocessing that can help us to reduce the time complexity in the search space which is of exponential and intensive computational nature. The degree of satisfaction on a selected list of attributes will only be increased through verification of more than one formal channel. In this paper, we look for two completely independent areas like Rough Set theory and Data Mining/Machine Learning Concepts, since both of them have distinct ways of determining the selection of attributes. The main aim of this work is not only to establish the differences of these two distinct approaches, but also to apply and appreciate the results in e-learning domain to study the student engagement through their activities and the success rate. Hence our framework is based students’ log file on the portal page for e-learning courses and results are compared with two different tools WEKA and ROSE for the purpose of elimination of irrelevant attributes and tabulation of final accuracies. This paper follows the format for discussing methods and materials in the next section which includes data description and introducing the tools for attribute selection, finally the presentation of the results of the experimental setup with possible interpretations.
II. METHODS AND MATERIALS
Our work deals broadly with search methods for attribute selection which reduces the dimensionality of the search space. This approach has got three steps. Firstly is to identify the attributes to be selected, secondly is to check the selected attributes for the possibility of higher performance and finally to terminate the searching with threshold conditions. The same approach is tested with two independent tools one based on rough set theory called ‘ROSE’ (ROugh Set Explorer) and another based on machine learning algorithms called ‘Weka’ (Waikato environment for Knowledge Analysis). We mainly apply supervised algorithms for classification in more than one iteration in order to identify the useful attributes. The attributes are representing the significant events in the engagement of students and hence the accuracy of predictions are enhanced by
the learning models fit by those selected attributes.
experimental set up based on this proposed approach. In rough set theory, an unnormalised (not gone through any normalization procedures in data transformation) relation or information table is implemented as a tuple T = (O, F) where O and F are non-empty finite sets, O consists of elements treated as primitive objects and F represents the set of fields or features. Each feature, or field a ∈ F is linked with a set V (set of values), called the domain of a. We may divide the feature set F into two subsets CN one for conditional attributes separately and another DC for decision attributes, respectively. Let P ⊂ F be a subset of attributes. The indiscernibility relation, denoted by ID(P), is an equivalence relation defined as: ID(P) = {(a, b) ∈ O × O such that ∀a ∈ P, v(a) = v(b)}, where v(a) represents the value of feature a of object a. If (a, b) ∈ ID(P), a and b are said to be indiscernible based on the subset P. The family of all equivalence classes of ID(P) (called Quotient represented by U generated by P) is denoted by O/ID(P). Any member in U/ID(P) is a set of indiscernible objects based on P. Specific equivalence classes O/ID(CN) and O/ID(DC) are called conditional and decisional classes respectively. RST can be defined by means of approximations (as in equations 1 and 2). These expressions are called lower approximation and upper approximation respectively. The collection of instances is nothing but the universe U and we assume an equivalence relation R to represent the knowledge about instances in U. To characterize the set X with respect to R, we depend on the main concept of lower and upper approximations in rough set theory as found in [7].Analysis by lower and upper approximations: Rough set theory analysis is based on two approximations such as upper and lower approximations. Lower approximation is the union of elements, possibly belonging to a concept (set) with respect to R. They are seen to be definitely belong to the set and it can be denoted by the right hand side of the following equation:
:
x U
R x
R x
R x
X
(1)Upper approximation is the union of elements partially and possibly belonging to a concept(set) based on relation R. i.e., the elements are roughly in the set.
:
x U
R
x
R x
R x
X
(2)The third set called ‘Boundary set’ is the set of all objects that can be neither in the interior of X and nor in the negation of X based on R i.e, the set with the boundary region can be realized as the difference between the lower approximation and upper approximation as written as follows [8]:
R
RN
x
R
x
R x
(3)III. TOOLS SELECTION:
A data mining activity can be tackled by two different approaches. Firstly, by constructing the input output mapping by various learning models (or classifiers) referred as ‘supervised learning’ or without any learning models but merely by clustering through similarity measures. Sometimes it’s measured as ‘unsupervised learning’.
Secondly, by rough set approximations. These two different approaches made the authors to go for two different tools based on the orientation of each approach.
ROSE 2 TOOL
Fundamental concepts of Rough Set Theory are realized with the ROSE mining tool. The basic components for implementing data analysis are identified into five groups [9]. Firstly, for the preliminary data transformation, discretization, and analysis, the preprocessing methods are grouped. Secondly the ‘Reducts’ component takes care the reduction of attributes which is the main advantage of ROSE tool. Thirdly the ‘Rules’ component generates decision rules. Fourthly the validation with evaluating the rules is taken care and finally the fifth component is to achieve the minimal redundancy based on similarity relations. Apart from these we have an independent component for accommodating approximations for rough sets. An entropy-based method is used to discretize the attributes in the source information table. One can tune the value of entropy in the range (0,1) as desired, also fix the maximum number of intervals in order to restrict the unnecessary creation of intervals more than needed.
WEKA TOOL
One of the primary academic and research mining tool is given by the WEKA ("waikato environment for Knowledge Analysis ") analysis and mining tool. There are many features for filtering the data
(cleansing, normalizing and reducing),
classifying, clustering and visualizing. The main metrics for evaluating the performance of the classifiers are like accuracy, precision, recall and ROC (Receiver Operator Characteristics) [10, 11]. This tool is compatible with Java APIs as it is implemented in Java language. The methods in Weka includes decision trees (J48, Random Forest, etc) , decision rules (JRIP, ZeroR, etc), Bayes (Naïve Bayes, etc), Function (Multi-perceptron, Support Vector Machines) based on conventional machine learning algorithms. The validation part includes cross validation with prescribed number of folders (default value being 10). Then the classification accuracy is either generated from the confusion matrix for measuring the accuracy or by the ratio between correctly classified instances to total number of instances. There are several other metrics [10,11].
IV. DATA DESCRIPTION
The dataset used in this work is downloaded from OU-VLE, i.e., ‘Open University Virtual learning Environment’ This environment has records on mainly the courses and its contents, corresponding course takers, locations from which the courses are opted and finally the assessment details [2,3,4]. For example, around July 2013 the session on social science got enrollment 384 students. There are three types of data derived mainly: demographic information, assessment performance and the frequency of clicks for the activities. Other behavioral attributes belong to student activity types set: { dataplus, oucollaborate, glossary, forumng, oucontent, resources, subpage, homepage, URL,# VLE activities for course assessment }. These attributes also describe the involvement of students in
the assessments for
International Journal of Innovative Technology and Exploring Engineering (IJITEE) ISSN: 2278-3075, Volume-8, Issue-10, August 2019
Published By: augument by log file with the time stamps of every activity
with sum of clicks made by students.
[image:3.595.63.276.84.233.2]V. EXPERIMENTAL SETUP
Figure 1: Framework for the experimental Setup
The framework shown in the figure 1. shows the complete steps applied in our proposed method. In the first step the log data downloaded from e-learning portal and the data attributes are shown in table 1 and table 2. We concurrently apply two distinct tools, namely Weka and Rose to search the relevant or high significant attributes. Some attributes are straight away eliminated by looking at their data distribution types like the presence of a lot of missing values, or with non-significant data like identifiers/keys. Since this searching is performed in higher dimensional space the computational complexity is intensive. We apply searching methods while implementing in WEKA like greedy search, best first search, genetic search as well the ranking methods based on the measures referred as ‘information gain’ or ‘gain ratio’ to prioritize the attributes so that top few attributes can be selected based on their ranks and cut off threshold accuracy. In the ROSE tool context, we apply the data preprocessed under local discretization without additional stopping conditions. The approximation viewer gave an accuracy percentage of lower and upper approximations of each class with quality of classification 0.97.The Quality of classification is determined by the reduction method applied over conditional attributes mapped onto core attributes. The subset of core attributes includes :A1 (dataplus), A2
(forumng) and A9(home page) extracted from the e-learning
dataset .In ROSE system we are able to do the classification test using any of the available methods for rule generation. For that we selected Minimalcoveringvalidationmethod from the Classification group. ROSE system applies lattice measure for its classifier, which has several parameters/methods like Lattice search, Indiscernibility matrix and Heuristic search. Getting the output in rules format for any data analysis is standardized. This is very much based on Minimal covering (LEM2) algorithm from the Rules component in ROSE [12]. LEM2 is successfully implementing the rough set theory and it uses 10-fold cross validation based on random partition of input source file. Hence the ratio of training and testing set happens to be
[image:3.595.300.554.162.643.2]always 9:1 in all iterations. We finally obtain the results with majority threshold and minimum similarity tuned as 21% and 50% respectively. The results are tabulated in table 1.
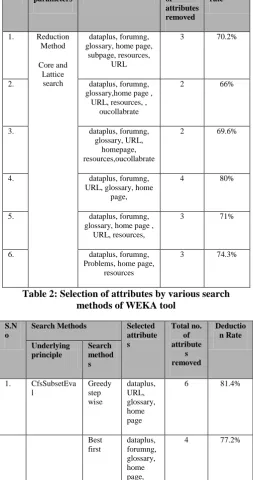
Table 1: Selection Of Attributes By Various Search Methods Of ROSE Tool
S.no Method of
parameters
Selected attributes Total no.
of attributes removed
Deduction rate
1. Reduction Method
Core and Lattice
search
dataplus, forumng, glossary, home page,
subpage, resources, URL
3 70.2%
2. dataplus, forumng, glossary,home page ,
URL, resources, , oucollabrate
2 66%
3. dataplus, forumng, glossary, URL,
homepage, resources,oucollabrate
2 69.6%
4. dataplus, forumng, URL, glossary, home
page,
4 80%
5. dataplus, forumng, glossary, home page ,
URL, resources,
3 71%
6. dataplus, forumng, Problems, home page,
resources
3 74.3%
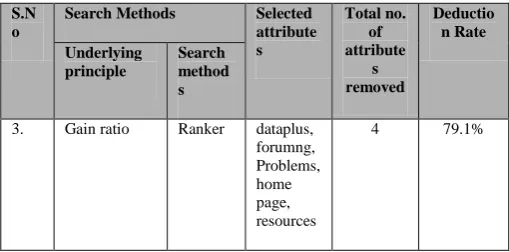
Table 2: Selection of attributes by various search methods of WEKA tool
S.N o
Search Methods Selected
attribute s
Total no. of attribute
s removed
Deductio n Rate Underlying
principle
Search method s
1. CfsSubsetEva l
Greedy step wise
dataplus, URL, glossary, home page
6 81.4%
Best first
dataplus, forumng, glossary, home page, URL, resources
4 77.2%
2. Info gain Ranker dataplus, forumng, glossary, home page, sub page, resources, URL
[image:3.595.298.554.420.815.2]S.N o
Search Methods Selected
attribute s
Total no. of attribute
s removed
Deductio n Rate Underlying
principle
Search method s
3. Gain ratio Ranker dataplus, forumng, Problems, home page, resources
4 79.1%
[image:4.595.41.296.49.175.2]Table 2 clearly shows the reduced list of attributes and the corresponding detection rates after successful application of search methods either directly by subset evaluation procedures greedy stepwise search, best first search or indirectly by ranker methods based on information gain and gain ratio. These searching results are further evaluated by restricting the classifications within the reduced attributes and for this purpose we selected Bayes theorem based Naïve Bayes method, tree based decision tree methods like J48, Random Forest and rule based decision rules generating methods like JRIP and ZeroR [13]. The accuracy results are shown in figure 2.
Figure 2: Performance comparisons of various reductions on lattice search methods
Figure 3: Performance Comparison of various search methods on classifiers JRip and J48.
The percentage of predicted accuracy of the selected attributes which are generated by ROSE and Weka tool are presented in the charts (Fig 2 and Fig3) for the comparable purpose.
VI. RESULTS AND DISCUSSION
Figure 1 and Figure 2 shows the final results for the same dataset for e-learning students’ engagement data for predicting the student performance using minimal number of attributes. The job of finding this minimum number, we employ more than one tool and more than one concept. The tools as mentioned previously the rough set based tool ROSE and mining tool WEKA. Comparing the performance
in such unique combination is of its first kind and further research can be geared in two ways: carrying out similar studies for data sets present in other domains and characterizing with the limitations of rough sets or that of data mining for reduction of attributes.
VII. CONCLUSIONS
In this paper, we have dealt with various searching methods by using two different implementations with trees to rules models. The experimental results presented here demonstrates the underlying dataset is having patterns represented by the rule models in both the frameworks of rough set theory and machine learning , demonstrating similar and appreciable strength produced by algorithms in spite of their orthogonal and independent theory basis. This direction of research can further be extended to big data are distributed over cloud storage with different regional or geographical data mapped onto these algorithms for reduction as well the accuracy increment.
REFERENCES:
1. “Computational Methods of Feature Selection” edited by Huan Liu, Hiroshi Motoda.
2. N. Holmes, “Engaging with assessment: increasing student engagement through continuous assessment,” Active Learning in Higher Education, vol. 19, no. 1, pp. 23–34, 2018.
3. F. Blin and M. Munro, “Why hasn’t technology disrupted academics’ teaching practices? Understanding resistance tochange through the lens of activity theory,” Computers &Education, vol. 50, no. 2, pp. 475–490, 2008.
4. J. Kuzilek, M. Hlosta, D. Herrmannova, Z. Zdrahal, andA. Wolff, “OU analyse: analysing at-risk students at the OpenUniversity,” in Proceedings of First International Workshop onVisual Aspects of Learning Analytics and Knowledge Conference(LAK 2015), pp. 1– 16, Poughkeepsie, NY, USA, March2015.
5. Dataset: (https://analyse.kmi.open.ac.uk/open_dataset)
6. J. Kuzilek, M. Hlosta, and Z. Zdrahal, “Open university learning analytics dataset,” Scientific Data, vol. 4, article170171, 2017. 7. Pawlak, Z., Rough sets, J. Comput. Information Sciences, vol.11,
pp.341-345, 1982.
8. Z. Pawlak, Rough Sets – Theoretical Aspects of Reasoning about Data. Boston, London, Dordrecht: Kluwer, 1991.
9. ROSE Software <http://idss.cs.put.poznan.pl/site/rose.html>
10.Available from:
http://weka.sourceforge.net/doc.dev/weka/attributeSelection.
11.Available from: https://www.cs.waikato.ac.nz/ml/weka/
12.Grzymala-Busse, J.W. &Stefanowski, J., (2001), Three Discretization Methods for Rule Induction. International Journal of Intelligent Systems, 16, 29-38.
13.Y. Bengio and Y. Grandvalet, "No Unbiased Estimator of the Variance of K-Fold Cross-Validation," Journal of Machine Learning Research, vol. 5, pp.1089–1105, 2004.
14.C.S.Sasikumar, A.Kumaravel, Design of Cost Sensitive Classifiers for E-Learning Datasets tuning with cost ratio, International Journal of Engineering & Technology, 7 (4.39) (2018) 980-984.
15.C.S.Sasikumar, A.Kumaravel, Yet another Approach for Construction of Cost Sensitive Classifiers for E-Learning Datasets, International Journal of Engineering & Technology, 7 (4.39) (2018)1047-1052. 16.C.S.Sasikumar, A.Kumaravel, Attribute Selection on Student
Academic and Social Attributes Based on Randomized And Synthetic Dataset, International Journal of Engineering & Technology, 7 (4.39) (2018), 1069-107.
17.H. M. Harb and M. A. Moustafa, "Selecting optimal subset of features for student performance model," Int J Comput Sci, p. 5, 2012. 18.M. Doshi, "Correlation Based Feature Selection (Cfs) Technique To
Predict Student Perfromance," International Journal of Computer Networks &
[image:4.595.55.285.324.393.2] [image:4.595.48.281.417.592.2]International Journal of Innovative Technology and Exploring Engineering (IJITEE) ISSN: 2278-3075, Volume-8, Issue-10, August 2019
Published By: 19.W. Punlumjeak and N. Rachburee, "A comparative study of feature
selection techniques for classify student performance," in Information Technology and Electrical Engineering (ICITEE), 2015 7th International Conference on, 2015, pp. 425-429.
20.D. Koller and M. Sahami, "Toward optimal feature selection," Stanford InfoLab1996.
21.P. Mitra, C. Murthy, and S. K. Pal, "Unsupervised feature selection using feature similarity," IEEE transactions on pattern analysis and machine intelligence, vol. 24, pp. 301-312, 2002.
22.E. Osmanbegović, M. Suljić, and H. Agić, "DETERMINING DOMINANT FACTOR FOR STUDENTS PERFORMANCE PREDICTION BY USING DATA MINING CLASSIFICATION ALGORITHMS," Tranzicija, vol. 16, pp. 147-158, 2015.
23.A. M. Shahiri and W. Husain, "A review on predicting student's performance using data mining techniques," Procedia Computer Science, vol. 72, pp. 414-422, 2015.
24.C. Romero and S. Ventura, "Educational data mining: a review of the state of the art," IEEE Transactions on Systems, Man, and Cybernetics, Part C (Applications and Reviews), vol. 40, pp. 601-618, 2010.
25.M. Ramaswami and R. Bhaskaran, "A study on feature selection techniques in educational data mining," arXiv preprint arXiv:0912.3924, 2009.
26.A. Mueen, B. Zafar, and U. Manzoor, "Modeling and Predicting Students' Academic Performance Using Data Mining Techniques," International Journal of Modern Education and Computer Science, vol. 8, p. 36, 2016.
AUTHORS PROFILE
C.S.Sasikumar, having around 27 years of experience in computer application technology and also I am a Research Scholar in Bharath Institute of Higher education and Research, Chennai. My research interest includes Soft Computing, Cloud Computing, Machine Learning, Pervasive Computing, Mobile application development and Enterprise application development
.