Abstract: The liquid level control in conical tank is tough task owing to variable cross-sectional area. The replica of the conical tank is recognized using standard step test technique and is approximated to be FOPTD model. In this paper, PSO based LQR-PI controller has been wished-for conical tank system. The PI controller gains are formulated as the optimal state-feedback gains. A PSO has been accustomed optimally to discover the
weighting matrices, related to the various optimum state-
feedback regulator design whereas minimizing ISE and the controller effort. The performance of the proposed PSO based LQR-PI controller is contrasted with those of GA-LQR-PI and LQR-PI controllers.
Keywords:Conical tank, LQR, PI controller, PSO.
I. INTRODUCTION
C
hemical process industries meet the concept of fluid level and flow control for the preferred manufacturing rates [1-2]. They presented the impact of various control act in the lead of course of action. Ganesh Ram and Abraham Lincon [3] planned the Fuzzy Adaptive Proportional-integral Controller for the nonlinear conical tank process, in which the Fuzzy Adaptive Proportional-integral Controller’s performance is compared with that of the Conventional PI Controller. Fareeza et al, [4] established the plan of a plant estimator model, using the Fuzzy Logic Controller (FLC) for the conical tank process, in which the servo operation performance is compared with regulatory function. GiriRajkumar et al, [5] projected the real time application of the Ant Colony optimizing algorithm, and implemented it for the conical tank process, in which the concert of the Internal Model Controller (IMC) is evaluated with that of the ant optimization colony algorithm through the performance error criteria. Bhaba et al, [6] widened the real time implementation of a new Coefficient of Discharge Method for the Proportional Integral (CDM-PI) Control format for a conical tank liquid level maintenance. The servo tracking act for different height changes for error criteria such as, Integral Square Error (ISE), Integral Absolute Error (IAE) as well as time domain specification criteria is investigated. The disadvantages of PI, IMC and other control strategies, necessitates the use of optimal control policy such as LQR.Revised Manuscript Received on September 03, 2019
Ka. Suriyaprabha*, Department of Instrumentation and Control Engineering, A.V.C. College of Engineering, Mayiladuthurai, TamilNadu, India - 609 305. E-mail: [email protected]
Dr. D.Rathikarani, Department of Electronics and Instrumentation Engineering, Annamalai University, Annamalai Nagar, TamilNadu, India – 608 002. E-mail: [email protected]
Arrangement of the limitless skyline LQR control issue for vast dimensional (lumped parameter) frameworks includes illuminating an arithmetical MRE. Moghadam and Amir Alizadeh [7], planned a boundless dimensional LQR based structure for a nonlinear process. However, selection of rho and R in the design of LQR is not reported. In this work, PSO-LQR-PI is proposed for a conical tank system. The parameters rho and R of LQR-PI are optimized using PSO and GA methods. The performance of the proposed control strategy is compared with those of other control approach like GA-LQR-PI and LQR-PI.
II. PROCESSDESCRIPTIONAND
MATHEMATICALMODELINGOFCONICALTANK
LEVELPROCESS
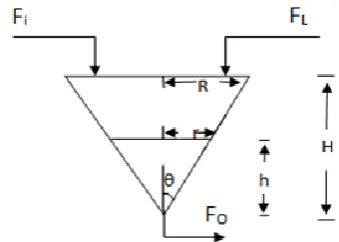
The proposed control action whose tank region is fluctuates all through the working extent. The geometric imitation of the system is controlled by keeping H as PV and Fin as MV. Figure 1 shows the sketch of the arrangement.
[image:1.595.329.499.403.524.2]Fig. 1. Schematic diagram of a conical tank level process. Table-I: Specifications of conical tank
Parameter Value
R Top Radius of conical tank 16.75 cm
H Total Height of the conical tank 65 cm
b Valve coefficient 0.5
Fi Inlet flow rate to the tank 0-10 (m3/min)
Fi - Inlet flow rate to the tank (m3/min) Fo - Inlet flow rate from the tank (m3/min) FL- Load applied to the tank (m3/min) H - Total Height of the conical tank (m)
h - Height of the liquid level in the tank at any time (m) r - Radius of the conical tank at any particular level (cm) A - Area of the conical tank at the top (cm2)
b - Valve coefficient
LQR Based Optimal Tuning of PI Controller for
a Conical Tank Level Process
The obtained differential equation of conical tank process is
given by
(1)
Taking Laplace transform of equation (1) (2)
Where Taking Laplace transform of equation (2) = (3)
where, The process parameters of conical tank level process are obtained by applying step variation in Fin. The entire operating height of conical tank is divided into four regions. The obtained process parameters are presented below. (4)
(5)
(6)
(7)
The worst case transfer function is obtained from equation (4), (5), (6) and (7) (8)
Time delay in equation (8) is converted into transfer function using pade approximation method. The obtained model is given as (9)
The overall model of the system is given as (10)
III. DESIGNOFLQR-PIANDITS IMPLEMENTATION LQR is a part of optimal control policy which has been extensively developed and utilized in a variety of applications. LQR design is based on the choice of feedback gains K such that J is minimized. This makes sure that the gain choice is optimal for the cost function. The structure of optimal control frameworks is an essential capacity of control theory. The reason for configuration is to understand a framework with down to earth parts that will give the ideal working execution. The execution of a control framework can be spoken to by integral performance measures, the plan of a framework depends on limiting performance index. Processes that are changed in accordance with give least execution list are regularly called ideal control framework. LQR is a piece of ideal control procedure which has been generally created and utilized in different applications. LQR configuration depends on the choice of criticism picks up K to such an extent that the cost work J is limited. This guarantees the gain choice is ideal for the cost work determined. A continuous system is expressed in a form of (11)
A state variable feedback control is given by
)
(
)
(
t
Kx
t
u
(12)The performance index (PI ) is defined as (13)
where, Q is Real symmetric positive-definite or semi-definite matrix. The feedback control function can be written as K=R-1BTP (14) (14)
and it will result in
0
1
Q
P
B
PBR
PA
P
A
T T (15)Equation (15) is known as the Matrix Riccati equation and it can be solved for the auxiliary matrix P. P matrix in equation (15) can be expressed as (16)
Substitute the values of R, B and P in equation (14), the Feedback gain matrix K is given in equation (17) (17)
The equation of PI controller is presented in equation (18) (18)
Equation (12) can be expressed as (19)
(20)
For the design of LQR, the worst-case transfer function model is considered and it is converted into state space model. The obtained state space model is given in equation (21) and (22) (21)
(22)
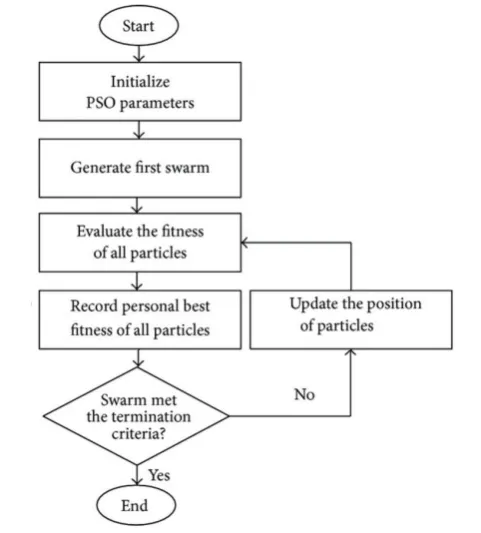
A. Particle Swarm Optimization (PSO)Algorithm PSO is a population based stochastic optimization technique developed by Dr. Eberhart and Dr. Kennedy in 1995. The flow chart of PSO algorithm is presented in Figure 2. The projected position of ith particle of the swarm xi, is given below 1 t i t i 1 t i
x
v
x
(23)The velocity of this particle vi at (t+1)th iteration is given below
)
x
g
(
r
c
)
x
P
(
r
c
v
v
ti t i 2 2 t i t i 1 1 t i 1 t i
(24)
0
Fig. 2. Flow diagram of PSO algorithm B. Parameters used for PSO algorithm
[image:3.595.310.544.73.836.2]The following parameter values are set by repeated simulation study.
Table -II: Specifications of conical tank.
Parameter Value
Observation time (Tob) 38 Sec
Step size of the simulation (Hs) 0.001 Sec
Average generations 250
Number of particles 17
Range of λ and δ 0 to 2
C1 and C2 2
C. Comparison using Genetic algorithm
Genetic algorithm have population, fitness and fittest values to generate the best PI standards. When Simulation is in progress it build definite population to locate the best rate. Moreover it makes an assessment at objective function which is stored in MATLAB program. Opt for the fittest from the iterations when it gets concluded and it is supposed to be the best PI standard. Just the once the best value is preferred, the series gets ended. In the commencement a primary chromosome is randomly created. The chromosomes are aspirant result to the problem. Then, the fitness values of all chromosomes are estimated by computing the objective function in decoded form. So, based on the fitness of every entity, a collection of the best chromosomes is preferred through the selection procedure. The Genetic operators, crossover and mutation are functional to this existing population in order to get better next generation outcome. The process prolong awaiting the population congregate to the global maximum or another stopping norm is attained.
IV. SIMULATIONRESULTSANDDISCUSSION
The simulated servo responses for step change in set point of level from 35 to 45 cm, 45 to 50 cm and 50 to 55 cm as shown in Figure 3. Initially, the level is maintained at 35 cm and then the step change with magnitude of 5 cm is applied. It is observed that controllers take necessary action to alter the
tank. Also, the corresponding changes in manipulated variable are shown in Figure 4.
0 100 200 300 400 500 600 700 800 900 1000 35
40 45 50 55 60
Time (sampling instants)
L
e
v
e
l
(c
m
) Setpoint
[image:3.595.324.525.92.219.2]LQRPI GA-LQRPI PSO-LQRPI
Fig. 3. Servo tracking with LQR-PI, PSO-LQR-PI and GA-LQR-PI
0 100 200 300 400 500 600 700 800 900 1000 2
3 4 5 6 7 8
Time (sampling instants)
In
fl
o
w
r
a
te
(
m
3/s
e
c
)
LQRPI GA-LQRPI PSO-LQRPI
Fig. 4. Controller output for servo tracking
300 350 400 450 500 550
44 45 46 47 48 49 50 51 52
Time (sampling instants)
L
e
v
e
l
(c
m
) Setpoint
[image:3.595.52.284.375.454.2]LQRPI GA-LQRPI PSO-LQRPI
Fig. 5. Servo tracking with LQR-PI, PSO-LQRPI and GA-LQR-PI
300 350 400 450 500 550 2
3 4 5 6 7 8 2 3
Time (sampling instants)
In
fl
o
w
r
a
te
(
m
3/s
e
c
)
[image:3.595.316.548.522.831.2]Table-III: Performance measure for servo response of conical tank level process
ISE IAE
Controlle r
∆SP ∆SP
35- 45 45-50 50-55 35-45 45-50 50-55
LQR-
850.3 311.9 380.8 248.6 171.1 205.6 PI
GA-
730.5 269.1 325.4 214.9 148.7 179.2 LQR-PI
PSO-
LQR-PI 184.6 67.2 82.5 63.16 49.94 59.2
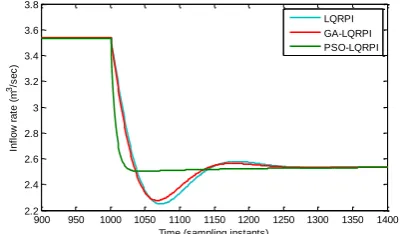
The regulatory responses of conical tank level process obtained by increase in inflow rate of 30% applied at 1000th second for the operating points 40 cm and 50 cm. Due to increase in inflow rate of 30% at the operating point the level of the conical tank is increased from nominal value as seen from Figure 6 and 8. LQR-PI, GA-LQR-PI and PSO-LQR-PI controllers takes the necessary action and bring back the level into nominal operating point. Also the manipulate variable are shown in Figure 7 and 9.
900 950 1000 1050 1100 1150 1200 1250 1300 1350 1400 39.9
39.95 40 40.05
Time (sampling instants)
L
e
v
e
l
(c
m
)
[image:4.595.51.290.69.199.2]Setpoint LQRPI GA-LQRPI PSO-LQRPI
Fig. 6. Regulatory response of conical tank level process at the operating point of 40.
900 950 1000 1050 1100 1150 1200 1250 1300 1350 1400 1.8
2 2.2 2.4 2.6 2.8 3 3.2
Time (sampling instants)
In
fl
o
w
r
a
te
(
m
3/s
e
c
)
LQRPI GA-LQRPI PSO-LQRPI
Fig. 7. Controller output for regulatory response of conical tank level process at the operating point of 40
900 950 1000 1050 1100 1150 1200 1250 1300 1350 1400 49.9
49.95 50 50.05 50.1 50.15 50.2
Time (sampling instants)
L
e
v
e
l
(c
m
)
Setpoint LQRPI GA-LQRPI PSO-LQRPI
Fig. 8. Regulatory response of conical tank level process at the operating point of 50
900 950 1000 1050 1100 1150 1200 1250 1300 1350 1400 2.2
2.4 2.6 2.8 3 3.2 3.4 3.6 3.8
Time (sampling instants)
In
fl
o
w
r
a
te
(
m
3/s
e
c
)
LQRPI GA-LQRPI PSO-LQRPI
[image:4.595.313.541.264.380.2]Fig. 9. Controller output for regulatory response of conical tank level process at the operating point of 50 The performances of all control strategies are tabulated in Table 2. From the performances it is observed that PSO based LQR-PI produces better result with those of GA based LQR-PI and LQR-PI controllers.
Table-IV: Performance measure for regulatory response of conical tank level process
ISE IAE Controller Operating point (cm) Operating point (cm)
40 50 40 50
LQR-PI 0.586 0.659 2.22 2.36
GA-LQRPI 0.563 0.627 2.13 2.32
PSO-LQRPI 0.424 0.456 2.04 2.14
V. CONCLUSIONS
In this paper, PSO based LQR-PI controller is proposed and implemented for a conical tank level process. The response curve for various operating stage of the system thus obtained using PSO based LQR-PI is compared with response obtained by other control strategies like GA based LQR-PI and LQR-PI. For servo and regulatory responses, the proposed controller gives minimum ISE and IAE than other control strategies. Comparing the performance of the obtained responses, PSO based LQR-PI performs well and it can be used for nonlinear time varying processes.
REFERENCES
1. Astrom, K. J. and Hagglund, T, “The future of PID control. Control
Engineering Practice”, Vol.9(11), pp.1163-1175, 2001.
2. Astrom, K. J. and Hagglund, T, “Revisiting the Ziegler–Nichols Step Response Method for PID Control”, Journal of Process Control, Vol14(6), pp.635-650, 2004.
3. A. Ganesh Ram, S. Abraham Lincoln, “A model reference-based fuzzy adaptive PI controller for non-linear level process system’, International Journal of Research and Reviews in Applied Sciences, 4(2): 477–486, 2013.
4. Fareeza, F. and Murthy, B. R, “Design of Plant Estimator Model using Fuzzy Logic”, European Journal of Scientific Research, Vol.74(1), pp.48-60, 2012.
5. Giri Rajkumar, S.M., Ramkumar, K. and Sanjay, S.O.V, “Real Time Application of Ants Colony Optimization’, International Journal of Computer Applications, Vol.3(8), pp.0975-8887, 2010.
6. Bhaba, P. K., Sathishbabu, S., Asokan, A. and Karunanithi, T, “Real time Implementation of Wiener Model PI (WMPI) Controller in a Conical Tank Liquid Level Process”, Journal of Applied sciences, Vol.7, pp.2194-2197, 2007.
[image:4.595.50.277.309.612.2] [image:4.595.52.250.322.434.2]AUTHORSPROFILE
Ka. Suriyaprabha, M.E., is currently serving as Assistant Professor in the Department of Instrumentation & Control Engineering, A. V. C. College of Engineering, Mayiladuthurai. She is pursuing her research under the guidance of Dr. D. Rathikarani in the area of advanced process control at Annamalai University. She has more than 13 years of teaching experience. 23 B.E candidates have completed their project work under her supervision. Her area of specialization are Process Control, Digital Control system, Modern Control system, Instrumentation System Design and Transducers Engineering.
Dr. D. Rathikarani, M.E., Ph.D., is currently serving as Professor in the Department of Electronics & Instrumentation Engineering, Annamalai University, Annamalai Nagar. She has more than 26 years of teaching experience. She is supervising 3 Research scholars presently and 14 M.E candidates have completed their project work previously. She has contributed research articles in 12 international and 1 national journals and 10 international and 17 national conferences. Her area of specialization are Adaptive Control, System Identification, Industrial Instrumentation, Transducers and Measurement System and Process Control.