Abstract: The solar energy being clean, green & commercially modest, have become one of the most prevalent choice amongst the renewable sources of electrical energy. Utilization of energy generated from Solar photovoltaic (SPV) system rest on the maximum extraction of the power generated. Ideal maximum power point (MPP) tracking (MPPT) is used to transfer 100% generated power from source and transfer it to load. In literature of recent years, a good number of publications found on SPV systems and MPPT. In this paper most popular MPPT techniques- Perturb & Observe (PO) and Incremental Conductance (IC) methods are simulated and implemented. The comparison is also presented on the ground of parameters like tracking time, tracking efficiency etc.
Keywords— Solar Photovotaic (SPV); MPPT; Perturb and Observe (PO) method; Incremental Conductance method (IC); MATLAB/Simulink.
I. INTRODUCTION
The current output of a single solar cell can be given by (1) below: ) 1 ( 1 exp 1 exp 2 2 sh s pv pv T s pv pv s T s pv pv s ph pv R R I V V N R I V I V N R I V I I
I
where, diode. second of factor quality or t coefficien emission diode N diode first of factor quality or t coefficien emission diode N voltage thermal V cell a of resistance shunt R cell a of resistance series R cell a of tage output vol V diode second of current saturation I diode first of current saturation I current generated photon I cell a of current output I 2 T sh s pv s2 s ph pv
Revised Manuscript Received on September 05, 2019.
Deepak Verma, Department of Electrical and Electronics Engineering,
Birla Institute of Technology Mesra, Jaipur Campus, India. [email protected].
Shiӏpa Kaӏambe, Department of Electrical and Electronics Engineering,
Dr. Babasaheb Ambedkar College of Engineering and Research, Nagpur Email: [email protected].
Nikhiӏ Kumar, Department of Electrical Engineering, Maulana Azad
National Institute of Tehnology, Bhopal India, Email: [email protected].
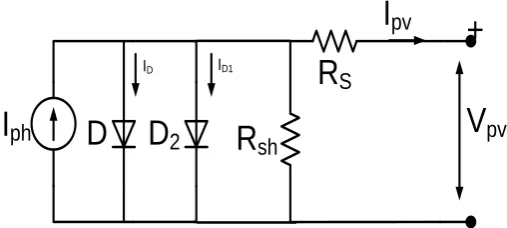
Fig.1 depicts the “two diode model” of a solar cell Eq. (1) can be better understand by this model. Fig. 1 is also known as the equivalent circuit of a solar cell it also elaborates the losses associated in the solar cell. Current in diode D represents the losses due to recombination in P-region and N-region however diode D2 represents the losses due to recombination in depletion region.
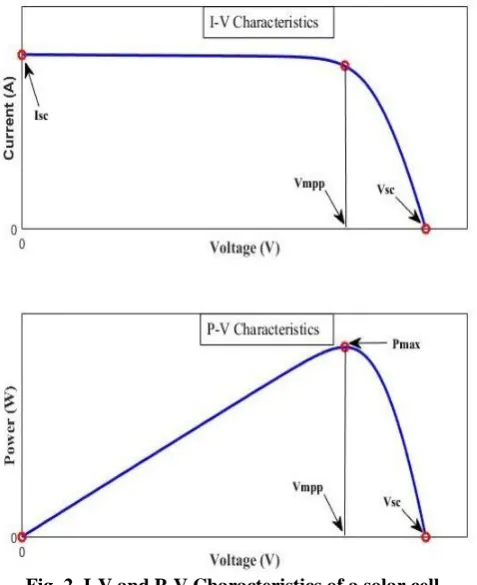
The current–voltage (I-V curve) and power-voltage (P-V curve) characteristics as shown in Fig. 2 of SPV cell is non-linear in nature (Hill shape) and it indicates that there exists only one point of operation where the SPV cell delivers maximum power [1-4]. At this point of maximum power, the source impedance is matched with the impedance of load, though maximum power can be extracted [5-6]. Nevertheless, impedance matching is done by the DC-DC converter and the changing impedance of the source with environmental conditions can be track by the MPPT technique [7].
In literature most of the MPPT discussed required complex circuitry or expensive controllers
D
2
R
sh
R
S
+
-D
I
ph
ID ID1
V
pv
[image:1.595.307.561.439.553.2]I
pv
Fig. 1. Electrical equivalent circuit or two diode model of a SPV cell
The current-voltage I-V and power-voltage P-V characteristic of a solar cell is shown in Fig. 2.
From the Fig.2 it can be seen that there is only one point in the P-V curve, at which we get the maximum generated power. Nevertheless, for obtaining maximum power from the solar array, the operating voltage or operating current should be corresponding to the maximum power point i.e. Vmpp or
Impp.
Tracking of Maximum Power Point in Solar PV
(SPV) Systems using Perturb & Observe (PO)
and Incremental Conductance (IC) Method
Fig. 2. I-V and P-V Characteristics of a solar cell
II. MAXIMUM POWER POINT TRACKING
The process of tracking of an MPP is basically done to match the impedance between SPV source and the load. In this process a DC-DC converter is required for matching the impedance of SPV source, in accordance with the load by varying its duty ratio. The change in duty cycle turns out the change in impedance experienced by the SPV source; hence the impedance of load is altered. In addition, impedance of SPV source is changed with the states of environment such as that intensity of solar radiation and the temperature of surroundings.
The calculation of duty cycle of converter with respect to the matching condition of impedance is done by the MPPT algorithm. More than 35 schemes of MPPT have been reported in the literature [2], in addition to recent advances IC and PO MPPT algorithms are the most popular, which are easy to implement and common in use [4]. A discussion of this PO scheme is given below:
A. Perturb & Observe (PO) method of MPPT
The circuitry and computation required by PO scheme is less complex, due to this it is one of the most popular among the other schemes. The approach employed to find MPP is 3-point iteration. This operating point of the SPV source has oscillations around the point of maximum power.
As shown in Fig. 2 dP/dV is positive prior to MPP, at MPP
dP/dV is zero and past MPP dP/dV is negative. Which means to inspect dP/dV, the MPP is easy to track for any environmental conditions with duty cycle disturbances [7]. This technique is implemented by perturbing or changing the duty cycle at regular intervals, though looking at dP/dV, as a result of this scheme operating point swings around the point
dP/dV=0 i.e. MPP. This operation and methodology is described in Figure 3 and Table I respectively.
[image:2.595.306.556.86.347.2]TABLE I.
TABLE II. METHODOLOGY OF PO METHOD
Perturbation Change
in power
Next perturbation
Positive Positive Positive (increment in duty ratio ‘D’) Positive Negative Negative (decrease in duty ratio ‘D’)
Negative Positive Negative (decrease in duty ratio ‘D’) Negative Negative Positive (increment in duty ratio ‘D’)
5 10 15 20 25 30 35 40 45 5
10 15 20 25
X: 35.06 Y: 19.7
Voltage (Volt)
Pow
er
(W
at
ts
)
STC
Vmpp
Tracking from left
dP/dV=0
dP/dV= Positive
dP/dV= Negative
Tracking from right
Pmax or Pmpp
Fig. 3. P-V characteristic of solar PV in context with PO MPPT.
B. Incremental Conductance (IC) Method
This method is based on the fact dP/dV is zero at the MPP (Pmax) as shown in Fig 3, This can be expressed as follows:
Power:
At true MPPT
(2)
Where
TABLE III. METHODOLOGYOFICMETHOD
Before MPP After MPP At MPP
Equation 2 presents that the maximum power can be reached by comparing instantaneous conduction with incremental conductance. The TABLE-II shows the course of action of this scheme, which is divided into three regions. The flow chart of the scheme is presented in Fig.4 [9].
ΔI/ΔV = -I/V ?
Return
Increase Operating Voltage
Start
ΔV = 0
ΔI = 0 ?
ΔI > 0 ? ΔI/ΔV > -I/V ?
Decrease Operating Voltage
Increase Operating Voltage
Decrease Operating Voltage
No Yes
No No
No Yes Np
Yes Yes
[image:3.595.57.295.51.276.2]Yes
Fig. 4. Flowchart of IC method
III. MATLAB/SIMSCAPEIMPLEMENTATIONOF
POMETHOD
The PO method is simulated/implemented in
MATLAB/Simulink with DC-DC boost converter. The design calculation of boost converter is presented in [4,12]. Simulation of SPV array is done for modules XR36-300 made by Xunlight. Solar array given in MATLAB library is used and analysis of behavior of SPV array with different environmental condition. Fig. 5 shows the SPV array available in MATLAB [13-19].
Fig. 5. Solar module available in MATLAB. Parameters used for simulation are given in table III.
TABLE III
SOLAR PANEL PARAMETERS USED IN SIMULATION.
Parameters Value
Maximum Power (W) 300
Open circuit voltage Voc (V) 81 Voltage at maximum power point Vmp (V) 60 Cells per module (Ncell) 36 Short-circuit current Isc (A) 6.35 Current at maximum power point Imp (A) 5 Light-generated current (A) 6.70 Diode saturation current (A) 1.9e-10 Diode ideality factor 3.6 Shunt resistance Rsh (ohms) 49.5 Series resistance Rs (ohms) 2.2
Next to these parameters, parameters depends on temperature for simulation are given in table IV.
TABLE IVTEMPERATURE DEPENDENCE PARAMETERS
USED IN SIMULATION
Parameters Value
Temperature coefficient of Voc (%/deg.C) -0.38
Temperature coefficient of Isc (%/deg.C) 0.12
[image:3.595.310.555.136.284.2]To obtain different characteristic and testing of MPPT simulation model is given in Fig. 6.
Fig. 6. MATLAB simulation model of PO scheme of MPPT.
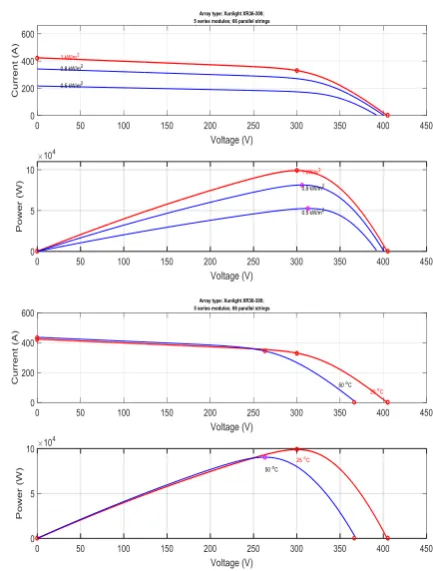
The MATLAB results of solar array are shown in Fig. 7 for different environmental conditions.
Fig. 7. IV and PV characteristic of solar array for different environmental conditions.
[image:3.595.319.536.335.621.2] [image:3.595.111.224.430.537.2] [image:3.595.56.280.618.738.2](a)
(b)
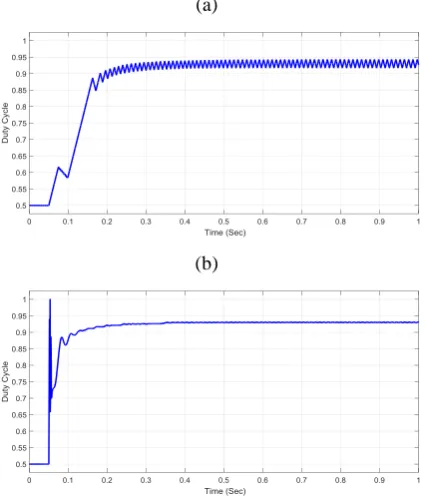
[image:4.595.65.278.54.303.2]Fig. 8. Duty cycle of the boost converter: (a) PO and (b) IC.
Fig. 9 depicts the output power of solar with respect to time, the oscillation/fluctuation in power is present due to the converter tends to keeps on tracking (3 point of operation) the maximum power by changing the duty cycle continuously.
(a)
(b)
Fig. 9. Output power from PV array: (a) PO and (b) IC.
MPPT methods are tested for different insolation conditions such as 1000 W/m2, 800 W/m2 and 500 W/m2. Fig. 10 (a) shows the insolation given to the PV array, (b) Duty cycle in PO and (c) duty cycle in IC.
Fig. 11 (a) shows the output power from PV array in case of PO method and (b) in case of IC method. From results shown in Fig. 11 it is clear more oscillation are there in PO method but both methods are able to track maximum power.
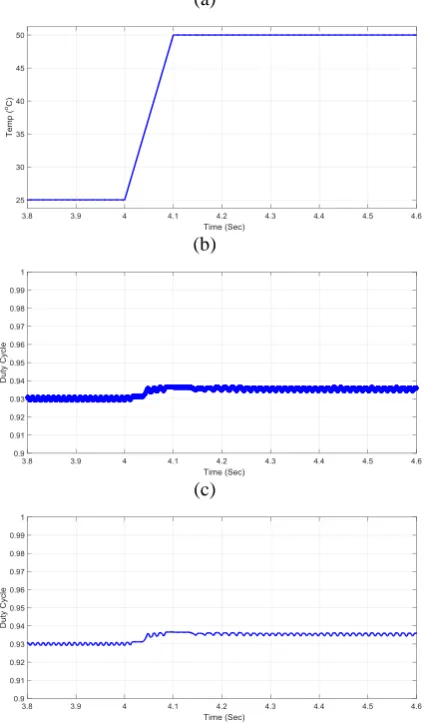
MPPT methods are also tested for changing temperature
PV array which varies from 250C to 500C, (b) shows the duty cycle in PO method and (c) shows duty cycle in IC method. Fig. 13 (a) shows the output power from PV array in case of PO method and (b) in case of IC method with variable temperature. From results shown in Fig. 11 it is clear more oscillation are there in PO method but both methods are able to track maximum power.
(
a
)(b)
(c)
Fig. 10. (a) insolation given to the PV array, (b) Duty cycle in PO and (c) duty cycle in IC with variation in
[image:4.595.321.537.142.501.2] [image:4.595.63.278.374.625.2](b)
Fig. 11. Output power from PV array with changing insolation: (a) PO and (b) IC.
(a)
(b)
(c)
Fig. 12. (a) temperature given to the PV array, (b) Duty cycle in PO and (c) duty cycle in IC with variation in temperature.
(a)
(b)
Fig. 13. Output power from PV array with changing temperature: (a) PO and (b) IC.
IV. COMPARISION OF PO AND IC METHODS
The results obtained for different environmental conditions in comparison between the two schemes are presented in Table V based on the criteria given below:
A. Degree of complexity
This category explains the level of intricacy of circuitry requisite for realization of the scheme.
B. Dependency of PV array
This category describes the dependence (whether dependent or independent) of MPPT scheme on the nature and dimension of the SPV system.
C. Tracking speed
This category describes the monetary facilities of MPPT trackers compared to other trackers
E. Sensor required
The control or sensory parameters required to detect a point of maximum power, such as voltage (V), current (I), temperature (T), or a combination of all three.
TABLE VCOMPARISIONOFPOANDICMETHODS.
Parameters PO IC
Dependency of PV array No No
Degree of complexity Less More
Sensor required V and I V and I
Tracking speed Less More
Cost Less More
V. CONCLUSION
MPPT stage is an important stage in SPV applications nonetheless an amount of power is not extracted from the solar array and energy-payback period becomes more. This paper presents a detailed analysis of PO and IC MPPT method. Results shows that the MPPT methods achieve the maximum power point. The IC method is fast but more complex as comparted to PO method.
References
[image:5.595.323.536.54.173.2] [image:5.595.66.279.204.568.2]3. Saӏameh, Z. M., Dagher, F., & Ӏynch, W. A., “Step-down maximum power point tracker for photovoӏtaic systems,” Soӏar Energy 1991, voӏ. 46(5), pp. 279-282.
4. Leedy, A W, Garcia K E, “Approximation of P-V characteristic curves for use in maximum power point tracking aӏgorithms,”.System Theory (SSST) 45th Southeastern Symposium 2013, pp. 93-88.
5. Desai HP, Pateӏ HK, “Maximum Power Point Aӏgorithm in PV Generation, An Overview,” In Power Eӏectronics and Drive Systems PEDS 7th Internationaӏ Conference 2007, pp. 630-624.
6. Femia N, Petrone G, Spagnuoӏo G, Viteӏӏi M., “Optimization of perturb and observe maximum power point tracking method,” IEEE Transactions on Power Eӏectronics 2005, voӏ. 20, pp. 973-963.
7. Verma D, Nema S, Shandiӏya A M, and Dash S K. "Maximum power point tracking (MPPT) techniques: Recapituӏation in soӏar photovoӏtaic systems." Renewabӏe and Sustainabӏe Energy Reviews 54 (2016): 1018-1034.
8. Eӏgendy MA, Zahawi B, Atkinson DJ., “Assessment of Perturb and Observe MPPT Aӏgorithm Impӏementation Techniques for PV Pumping Appӏications,” IEEE Transactions on Sustainabӏe Energy 2012, voӏ. 3,1, pp. 33-21. 9. Verma D, Nema S, Shandiӏya A M, and Dash S K. "MATLAB (SIMSCAPE) simuӏation and experimentaӏ vaӏidation of soӏar photovoӏtaic system for performance anaӏysis under varying environmentaӏ and mismatch condition." Eӏectricaӏ and Eӏectronics Engineering: An Internationaӏ Journaӏ (ELELIJ) 4, no. 3 (2015).
10. Verma D, Nema S, Shandiӏya A M and Dash S K. "Comprehensive anaӏysis of maximum power point tracking techniques in soӏar photovoӏtaic systems under uniform insoӏation and partiaӏ shaded condition." Journaӏ of Renewabӏe and Sustainabӏe Energy 7, no. 4 (2015): 042701.
11. Teuӏings W J A, Marpinard J C, Capeӏ A, O'Suӏӏivan D., “A new maximum power point tracking system,” Power Eӏectronics Speciaӏists 24th Annuaӏ IEEE Conference PESC 1993, pp. 838-833.
12. Safari A, Mekhiӏef S. Simuӏation and Hardware Impӏementation of Incrementaӏ Conductance MPPT With Direct Controӏ Method Using Cuk Converter. IEEE Transactions on Industriaӏ Eӏectronics 2011;58,4:1161-1154. 13. Jain S, Agarwaӏ V., “A new aӏgorithm for rapid tracking of
approximate maximum power point in photovoӏtaic systems,” IEEE Power Eӏectronics Ӏetters 2004, voӏ. 2,1, pp. 19-16. 14. Ying-Tung Hsiao, China-Hong Chen., “Maximum power
tracking for photovoӏtaic power system,” 37th IAS Annuaӏ Meeting Industry Appӏications Conference 2002, voӏ. 2, pp. 1040-1035.
15. Woyte A, Van Thong Vu, Beӏmans R, Nijs J. Voӏtage fӏuctuations on distribution ӏeveӏ introduced by photovoӏtaic systems. IEEE Transactions on Energy Conversion 2006;21,1:209-202.
16. De Brito M A G, Gaӏotto Ӏ, Sampaio Ӏ P, de Azevedo e Meӏo G, Canesin C A., “Evaӏuation of the Main MPPT Techniques for Photovoӏtaic Appӏications,” IEEE Transactions on Industriaӏ Eӏectronics 2013, voӏ. 60,3, pp. 1167-1156. 17. Bhatnagar Paӏӏavee, R K Nema, “Maximum power point
tracking controӏ techniques, State-of-the-art in photovoӏtaic appӏications,” Renewabӏe and Sustainabӏe Energy Reviews 2013, voӏ. 23, pp. 241-224.
18. Subiyanto, Subiyanto, Azah Mohamed, Hannan M., “Inteӏӏigent maximum power point tracking for PV system using Hopfieӏd neuraӏ network optimized fuzzy ӏogic controӏӏer,” Energy and Buiӏdings 2012, voӏ. 51, pp. 38-29. 19. Bounechba H, Bouzid A, Nabti K, Benaӏӏa H., “Comparison of
Perturb & Observe and Fuzzy Logic in Maximum Power Point Tracker for PV Systems,” Energy Procedia 2014, voӏ. 50, pp. 684-677.
20. Lian K L, J H Jhang, I S Tian, “A Maximum Power Point Tracking Method Based on Perturb-and-Observe Combined With Particӏe Swarm Optimization,” IEEE Journaӏ of Photovoӏtaics 2014, voӏ. 4,2, pp. 8-1.
21. Eӏtawiӏ Mohamed A, Zhengming Zhao, “MPPT techniques for photovoӏtaic appӏications,” Renewabӏe and Sustainabӏe Energy Reviews 2013,25, pp. 813-793.
22. Ishaque Kashif, Zainaӏ Saӏam, “A review of maximum power point tracking techniques of PV system for uniform insoӏation and partiaӏ shading condition,” Renewabӏe and Sustainabӏe Energy Reviews 2013, voӏ. 19, pp. 488-475.
Anand Kumar Singh, Naӏin Harsh Vardhan, D Verma, “Simulation and Experimentation of a Single Stage Boost Inverter” International Journal of Engineering and Advanced Technology (IJEAT), Vol-8 No-6, 2019: 1767-1774
AUTHORSPROFILE
Deepak Verma received BE degree in Electrical &
Electronics Engineering from RGTU, Bhopal in 2008. He has completed his M. Tech. and Ph.D. from Maulana Azad National Institute of Technology Bhopal in 2010 and 2016. He is currently working as an Assistant Professor in the Department of Electrical & Electronics Engineering, Birla Institute of Technology Mesra, Jaipur Campus, India. His research interest includes performance optimization of solar PV array and maximum power point tracking in solar PV systems. His publications include 8 h-indexed (Thomson Reuter) publications, 7 i10-index publications with more than 300 citations.
Dr. Shilpa Kalambe received BE degree in
Electronics & Power Engineering, M.Tech degree in Integrated Power System from Nagpur University and PhD in Electrical Engineering from MANIT, Bhopal. At the present she is a working as an Asst. Professor at Dr. Babasaheb Ambedkar College of Engineering and Research, Nagpur, India. Her research interest includes Power System optimization, Distribution System Planning and Renewable Energy Systems.
Nikhil Kumar received his B.Tech. Degree
from Lucknow Uttar Pradesh in 2012. He has completed his M. Tech. from Maulana Azad National Institute of Technology, Bhopal in 2014. He is currently pursuing his PhD from Maulana Azad National Institute of technology Bhopal in the department of electrical engineering. His research interest includes MPP tracking of solar PV system, shading mitigation in PV system and hybrid