International Journal of Innovative Technology and Exploring Engineering (IJITEE) ISSN: 2278-3075, Volume-8 Issue-7, May, 2019
Abstract: Software Project Managers are often faced with the dilemma of estimating the cost and duration of new projects and enhancement requests. The software industry is relatively new, and surveys conclude that software size and effort estimation is a challenge and needs research solutions. In the last three decades, research has come up with a substantial amount of analysis and study resulting in a variety of software estimation models. Recently, with the onset of Machine Learning and AI related technologies, numerous models have been evidenced that provides better technical accuracy to the problem of software estimation. At the same time, research still evidences that Estimation based on Expert Judgment remains the most widely used methodology. While estimating smaller units of work as in an enhancement or maintenance project is less error-prone, previous research does not report enough accuracy. The objective of this research is to bring a structure to the EJ methodology and bring in consistency and accuracy to an otherwise human-centered and intuition led approach. We employed a lean and straightforward work break down (WBS) to each of the enhancement requests that were put up to a support team for estimation purposes. We evidence that our approach of employing this work-breakdown can bring in two-fold improvement to the estimation process while using expert judgment. This approach also ensures a stable estimation process as evidenced through experiments using Statistical Process Control techniques. We applied our methodology to one of the projects in an IT organization and collected data from two years of operations. Comparing our results with other previous studies, we were able to reduce the error to 25% of the value of this metric, while more than doubling the accuracy of predictionat PRED(25).
Index Terms: Effort Estimation, Effort Variation, Quality Control Charts, Schedule Estimation, Schedule Variation, Process Maturity Analysis, Software Maintenance Projects, Statistical Process Control
I. INTRODUCTION
Software technologies and development methodologies are changing day by day. There are vast differences in the complexities of the projects, and there is a genuine need for improved methods by which projects can be estimated. Software effort estimation is essential since all downstream activities such as planning, budgeting, team allocation and the actual execution of the project are based on the initial estimate. Magne Jørgensen reports that nearly 67% of the projects fail due to inaccurate estimation[1] Many scholars and industry experts have arrived at a variety of models employing manual, algorithmic and non-algorithmic techniques. The more prominent and recent ones include Expert Judgment, Analogy estimation and recently
Revised Manuscript Received on May 06, 2019
Sreekumar P. Pillai, Research Scholar, School of Management Studies, National Institute of Technology Calicut, Kozhikode, Kerala, India.
Dr. T. Radharamanan, Head of Department, School of Management Studies, NITC, Kozhikode, Kerala, India.
Dr.S.D. Madhukumar, Professor, Dean (SW), Dept. of Computer Science, NITC, Kozhikode, Kerala, India.
estimation using Machine Learning and Deep Learning techniques. However, Expert Judgment is employed in around 40% of the software projects executed. This paper evidences the outcome of an experiment conducted in a real-life software maintenance project where a structured approach in Expert Judgment was employed. In the rest of the paper, section II provides the background of the experiment and relevant studies. This section also highlights the performance metrics that has been used to evaluate the outcome of the experiment. Section III elaborates the experiment and the nature of the project wherein this experiment was conducted and the estimation template that was used to gather data from the team. Section IV describes the methodology and the statistical tools and analysis employed. Section V provides an explanatory review of the data collected and explains the relevance of each parameter, in the context of the experiment. The statistical tests performed along with detail of the Data analysis is elaborated in Section VI. Section VII discusses the results of the study along with the performance metrics, followed by the limitations imposed by the experiment and conclusions, respectively.
II. BACKGROUNDWORK
Although the many modern methodologies defined for Software Estimation, Expert Judgment[2] remains the most widely practiced estimation methodologies [3]. Other scholars have attempted simplified EJ methodologies [4].
A. Expert Judgment
Expert judgment in a software project is based on the expertise of a senior member who has been exposed to the technology and the environment in which a product is developed. However, EJ is often criticized for its lack of accuracy. Despite this, there are specific, compelling reasons for the extensive use of EJ:
1) Quick turnaround in estimating
2) Can be done easily and with the help of an expert 3) Very little other skills required than the requirements 4) Estimation effort is minimal compared to others 5) Estimation effort is relatively inexpensive 6) Simplicity and intuitiveness
EJ is based on one’s experience and is closely related to the context of the expert’s development environment. However, the same rationale becomes counter-productive while evaluating the accuracy and predictability of the estimation process.
An Experiment to Improve Expert Judgment
Software Estimation through Work Breakdown
Structure
The estimation is glued to the local development environment; so, its use cannot be generic. Several reasons have contributed to this: studies consistently report that formal methods in comparison to expert estimation produce more accurate estimates [3]. However, they are hard to understand. EJ is easy to implement since it is flexible regarding the type and format of the information used to produce estimates [5].
A study conducted by Christopher Rush and Rajkumar Roy [6] tried to present the case of EJ. They tried to model the reasons and inferences in the process of EJ and thereby rationalize the process. EJ has been the very first model to evolve and still has acceptance. Brown also recommends Analogy estimation [7].It is widely accepted that a better estimate can be derived using comparisons.
A rigorous EJ based model that gained some acceptance is the Delphi technique but is something that lacks practicality.
B. Work Breakdown Structure
A work breakdown structure (WBS) organizes work into manageable units. The Project Management Body of Knowledge [8] defines the work breakdown structure as a "deliverable-oriented hierarchical decomposition of the work to be executed by the project team." Breaking the work into smaller units makes the activities and the tasks clear to the team employed.
Jørgensen has evidenced that the format of the estimation request has an impact on the estimation itself [9]. There are a few other studies that explored a WBS based approach in estimation [10], [11].
For our experiment, we implemented a straightforward work-breakdown structure to capture the effort required to develop each maintenance request. Only those requests have been considered where the effort is lower than 500 hours. Tasks that require more than 500 hours for execution are considered projects and the team must allocate additional staff and treats these requests as an individual project due to the magnitude of effort.
C. Performance Metrics
The accuracy of the estimation process is evaluated and reported using the following formula used by research scholars for prediction problems [12]. For any prediction,
Magnitude of Relative Error (MRE): Measures the absolute estimation accuracy and is defined as:
( 1)
Mean Magnitude of Relative Error (MMRE): The Mean Magnitude of Relative Error (MMRE) is given as:
( 2)
Prediction (PRED): For several projects, the prediction at level p is defined as:
( 3)
k is the number of projects where the MRE is within a tolerance designated by p. Acceptable threshold values of MMRE and PRED were first published by [13], and later, by other scholars [14].
D. Process Capability Index
It is widespread to mention process quality in terms of 'n' Sigma [15]. Our framework employs Control Charts to evaluate the accuracy of an estimate. To do away with the tediousness of mundane calculations, we use a tool set built on R, an open-source statistical tool that has gained much popularity these days. It is free to use and compelling, thanks to developers around the globe who keep on adding to its already rich feature set.
[image:2.595.308.545.272.370.2]We also use a specialized R-package called “qcc”, specifically developed to create control charts.
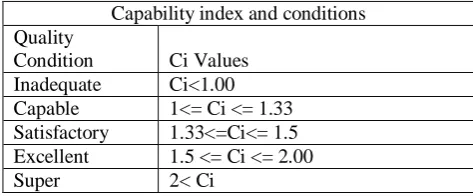
Table 1:Process Capability Index and Qualitative Ratings
Capability index and conditions Quality
Condition Ci Values
Inadequate Ci<1.00 Capable 1<= Ci <= 1.33 Satisfactory 1.33<=Ci<= 1.5 Excellent 1.5 <= Ci <= 2.00
Super 2< Ci
This section explores the capability of the process followed by the EJ methodology to estimate effort. Process capability indices are used in many industries to provide a quantitative indicator of process ability and performance. Process capability indices, Cp and Cpk, provide standard numerical values to evaluate and predict the performance of processes [5].
Cp is process capability, which is a simple indicator of process capability.
Cpk is an index (a number) that indicates how close a process runs within specified limits. Lower the index, there is a high probability that a run will go out of the specified limits. The criteria used to decide whether the process meets the requirements and corresponding qualitative mappings are provided in Table I.
Calculating Cpk and Ppk.:The Process Capability Indices are measured using the given formula [15]:
( 4)
( 5)
International Journal of Innovative Technology and Exploring Engineering (IJITEE) ISSN: 2278-3075, Volume-8 Issue-7, May, 2019
( 6)
( 7)
E. Types of Software Projects
Software projects are classified into different types based on the nature of tasks undertaken and their time-lines. While the basic service remains the same, such a classification helps managers to understand the right kind of measurement systems to be put in place for each kind of project [16], [17]. There are different types of the project depending on the nature of the work undertaken. The following gives a broad nomenclature:
1) Maintenance Projects
Software maintenance is the task of making changes to a software application to provide newer functionality based on user requirements or incorporate fixes to issues that are identified while in use. Maintenance projects could also be termed Support projects when the tasks addressed are incidents and needs to be resolved in a time bound manner due to business impacts.
2) Enhancement Projects
Enhancements are larger in scope compared to maintenance requests (tickets) and usually involve a negotiation between the vendor and the client on the effort estimate before the work is commenced. Typical maintenance requests are estimated to be 40 to 200 hours and may take from a week to a couple of months for resolution.
Both projects fall under the category of support projects distinctly from a development project. Due to the difference in scope, there is usually more scrutiny on maintenance estimates as compared to support tickets. An enhancement project augments or adds additional features to an existing application or product.
III. THE EXPERIMENT
The WBS based estimation framework that we used is based on the activities performed in a typical maintenance or enhancement project.
A. The Project under study
A team has supported the engagement under analysis for more than 5 years. The team is well versed in the domain and business background of the client. It comprises of Developers, Senior Developers and Technical Leads who work from India. The team operates out of one offshore location for a remote client.
The process starts as the team receives an enhancement request from the client. The Senior Tech Lead estimates the request for related tasks in discussion with team members to come up with the estimate. This estimate is communicated back to the client manager. After his approval, the team starts activities on the ticket.
B. Our WBS Framework
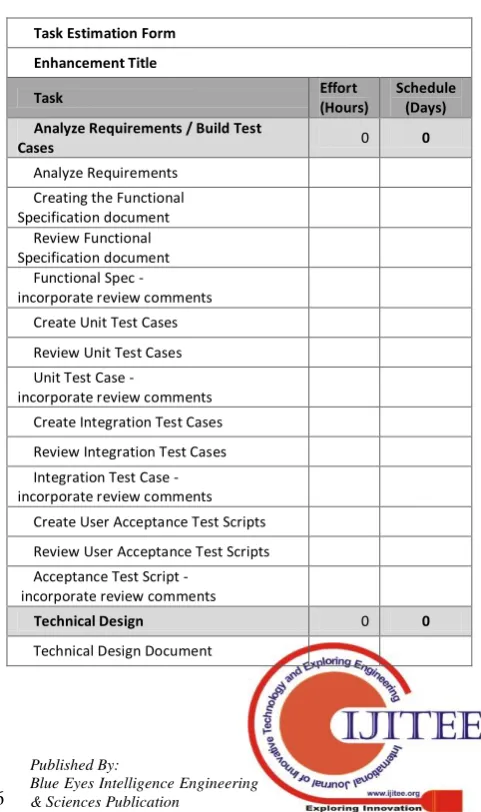
We broke down the activities as listed in Table II so that they could be reliably estimated for the effort and duration by the expert who provided the estimate. This template was used to estimate all the maintenance requests triggered by the client IT department during the period the study was performed.
The form was intentionally kept simple to motivate the team to use the template. As part of the management activities, the planned start date, the actual start date, the planned end date, and the actual end date were captured in addition to the planned effort and actual effort. The “effort” looks at the amount of time required to execute the task while the “schedule” refers to the number of calendar days required to execute the project. This helped us later to evaluate the variations in the effort as well as variations in schedule. With data collected in this format, we were able to derive the estimated effort, actual effort, planned schedule and actual schedule for each task individually. The template defined as part of the experiment was used by the expert in the team for estimation and maintained under version control for future reference.
IV. METHODOLOGY
The data collection methodology and the procedure for analysis is elaborated in this section.
A. Data Collection
Data was collected from this engagement for 2 years. Only the enhancements/tasks that were completed during the sampling period were considered for the analysis.
[image:3.595.306.547.426.832.2]Data was collected based on a pre-defined template to facilitate structured consolidation and analysis. The template that we defined for the purpose is provided in Table II. This was prepared in consultation with the team and was based on the activities within the scope of the project.
Table 2:Task Estimation Template
Task Estimation Form
Enhancement Title
Task Effort
(Hours)
Schedule (Days) Analyze Requirements / Build Test
Cases 0 0
Analyze Requirements
Creating the Functional
Specification document
Review Functional
Specification document
Functional Spec -
incorporate review comments
Create Unit Test Cases
Review Unit Test Cases
Unit Test Case -
incorporate review comments
Create Integration Test Cases
Review Integration Test Cases
Integration Test Case -
incorporate review comments
Create User Acceptance Test Scripts
Review User Acceptance Test Scripts
Acceptance Test Script -
incorporate review comments
Technical Design 0 0
Technical Design Review Technical Design -
incorporate review comments
Development 0 0
Coding
Code review
Code -
incorporate review comments
Code Walkthrough Session
with signoff
Unit Test
Unit test Review
Unit Testing -
incorporate review comments
Document Unit Test results
Integration / System Test 0 0
Schedule Deployment to Test Server
Conduct Integration / System Test
Integration / System Test review
Integration/System Test -
incorporate review comments
ConsolidateIntegration /
System Test results
Ready for User Acceptance Test
Total Effort
B. Statistical Tools and Analysis
R is a free software tool for statistical computing which can run on Windows as well as Linux platform. In the last decade, R has become a crucial tool for computational statistics, machine learning, and visualization. R has millions of users currently and has become the indispensable tool of choice for data-driven companies like Google, Facebook, and LinkedIn [18].
Qcc is an R package written and maintained by Luca Scrucca. The latest package (v2.0) is available from Comprehensive R Archive Network (CRAN) source library. It is meant to produce Quality Control Charts for continuous, attribute and count data. It can also construct CUSUM and EWMA charts, operating characteristic curves and conduct Process Capability Analysis.
Metrics is an R package written and maintained by Ben Hamner. This is a set of evaluation metrics that are commonly used in supervised machine learning. Car is a package that has quite a few additional statistical functions beyond what is available in the base R [19].
Both packages are available free from CRAN. One reason
for using R is its free availability and its full acceptance by the research community in recent times.
V. EXPLORATORY DATA ANALYSIS
A minimum set of parameters have been captured regarding the tasks performed in the project. These are Planned Effort, Planned Schedule, Count of Staff, Actual Effort, and Actual Schedule.
Effort and Schedule variances are derived from the parameters already captured. The data parameters consolidated are:
A. Estimated Effort
Estimated effort is the number of hours required to complete the task as envisaged by the Senior Technical Lead in discussion with the development team. This is measured in the number of Hours required per task.
B. Estimated Schedule (Duration)
The estimated schedule is the duration (in number of days) by which the task can be completed, different from the effort estimate. For instance, a task estimated for 60 hours could be completed in one day or 5 days based on the number of developers employed. The schedule is estimated separately from the effort based on dependencies a task might have with others, out of or within the control of the execution team, measured in the number of days per task.
C. Actual Effort
This refers to the time taken by an individual or the development team to complete the tasks.
D. Actual Schedule
This refers to the duration (in number of days) consumed by the development team to execute their tasks which is the difference between task completion and start dates.
Where dependencies with the external team are involved in the accomplishment of tasks, there is a “stop clock” facilitated by the client implemented to ensure that the team is accountable only for the time that is in their control.
E. Estimation / Schedule Error
MRE (Magnitude of Relative Error) is one of the most widely used metrics to understand and evaluate prediction accuracy. Estimation is a case of prediction and the same formula can be employed to understand the ratio by which the actual deviates from the predicted
[image:4.595.51.287.49.366.2](estimated).
Table 3:Descriptive Statistics of the Collected Data
Variable vars n mean sd median trimmed mad min max range skew kurtosis se
Count.Empl 1 120 1.46 0.75 1 1.29 0 1 5 4 1.83 3.71 0.07
Est.Effort 2 120 169.48 160.56 120 138.09 82.28 24 746 722 1.65 1.93 14.66
Act.Effort 3 120 173.19 160.59 120 142.91 91.18 24 758 734 1.6 1.8 14.66
Est.Dur 4 120 25.37 19.93 18.5 22.56 17.05 3 80 77 0.98 0.05 1.82
Act.Dur 5 120 19.41 14.45 13 17.36 10.38 3 58 55 0.97 -0.06 1.32
Effort.Var 6 120 -3.71 22.78 -0.5 -3.48 7.78 -67 138 205 1.91 13.24 2.08
International Journal of Innovative Technology and Exploring Engineering (IJITEE) ISSN: 2278-3075, Volume-8 Issue-7, May, 2019
In our framework, the relative errors of estimations are evaluated to understand how the errors are distributed, and the maturity of the process, against the Six Sigma benchmark.
VI. DATA ANALYSIS
We collected and tabulated 2 years' data from the project, and the descriptive statistics is provided in Table III. For better accuracy and consistency, the scope of the tasks is limited based on the effort. For instance, in the example taken up here, it is assumed that tasks estimated are ones typically below 500 hours.
A. Control Limits
We depend on the qcc package to plot the control limits on the chart. Setting up the Control Chart:
Step 1:Plot the errors on the control chart using the ‘R’ command.
Step2: The out of control points denote exceptional situations that occur during the process and should be removed.
Step 3:Plot the control chart again to check the distribution.
The above steps would need to be repeated until all points are within Upper and Lower control limits.
We calculated the MRE and MMRE values based on equations 1 and 2, respectively. The same steps were followed to calculate these metrics for the effort and schedule.
The variations (error) were used to plot a control chart to see the number of instances where the individual points over run the Upper Control or Lower Control limit.
B. Effort Variation
The control chart for effort variation is given in Fig. 1.Following the process adopted by Montgomery, we plotted the MRE values on the control chart for effort and schedule separately. The MRE values that were off limits were removed in the first step and the control chart re-plotted. This step was iterated until there were no points beyond the Upper and Lower control limits.
[image:5.595.313.543.56.218.2]The effort MRE for effort and schedule control charts went through 9, and 5 iterations respectively to get all points within the limits. These are shown in Fig. 1 and Fig. 2.
Fig.1:Control Chart for Effort Variance
Fig.2:Control Chart for Schedule Variation
VII. RESULTS
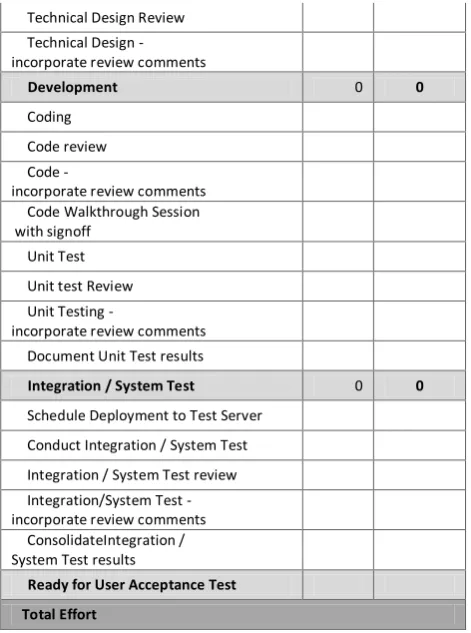
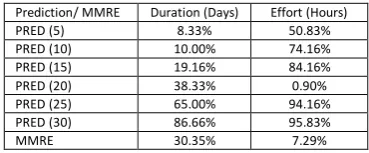
We share the results of the study separately for Effort Estimation and Schedule Estimation. The performance metrics for Effort and Schedule is shown in Table IV. We got an MMRE of 7.29% for Effort estimation against a prediction capability of 94.16% accuracy with 25% tolerance. The effort estimation results were within 25% of the actual 94.16% of times. This shows a two-fold increase from the accuracy reported by the most recent study on the subject. However, in schedule estimation, the MMRE is 30.35% with a prediction accuracy of only 65%. Relatively, the low accuracy of schedule in comparison with effort estimation is due to the external dependencies that are beyond the team's control. While this does not have an impact on the actual effort consumed for the specific task, it will have an impact on the overall duration within which the task was planned to be completed. A comparative analysis of our results with similar research [20], [21], [22],[23] is given in Table VI. Our conclusion is that breaking up of the larger tasks into its component parts and estimating them provides an increased level of accuracy.
A. Results of the Process Capability Analysis
[image:5.595.66.283.566.741.2]The outcome of the SPC analysis is discussed in Table V. Cpk tells how close the process is to the target and how consistent the process is around the mean performance. The SPC charts for effort and schedule estimations are shown in Fig. 3 and Fig.4 respectively.
Table 4:Estimation Performance Metrics
Prediction/ MMRE Duration (Days) Effort (Hours)
PRED (5) 8.33% 50.83%
PRED (10) 10.00% 74.16%
PRED (15) 19.16% 84.16%
PRED (20) 38.33% 0.90%
PRED (25) 65.00% 94.16%
PRED (30) 86.66% 95.83%
MMRE 30.35% 7.29%
A Cpk greater than 1.33 indicates that the process is adequate to meet the project goals. Between 1.33 and 1 means it requires deliberate intervention to make it higher and a Cpk value less than 1.0 means
[image:5.595.322.507.623.699.2]objectives.
Table 5:Results of the Process Capability Analysis
Metric Effort Duration
Value 2.50% 97.50% Value 2.50% 97.50% Cp 2.06 1.78 2.33 0.82 0.71 0.93 Cp_l 2.46 2.18 2.75 1.70 1.50 1.89 Cp_u 1.65 1.45 1.84 -0.06 0.00 -0.10 Cp_k 1.65 1.42 1.88 -0.06 0.01 -0.11 Cpm 1.30 1.08 1.52 0.29 0.24 0.35
Exp<LSL 0% 0%
Exp>USL 0% 56%
Obs<LSL 0% 0%
Obs>USL 0% 57%
n 108 113
LSL -0.25 0.25
USL 0.25 0.25
Center 0.04949 0.26590
StdDev 0.04054 0.10140
A Cpk measures the proximity of the reading to the center of the Upper and Lower cut off and how widely separated the readings are. In an ideal scenario, the standard deviation should be zero. A higherCpk is indicative of the capability to meet the process requirements.
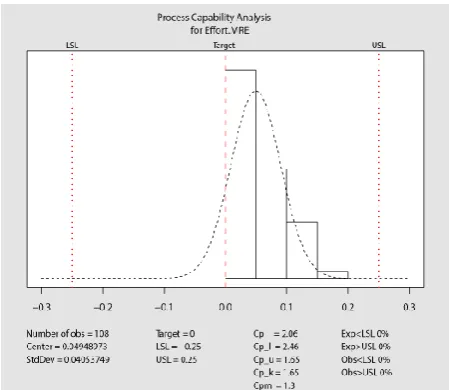
[image:6.595.58.283.396.591.2]TheCpkof 1.65 in the case of the Effort estimate evidences that the WBS based estimation process is capable to provide estimates consistently. At the same time, the low Cpkvalue of 0.05 indicates a failure of the process in estimating the schedule as required.
[image:6.595.54.284.617.772.2]Fig.3:Process Capability for Effort Estimation
Fig.4:Process Capability for Schedule Estimation
Experiment Activity Type Accuracy
MMRE PRED(25) PRED(30) Jorgensen,
1995
Maintenance
Enhancement 100% 26% Niessink and
Van Vliet 1998 Enhancement 47% 28% Abran,
2002 Enhancement 25% 35%
Ramil, 2004
Maintenance
Enhancement 19.30% 44% De Lucia,
2005
Preventive
Maintenance 100% 49.32% Vu Nguyen
et.al, 2011
Functional
Enhancement 100% 79%
Chen et.al, 2015
Maintenance
Enhancement 44.20% 43.9 Current Study
(Effort)
Maintenance
Enhancement 7.29% 94.16% 95.83% Current Study
(Duration)
Maintenance
Enhancement 30.35% 65.00% 86.60%
VIII. LIMITATIONS
The primary limitation with respect to our study is that this was conducted in a large organization, but within a very small project. When the team size is small, there is more predictability to each person's tasks and completions as compared to a larger team. Additionally, the activities are small as evidenced by the mean value of 170 hours (Table III). Since this is at the most a week of activities when performed by a team of 3 people including developers and a tester, there is more visibility and control to the team members when compared to a big project.
The accuracy of the capability evaluations will increase when the sample size is large. In this experiment, each instance of estimation is considered a sample, and this poses limitations regarding the accuracy of the capability analysis.
IX. CONCLUSION
International Journal of Innovative Technology and Exploring Engineering (IJITEE) ISSN: 2278-3075, Volume-8 Issue-7, May, 2019
Author-1 Photo A more extensive project database gains better insight into
the Expert Judgment process. Also, given that this method continues to be employed by one-third of the projects worldwide, further research in this area is warranted.
REFERENCES
1. M. Jorgensen, “Contrasting ideal and realistic conditions as a means to improve judgment-based software development effortestimation,”Information and Software Technology, vol. 53, no. 12, pp. 1382–1390,2010.
2. S. E. Koutbi, A.Idri, and A. Abran, “Systematic Mapping Study ofDealing with Error in Software Development Effort Estimation,”201642th Euromicro Conference on Software Engineering and AdvancedApplications (SEAA), no. 2, pp. 140–147, 2016. 3. B. Kitchenham, S. L. Pfleeger, B. McColl, and S. Eagan, “An
empiricalstudy of maintenance and development estimation accuracy,”Journalof Systems and Software, vol. 64, no. 1, pp. 57–77, 2002.
4. P.Marounek,“Simplified approachto effort estimation in softwaremaintenance,”Journal of Systems Integration, pp. 51–63, 2012. 5. K. Shinde.J.H, “Importance of Process Capability and Process Performance Indices in Machine Tools,” IJREAS, vol.2, no.2, pp. 1211–1217, 2012.
6. C. Rush and R. Roy, “Expert Judgement in Cost Estimating: Modellingthe Reasoning Process, “Concurrent Engineering, vol. 9, no. 4, pp.271–284, 2001.
7. M.S.Brown, H.Dirska, and M. Pelosi, “Agile Method SoftwareDevelopment Estimation Biases, “International Journal of AdvancedResearch in Computer Science and Software Engineering, vol. 3, no. 10, pp. 115–119, 2013.
8. R.Huijbers, F. Lemmens, B. Senders, S. Simons, B. Spann, P. Tilburg,and K. Vossen, “Software project management: methodologies &techniques,” Department of Mathematics & Computer Science, no.September, p. 20, 2004.
9. M. Jorgensen and T.Halkjelsvik, “The effects of request formats onjudgment-based effort estimation,”Journal of Systems and Software,vol. 83, no. 1, pp. 29–36, 2010.
10.M. Jorgensen, “A review of studies on expert estimation of softwaredevelopment effort,”Journal of Systems and Software, vol. 70, no. 1-2,pp. 37–60, 2004.
11.D. Azhar, E.Mendes, and P.Riddle, “A Systematic Review of WebResource Estimation,”Proceedings of the 8th International Conferenceon Predictive Models in Software Engineering, ACM, pp. 49–58, 2012.
12.W. Rosa, R.Madachy, B.Boehm, B.Clark, C.Jones, J.Mcgarry,and J.Dean, “Improved Method for Predicting Software Effort andSchedule,”International Cost Estimating and Analysis Association (ICEAA), 2014.
13.H. S.D. Conte and V.Y.Shen,Software Engineering Metrics andModels, 1st ed. Benjamin/Cummings, Menlo Park, 1986, 1986. 14.C. E. L. Peixoto, J. L. N. Audy, and R.Prikladnicki, “Effort
Estimation in Global Software Development Projects: Preliminary Results from a Survey,”2010 International Conference on Global SoftwareEngineering, pp. 123–127, 2010.
15.D. Montgomery, Introduction to statistical quality control. John Wileyand Sons, Inc., 2009.
16.F. Gonzalez-Ladron-de Guevara, M. Fernandez-Diego, and C. Lokan,“The usage of ISBSG data fields in software effort estimation: Asystematic mapping study, “The Journal of Systems and Software, vol.113, no. December, pp. 188–215, 2016.
17.N. Leena, “Software Cost Estimation -A Case Study,”Asian Journal ofComputer Science and Information Technology, vol. 10, pp. 283–285,2012.
18.R. D. Peng, “Exploratory Data Analysis with R” Leanpub, p. 178,2015. 19.J. Fox, S. Weisberg, D. Adler, D. Bates, G. Baud-bovy, S. Ellison, D.
Firth, M. Friendly, G. Gorjanc, S. Graves, R. Heiberger,R. Lavoisier, G. Monette, D. Murdoch, D. Ogle, B. Ripley, and. Venables, “Package ‘car’: Companion to Applied Regression. “RAN Repository, 2016.
20.M. Jorgensen and G. Kirkeboen, “Human judgement in effort estimation of software projects,” in2000 International Conference onSoftware Engineering, vol. 45, 2000, pp. 1–7.
21.V. Nguyen, “Improved size and effort estimation models for softwaremaintenance,” IEEE International Conference on Software Maintenance, ICSM, pp. 1–2, 2010.
22.A.Armley, J.Kaczynski, and C. McMillan, “A case study ofautomated feature location techniques for industrial cost
estimation,”Proceedings - 2016 IEEE International Conference on Software Maintenance and Evolution, ICSME 2016, pp. 553–562, 2017. 23. J. Chen, Y. Yang, W. Zhang, and G. Gay, “Measuring the heterogeneityof cross-company dataset,” Proceedings of the 11th InternationalConference on Product Focused Software: PROFES ’10, pp. 55–58,2010.
AUTHORSPROFILE
Sreekumar P. Pillaiis a research scholar (Ph.D.) in Software Effort Estimation employing Machine Learning techniques, holding a M.Phil in Management and a Master’s degree in Business Administration. He has over 20 years of industry experience in Information Systems development and software engineering. He is also a Data scientist and solutionist. His areas of interests include Data Science, Artificial Intelligence, Robotic Process Automation, and Software Engineering models in productivity, estimation, quality and risk. He has published papers and articles on machine learning and management and is very active in the technology community.
Dr. T. Radha Ramananis Head of School of Management Studies, NITC,Kozhikode, Kerala, India. He holds a Ph.D. in Industrial Engineering from NIT Trichy and anM.Tech in IEfrom Regional Engineering College, Trichy. His areas of interest are Operations Management,
Data Analysis, Decision Models, Performance
measurement among others. He has produced 5 research scholars and supervising 10 more candidates. He has also guided more than two dozen PG projects. He has published around 15 papers in international journals of repute and more than 50 papers in various international conferences. He is also a reviewer of many international journals.