Abstract: Microarray gene expression data analysis is one of the finest areas of gene expression analysis, where each gene with its expression value is useful to decide the future analysis of different genes and its characteristics values. Usually, when a data undergoes analysis consisting of missing values and the analysis performed on this data may lead to inconsistent results. We need to recover all these missing values before performing the data analysis, which incurs in the data set. This paper brings out a new method of missing data estimation with the help of clustering technique like DBSCAN for estimating missing values. We also found similar characteristic gene clustering and applied separately to the missing data estimation on these clusters. So, it is a two-step process of missing data estimation, and has an advantage in the context of data reduction dimensionally and smooths application of missing data estimation algorithm. By conducting, an experiment on two microarray data sets, its result, and performance analysis are recorded.
Index Terms: Microarray Gene expression data, imputation, PCA, missForest, DBSCAN, RMSE.
I. INTRODUCTION
Microarray gene expression data has been popular data which is obtained by the process of hybridization. There are two techniques in hybridization, one southern blotting, and one northern blotting. In Southern blotting, a small string of positive DNA is hybridized with a complementary segment of DNA and will undergo a process called electrophoresis. In the Northern blotting, Radio labeled DNA hybridized with messenger RNA.[1, 2, 3, 4] This hybridized gel is placed on the glass surface and goes through a wash. The plate which probes is exposed in the light of fluorescent so that Probes with radio material exposed to different intensities of light. This emitted light with different intensities is captured as an image. Thus obtained image further goes with image processing techniques to identify dot location and its intensities. These obtained intensities placed in the form of a table and values are normalized. The obtained microarray data is useful for Genotyping and expression analysis. Genotyping is processed to detect mutation in specific genes. Expression analysis is the process to identify similar and dissimilar genes in the microarray data. While performing analysis of clustering to identify the similar characteristics and similar associative genes to identify the dissimilar genes with ANOVA by statistical techniques require microarray with complete values. If the microarray data consists of some Revised Manuscript Received on June 07, 2019.
K Ishthaq Ahmad, Research Scholar, Dept. of Computer Science and Engineering, Acharya Nagarjuna University, Guntur.
Dr.Shaheda Akthar, RegistrarFAC Dr.Abdul Haq Urdu University, Kurnool.
missing values or entries then the result obtained after, the analysis may not be correct. These missing entries and missing values usually possible in the microarray data because dust particle and image is not captured properly. So to improve the accuracy of results after performing the analysis, data with missing entries are estimated. [16] These missing entries fall under categories of MCAR(Missing Completely at Random), MAR(Missing at Random), and MNAR(Missing Not at Random). MCAR is the pattern of missing data in which the missing value pattern does not depend on either observed or unobserved values. Missing data is estimated under MCAR which entirely depends on external information. Under the MAR pattern of missing or missing data entirely depends on the values observed. In MNAR, missing pattern of data depends on the unobserved pattern of values. Missing data estimation algorithms fall under three different categories, one local approach, another global approach, and last both local and global which comes under the hybrid approach. The local approach is based on algorithms, which take into account of local data pattern of observed values in the dataset. The global approach is based on algorithms, which take into account of the global information matrix based on the entire dataset. In this paper, we have focused on dimensional reduction by clustering and performing separately missing data estimation on each cluster. In order to perform the clustering, because the micro array data is very huge in dimensionality, to reduce the dimensionality, here we used DBSCAN (Density-based spatial clustering of applications with noise) clustering algorithm, PCA(Principle Component Analysis)- missing data algorithm and miss-Forest missing data algorithm for estimation of missing data. The technique performed is evaluated by mean square estimation goodness of fit technique.
II. MISSING DATA IN MICROARRAY GENE EXPRESSION DATA
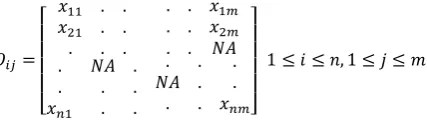
Microarray gene expression data is in the form of data matrix
O
ij, where i represent a particular gene and j representexperimental conditions. This data matrix consists of all the observed values in general conditions. The analysis of this data is more effective when the data is complete. But usually, the microarray data has some missing entries which become a hurdle to perform analysis. When the analysis is performed on this data with missing entries, can lead to wrong interpretation.
A Novel Approach to Missing Data Estimation
Technique for Microarray Gene Expression Data
and Dimensionality Reduction
A Novel Approach to Missing Data Estimation Technique for Microarray Gene Expression Data and Dimensionality Reduction
Another issue in the microarray gene expression data is huge entries or data values. To perform the analysis of such huge data require large computation and troublesome. So the dimensionality of the data has to be reduced. From equation 1, i and j represent the index of gene and experimental conditions.
X
ij is the data value in the microarray geneexpression data. The dimension of the total data set is n*m, where n is the total number of genes and m represents a set of experimental conditions. NA represents the missing entries in the dataset.
(1)
[5] In this paper, the author has discussed the improvement of hierarchical clustering by aggregating the genes and identifying the best position in the gene expression data. [6] Orthogonal coding method has been used to identify the missing values and imputing the missing values in a higher dimension. [7] Multiple references for external integrated data sets used for the missing data estimation. [8] In this paper, the authors proposed a robust least square estimation method by extending the local least square estimation with principal components. [9] The authors have made a comparative study of different approaches to missing value estimation methods and their impact on the hierarchical clustering. [10] A hybrid technique has been proposed in this paper, in which it takes into account of both global information (BPCA- Bayesian Principle Component Analysis) and local structure (Least square estimation) to estimate the missing values in the datasets. [11] Shrinkage based missing data imputation method, in which the correlation structure between the gene and regression coefficients are used to estimate the missing data values. [12] In this paper, the author has used the Gene Ontology of target gene information to impute the missing data values in the microarray datasets. [13]. Bicluster based BPCA is proposed in which most correlated genes and experimental conditions of most correlated genes are identified and BPCA is performed on the identified genes with missing entries.
III. METHODOLOGY
Gene expression data has a huge dimension with multiple rows (gene) and columns (experimental conditions). Usually, these datasets have huge missing entries, to estimate the missing entries in the data sets, the first requirement is to reduce the dimension.
A. DBSCAN (Density-based spatial clustering of applications with noise) [14]
This algorithm usually works on Euclidean distance and the minimum number of points required to form the dense region. This algorithm requires two parameters, eps, which gives the minimum distance between the points and minPoints, which was used to identify the minimum number points required from the dense region. eps, the parameter can influence the clustering by assigning values. If minimum value is assigned then it cannot form the cluster with the
maximum data points, whereas, eps value is high, then there is a chance of the majority of points will remain in the same cluster. minPoint parameter values are related to the dimension of the dataset, where, a minPoint value can be used to reduce the dataset..
DBSCAN Algorithm:
1. Find the points which stay near to the target points and identify the most significant points near to the target point.
2. Find the connected core components which are based on the target point.
3. Assign each noncore components to nearby cluster and otherwise assign to noise.
B. Miss-Forest imputation algorithm
Usually this algorithm works on mixed types of data sets either be categorical or continuous data. The basic building block of this algorithm is the decision tree. The fundamental idea behind a random forest is to combine many decision trees into a single model. Individually, predictions made by decision trees (or humans) may not be accurate, but combined; the predictions will be closer to the mark on average. It can handle non-linear relation and complex structure in the data sets. This algorithm is based on random forest. [15] [Breiman 2001] The main advantage of this algorithm is, it can run in parallel to save computational time. C. PCA (Principal Component Analysis) Imputation algorithm [17]
This algorithm derives the relation between original variables and latent variables in a PCA based form. PCA has been used to convert the high dimensional data to low dimensional data by using PCA components. This low dimensional data is used to construct the missing values in the original entries. First, it estimates the distribution on the original data and then reconstructs the missing values in the original data.
X be the data matrix with L rows and K columns. PCA is the method for reducing the dimensionality of the original data. Find the that minimize the
reconstructive error
(2)
[image:2.595.60.274.179.239.2]M is the matrix with L× K, where matrix with L number of rows and K number of columns. F and U represent the principal components matrix and Orthogonal matrix. D. Proposed Methodology
Figure 1 shows the flow chart of proposed methodology. Step 1: At first, we will take the microarray dataset with a huge dimension with no missing entries.
Step 3: Now at the beginning insert the missing values in the datasets with computed values of mean imputation and apply the DBSCAN clustering algorithm on that inserted data set.
Step 4: Now in each cluster, from the previous step the inserted mean values are converted back to missing values.
Step 5: Apply the misForest and PCA imputation on each
clustering separately and compute their aggregate RMSE value.
Figure. 1 Flowchart of Proposed Methodology. IV. DATA SETS USED IN THE EXPERIMENTS [18,19]
Prostate cancer microarray dataset has used for this experiment. The datasets consist of 2135 genes and 102 samples. For the computational simplicity, we have reduced the number of samples from 102 to 24 and genes remain the same.
Second data set belongs to, the CDC15 yeast gene expression data set of Spellman dataset. This dataset consisting of 4381 genes and 24 samples. For our experiment, we eliminated the first sample which is not a numeric quantity and the remaining 23 samples are used for our experiment.
V. PERFORMANCE EVALUATION AND RESULTS DISCUSSION
The Root Mean Square Error (RMSE) [20] (also called the root mean square deviation, RMSD) is frequently used to measure the difference between values predicted by a model
and the values actually observed from the environment that is being modeled. These individual differences are also called residuals, and the RMSE serves to aggregate them into a single measure of predictive power.
The RMSE of a model prediction with respect to the estimated variable is defined as the square root of the
mean squared error:
(3) Where is observed values and are estimated
values of ith gene and jth experiment.
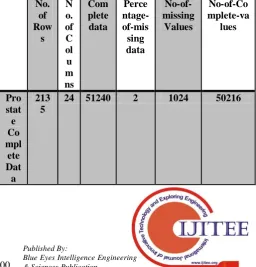
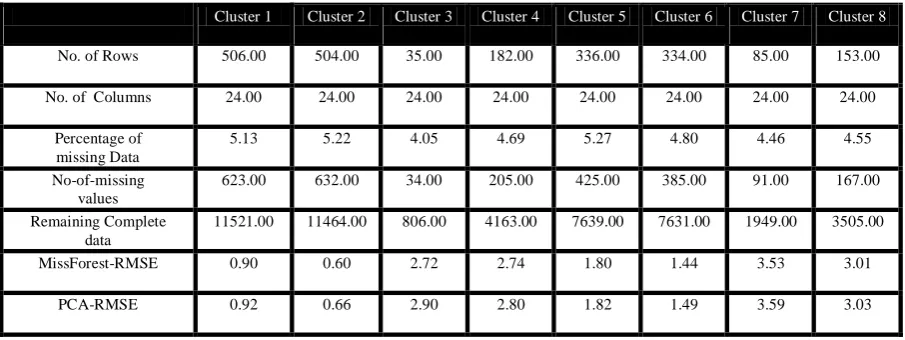
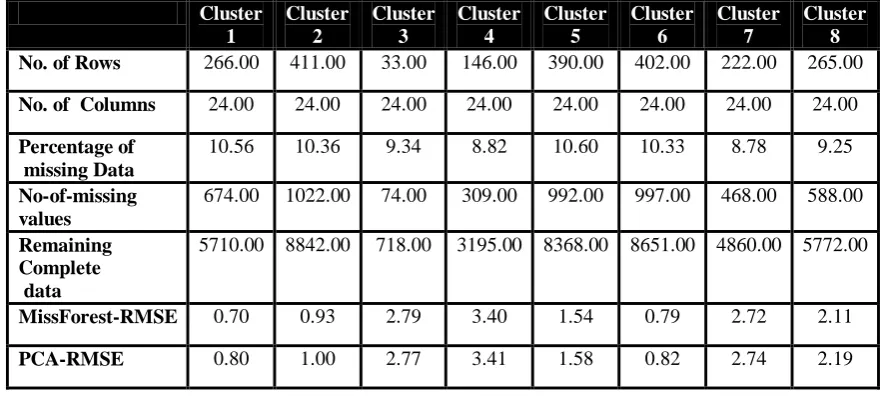
Prostate Cancer dataset: Table 1, 4, 7, 10, 13 shows the missing values of each column at 2, 5, 10, 15, and 20 percentage of missing values. Table 2, 5, 8, 11, 14 shows the complete data, percentage of missing values and number of remaining values in the table. Table 3, 6, 9, 12, 15 shows the cluster wide missing values and respective computed RMSE value.
Spellman dataset: Table 16, 19, 22, 25, 28 shows the missing values of each column at 2, 5, 10, 15, 20 percentage of missing values. Table 17, 20, 23, 26, 29 shows the complete data, percentage of missing values and number of remaining values in the table. Table 18, 21, 24, 27, 30 shows the cluster wide missing values and respective computed RMSE value.
[image:3.595.49.281.186.570.2]Table 31 and 32 shows the Computed RMSE value at 2, 5, 10, 15, and 20 percentages of missing values for Prostate cancer dataset and Spellman dataset, proposed by our new methodology.
Table. 1 Missing Values in each column in complete data set with 2 % missing (Prostate Cancer dataset)
A B C D E F G H I J K L
50 45 35 51 41 45 44 41 37 46 44 34
M N O P Q R S T U V W X
56 59 29 32 39 42 38 43 46 40 38 49 Table. 2 Complete Statistics of missing data at 2% missing(Prostate Cancer dataset)
No. of Row
s N o. of C ol u m ns
Com plete
data
Perce ntage-of-mis sing data
No-of-missing
Values
No-of-Co mplete-va
lues
Pro stat e Co mpl
ete Dat a
213 5
[image:3.595.298.555.560.827.2]A Novel Approach to Missing Data Estimation Technique for Microarray Gene Expression Data and Dimensionality Reduction
Table. 3 Cluster wise statistics at 2% missing data(Prostate Cancer dataset)
Cluster 1
Cluster 2
Cluster 3
Cluster 4
Cluster 5
Cluster 6
Cluster 7
Cluster 8
No. of Rows 255.00 359.00 28.00 213.00 474.00 281.00 382.00 143.00 No. of Columns 24.00 24.00 24.00 24.00 24.00 24.00 24.00 24.00
Percentage of
missing Data 2.06 2.05 2.23 2.15 1.92 1.76 2.05 2.07
No-of-missing
values 126.00 177.00 15.00 110.00 218.00 119.00 188.00 71.00 Remaining
Complete data
5994.00 8439.00 657.00 5002.00 11158.00 6625.00 8980.00 3361.00
MissForest-RMSE 0.66 0.62 2.68 2.00 1.25 2.55 1.17 3.19
PCA-RMSE 0.76 0.66 2.79 2.07 1.28 2.58 1.21 3.25
Table. 4 Missing Values in each column in complete data set with 5 % missing (Prostate Cancer dataset)
A B C D E F G H I J K L
106 98 104 119 110 109 101 106 109 108 109 114
M N O P Q R S T U V W X
102 109 93 118 99 102 109 110 99 119 112 97 Table. 5 Complete Statistics of missing data at 5% missing(Prostate Cancer dataset)
No. of Rows
No. of Columns
Complete data
Percentage-of-missing data
No-of-missing
Values No-of-Complete-values
Prostate Complete
Data
[image:4.595.72.525.492.662.2]2135 24 51240 5 2562 48678
Table. 6 Cluster wise statistics at 5% missing data(Prostate Cancer dataset)
Cluster 1 Cluster 2 Cluster 3 Cluster 4 Cluster 5 Cluster 6 Cluster 7 Cluster 8
No. of Rows 506.00 504.00 35.00 182.00 336.00 334.00 85.00 153.00
No. of Columns 24.00 24.00 24.00 24.00 24.00 24.00 24.00 24.00
Percentage of missing Data
5.13 5.22 4.05 4.69 5.27 4.80 4.46 4.55
No-of-missing values
623.00 632.00 34.00 205.00 425.00 385.00 91.00 167.00
Remaining Complete data
11521.00 11464.00 806.00 4163.00 7639.00 7631.00 1949.00 3505.00
MissForest-RMSE 0.90 0.60 2.72 2.74 1.80 1.44 3.53 3.01
PCA-RMSE 0.92 0.66 2.90 2.80 1.82 1.49 3.59 3.03
Table. 7 Missing Values in each column in complete data set with 10% missing (Prostate Cancer dataset)
A B C D E F G H I J K L
209 189 201 204 218 210 218 204 203 230 205 215
204 240 217 203 213 236 218 221 216 206 212 232
Table. 8 Complete Statistics of missing data at 10% missing(Prostate Cancer dataset)
No. of Rows
No. of Columns
Complete data
Percentage-of-missing data
No-of-missing Values
No-of-Complete-values
Prostate Complete
Data
[image:5.595.76.518.223.421.2]2135 24 51240 10 5124 46116
Table. 9 Cluster wise statistics at 10% missing data(Prostate Cancer dataset)
Cluster 1
Cluster 2
Cluster 3
Cluster 4
Cluster 5
Cluster 6
Cluster 7
Cluster 8
No. of Rows 266.00 411.00 33.00 146.00 390.00 402.00 222.00 265.00 No. of Columns 24.00 24.00 24.00 24.00 24.00 24.00 24.00 24.00 Percentage of
missing Data
10.56 10.36 9.34 8.82 10.60 10.33 8.78 9.25 No-of-missing
values
674.00 1022.00 74.00 309.00 992.00 997.00 468.00 588.00
Remaining Complete data
5710.00 8842.00 718.00 3195.00 8368.00 8651.00 4860.00 5772.00
MissForest-RMSE 0.70 0.93 2.79 3.40 1.54 0.79 2.72 2.11
PCA-RMSE 0.80 1.00 2.77 3.41 1.58 0.82 2.74 2.19
Table. 10 Missing Values in each column in complete data set with 15% missing (Prostate Cancer dataset)
A B C D E F G H I J K L
330 323 335 308 301 351 305 296 326 298 336 332
M N O P Q R S T U V W X
314 336 290 294 332 311 327 333 345 296 341 326
Table. 11 Complete Statistics of missing data at 15% missing(Prostate Cancer dataset)
No. of Rows
No. of Columns
Complete data
Percentage-of-missing data
No-of-missing Values
No-of-Complete-values
Prostate Complete
Data
2135 24 51240 15 7686 43554
Table. 12 Cluster wise statistics at 15% missing data(Prostate Cancer dataset)
Cluster 1 Cluster 2 Cluster 3 Cluster 4 Cluster 5 Cluster 6 Cluster 7 Cluster 8
No. of Rows 498.00 125.00 223.00 438.00 50.00 324.00 339.00 138.00
No. of Columns 24.00 24.00 24.00 24.00 24.00 24.00 24.00 24.00
Percentage of missing Data
A Novel Approach to Missing Data Estimation Technique for Microarray Gene Expression Data and Dimensionality Reduction
No-of-missing values
1912.00 401.00 776.00 1637.00 167.00 1164.00 1209.00 420.00 Remaining Complete
data
10040.00 2599.00 4576.00 8875.00 1033.00 6612.00 6927.00 2892.00
MissForest-RMSE 0.55 3.58 2.38 0.96 1.88 1.88 1.23 2.93
PCA-RMSE 0.63 3.59 2.42 1.00 1.97 1.92 1.28 2.95
Table. 13 Missing Values in each column in complete data set with 20% missing (Prostate Cancer dataset)
A B C D E F G H I J K L
429 429 461 445 403 384 393 403 447 449 418 403
M N O P Q R S T U V W X
438 442 457 428 420 409 443 414 459 411 434 429
Table. 14 Complete Statistics of missing data at 20% missing(Prostate Cancer dataset)
No. of Rows
No. of Columns
Complete data
Percentage-of-missing data
No-of-missing Values
No-of-Complete-values
Prostate Complete
Data
2135 24 51240 20 10248 40992
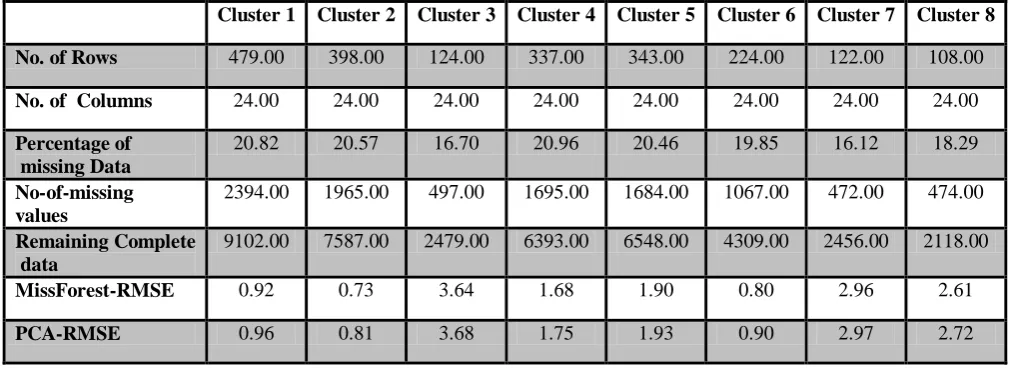
Table. 15 Cluster wise statistics at 20% missing data(Prostate Cancer dataset)
Cluster 1 Cluster 2 Cluster 3 Cluster 4 Cluster 5 Cluster 6 Cluster 7 Cluster 8
No. of Rows 479.00 398.00 124.00 337.00 343.00 224.00 122.00 108.00
No. of Columns 24.00 24.00 24.00 24.00 24.00 24.00 24.00 24.00
Percentage of missing Data
20.82 20.57 16.70 20.96 20.46 19.85 16.12 18.29 No-of-missing
values
2394.00 1965.00 497.00 1695.00 1684.00 1067.00 472.00 474.00
Remaining Complete data
9102.00 7587.00 2479.00 6393.00 6548.00 4309.00 2456.00 2118.00
MissForest-RMSE 0.92 0.73 3.64 1.68 1.90 0.80 2.96 2.61
[image:6.595.45.552.392.576.2]PCA-RMSE 0.96 0.81 3.68 1.75 1.93 0.90 2.97 2.72
Table. 16 Missing Values in each column in complete data set with 2% missing (Spellman Dataset)
A B C D E F G H I J K L
75 91 89 81 93 76 103 100 71 89 70 83
M N O P Q R S T U V W
Table. 17 Complete Statistics of missing data at 2% missing(Spellman Dataset)
No. of Rows
No. of Columns
Complete data
Percentag e-of-missi
ng data
No-of-missi ng Values
No-of-Comp lete-values
Spellman Complete Data
[image:7.595.43.551.220.402.2]4381 23 100763 2 2015 98748
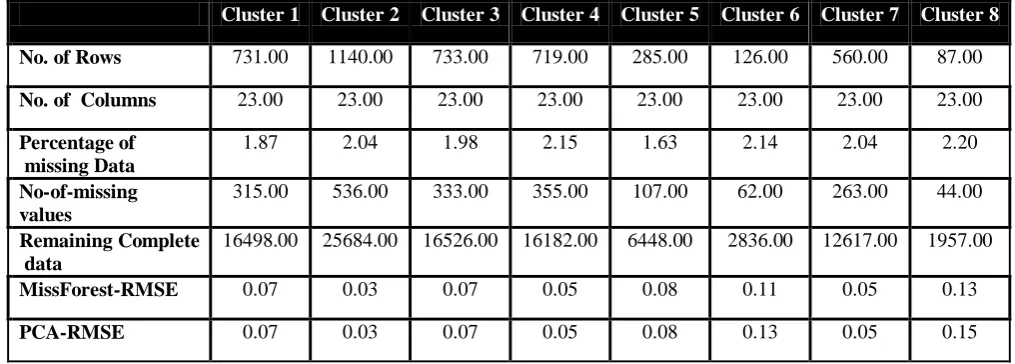
Table. 18 Cluster wise statistics at 2% missing data(Spellman Dataset)
Cluster 1 Cluster 2 Cluster 3 Cluster 4 Cluster 5 Cluster 6 Cluster 7 Cluster 8
No. of Rows 731.00 1140.00 733.00 719.00 285.00 126.00 560.00 87.00
No. of Columns 23.00 23.00 23.00 23.00 23.00 23.00 23.00 23.00
Percentage of missing Data
1.87 2.04 1.98 2.15 1.63 2.14 2.04 2.20
No-of-missing values
315.00 536.00 333.00 355.00 107.00 62.00 263.00 44.00 Remaining Complete
data
16498.00 25684.00 16526.00 16182.00 6448.00 2836.00 12617.00 1957.00
MissForest-RMSE 0.07 0.03 0.07 0.05 0.08 0.11 0.05 0.13
PCA-RMSE 0.07 0.03 0.07 0.05 0.08 0.13 0.05 0.15
Table. 19 Missing Values in each column in complete data set with 5% missing (Spellman Dataset)
A B C D E F G H I J K L
228 219 228 206 230 228 233 237 209 226 239 216
M N O P Q R S T U V W
197 186 209 225 226 219 204 208 234 215 216
Table. 20 Complete Statistics of missing data at 5% missing(Spellman Dataset)
No. of Rows
No. of Columns
Complete data
Percentag e-of-missi
ng data
No-of-missi ng Values
No-of-Complet e-values
Spellman Complete Data
4381 23 100763 5 5038 95725
Table. 21 Cluster wise statistics at 5% missing data(Spellman Dataset)
Cluster 1
Cluster 2
Cluster 3
Cluster 4
Cluster 5
Cluster 6
Cluster 7
Cluster 8
No. of Rows 734.00 528.00 314.00 670.00 771.00 1150.00 128.00 86.00 No. of Columns 23.00 23.00 23.00 23.00 23.00 23.00 23.00 23.00 Percentage of
missing Data
A Novel Approach to Missing Data Estimation Technique for Microarray Gene Expression Data and Dimensionality Reduction
No-of-missing values
801.00 625.00 373.00 734.00 881.00 1380.00 141.00 103.00 Remaining
Complete data
16081.00 11519.00 6849.00 14676.00 16852.00 25070.00 2803.00 1875.00
MissForest-RMSE 0.07 0.05 0.08 0.07 0.05 0.03 0.13 0.14
PCA-RMSE 0.07 0.05 0.09 0.07 0.05 0.03 0.13 0.15
Table. 22 Missing Values in each column in complete data set with 10% missing (Spellman Dataset)
A B C D E F G H I J K
445 407 407 448 445 451 430 455 467 447 440
L M N O P Q R S T U V W
406 399 433 427 439 445 461 424 419 451 465 465
Table. 23 Complete Statistics of missing data at 10% missing(Spellman Dataset)
No. of Rows
No. of Columns
Complete data
Percentage-of-missing data
No-of-missing Values
No-of-Complete-values
Spellman Complete Data
4381 23 100763 10 10076 90687
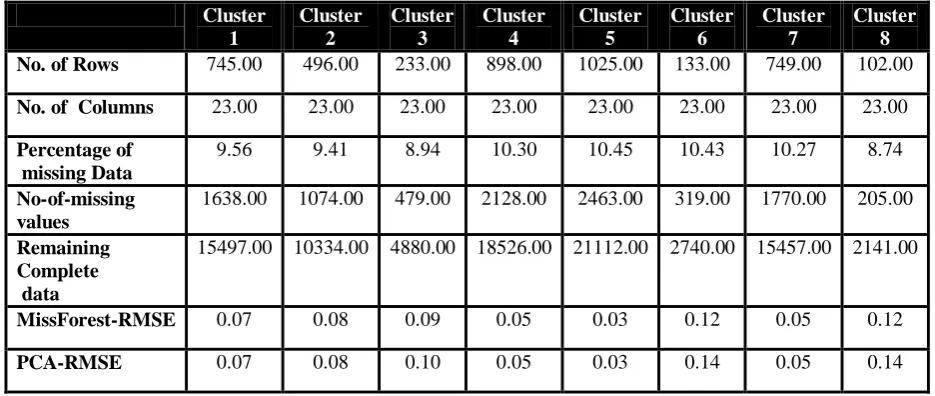
Table. 24 Cluster wise statistics at 10% missing data(Spellman Dataset)
Cluster 1
Cluster 2
Cluster 3
Cluster 4
Cluster 5
Cluster 6
Cluster 7
Cluster 8
No. of Rows 745.00 496.00 233.00 898.00 1025.00 133.00 749.00 102.00 No. of Columns 23.00 23.00 23.00 23.00 23.00 23.00 23.00 23.00 Percentage of
missing Data
9.56 9.41 8.94 10.30 10.45 10.43 10.27 8.74
No-of-missing values
1638.00 1074.00 479.00 2128.00 2463.00 319.00 1770.00 205.00 Remaining
Complete data
15497.00 10334.00 4880.00 18526.00 21112.00 2740.00 15457.00 2141.00
MissForest-RMSE 0.07 0.08 0.09 0.05 0.03 0.12 0.05 0.12
[image:8.595.64.532.390.588.2]PCA-RMSE 0.07 0.08 0.10 0.05 0.03 0.14 0.05 0.14
Table. 25 Missing Values in each column in complete data set with 15% missing (Spellman Dataset)
A B C D E F G H I J K
669 632 669 681 681 637 677 667 647 667 636
L M N O P Q R S T U V W
Table. 26 Complete Statistics of missing data at 15% missing(Spellman Dataset)
No. of Row s
No. of Columns
Complete data
Percentage-of -missing
data
No-of-miss ing Values
No-of-Complete-v alues
Spellman Complete Data
[image:9.595.44.552.207.389.2]4381 23 100763 15 15114 85649
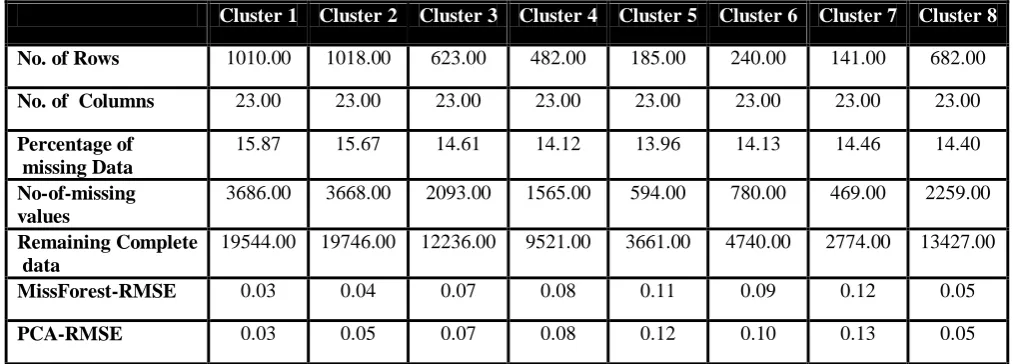
Table. 27 Cluster wise statistics at 15% missing data(Spellman Dataset)
Cluster 1 Cluster 2 Cluster 3 Cluster 4 Cluster 5 Cluster 6 Cluster 7 Cluster 8
No. of Rows 1010.00 1018.00 623.00 482.00 185.00 240.00 141.00 682.00
No. of Columns 23.00 23.00 23.00 23.00 23.00 23.00 23.00 23.00
Percentage of missing Data
15.87 15.67 14.61 14.12 13.96 14.13 14.46 14.40 No-of-missing
values
3686.00 3668.00 2093.00 1565.00 594.00 780.00 469.00 2259.00
Remaining Complete data
19544.00 19746.00 12236.00 9521.00 3661.00 4740.00 2774.00 13427.00
MissForest-RMSE 0.03 0.04 0.07 0.08 0.11 0.09 0.12 0.05
PCA-RMSE 0.03 0.05 0.07 0.08 0.12 0.10 0.13 0.05
Table. 28 Missing Values in each column in complete data set with 20% missing (Spellman Dataset)
A B C D E F G H I J K
875 861 901 868 860 865 876 884 896 862 828
L M N O P Q R S T U V W
910 888 895 867 844 930 849 862 869 864 914 884
Table. 29 Complete Statistics of missing data at 20% missing(Spellman Dataset)
No. of Rows
No. of Columns
Complete data
Percentage-of- missing
data
No-of-missing Values
No-of-Complete- values
Spellman Complete
Data
[image:9.595.68.545.639.778.2]4381 23 100763 20 20152 80611
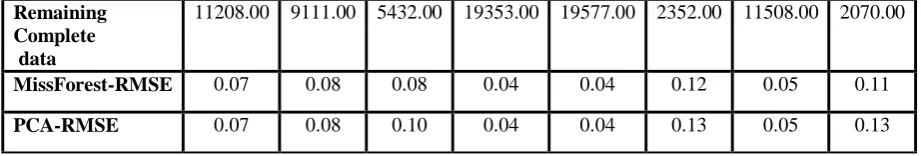
Table. 30 Cluster wise statistics at 20% missing data(Spellman Dataset)
Cluster 1
Cluster 2
Cluster 3
Cluster 4
Cluster 5
Cluster 6
Cluster 7
Cluster 8
No. of Rows 600.00 487.00 293.00 1063.00 1077.00 127.00 623.00 111.00 No. of Columns 23.00 23.00 23.00 23.00 23.00 23.00 23.00 23.00 Percentage of
missing Data
18.78 18.66 19.39 20.84 20.97 19.48 19.69 18.92 No-of-missing
values
A Novel Approach to Missing Data Estimation Technique for Microarray Gene Expression Data and Dimensionality Reduction
Remaining Complete data
11208.00 9111.00 5432.00 19353.00 19577.00 2352.00 11508.00 2070.00
MissForest-RMSE 0.07 0.08 0.08 0.04 0.04 0.12 0.05 0.11
[image:10.595.68.529.51.129.2]PCA-RMSE 0.07 0.08 0.10 0.04 0.04 0.13 0.05 0.13
Table. 31 Estimated RMSE values of datasets with different % of missing data(Prostate Cancer dataset)
S.No % Missing
Data
RMSE-Proposed- missForest
RMSE-Proposed- PCA
1 2 1.764 1.824
2 5 2.092 2.153
3 10 1.873 1.913
4 15 1.923 1.970
5 20 1.905 1.965
Table. 32 Estimated RMSE values of datasets with different % of missing data(Spellman dataset)
S.No %
Missing Data
RMSE- Proposed- missForest
RMSE-Proposed- PCA
1 2 0.074 0.080
2 5 0.075 0.080
3 10 0.075 0.081
4 15 0.074 0.079
5 20 0.073 0.081
VI. CONCLUSION
Missing data estimation is one of the finest work carried out by many researchers in the world. Usually, data consists of missing entries. These missing entries can make a drastic effect on the analysis of data. So making the analysis on the datasets with missing values can generate inaccurate results. In this paper, we proposed a new methodology in which first the microarray data which is in huge dimensionality. At first the missing entries are replaced by mean imputed values and again they undergo by DBSCAN clustering technique to form different clusters. After performing the clustering we obtain different clusters whose dimensionality has been reduced. Now each cluster is suitable for computing missing values. Perform the missforest and PCA on each cluster individually. Once the missing values are imputed the RMSE values for each cluster is computed individually. At last RMSE value of each cluster is summed up to give the RMSE value of the total imputed dataset. The obtained results show optimal RMSE values.
REFERENCES
1. Hoheisel JD. Microarray technology: beyond transcript profiling and genotype analysis. Nat Rev Genet 2006;7:200–10.
2. Armstrong SA, Staunton JE, Silverman LB,et al. MLL translocations specify a distinct gene expression profile that distinguishes a unique leukemia. Nat Genet2002;30:41–7.
3. Muro S, Takemasa I, Oba S,et al. Identification of expressed genes linked to malignancy of human colorectal carcinoma by parameteric clustering of quantitative expression data. Genome Biol2003;4:R21 4. Kim S, Dougherty ER, Chen Y,et al. Multivariate measurement of gene
expression relationships.Genomics2000;67:201–9.5. Duggan DJ, Bittner M, Chen Y,et al. Expression profiling using cDNA microarrays. Nat Genet1999;21:10–4.
5. Alexandre G de Brevern, Serge Hazout1 and Alain Malpertuy "Influence of microarrays experiments missing values on the stability of gene groups by hierarchical clustering" BMC Bioinformatics 2004, 5:114
6. Xian Wang, Ao Li, Zhaohui Jiang and Huanqing Feng "Missing value estimation for DNA microarray gene expression data by Support Vector Regression imputation and orthogonal coding scheme" BMC Bioinformatics 2006, 7:32
7. Jianjun Hu, Haifeng Li, Michael S Waterman and Xianghong Jasmine Zhou "Integrative missing value estimation for microarray data" BMC Bioinformatics 2006, 7:449
8. Dankyu Yoon1, Eun-Kyung Lee2 and Taesung Park "Robust imputation method for missing values in microarray data" BMC Bioinformatics 2007, 8(Suppl 2):S6
9. Magalie Celton, Alain Malpertuy, Gaëlle Lelandais, Alexandre G de Brevern "Comparative analysis of missing value imputation methods to improve clustering and interpretation of microarray experiments" BMC Genomics 2010, 11:15
10. Huihui Li, Changbo Zhao, Fengfeng Shao, Guo-Zheng Li, Xiao Wang "A hybrid imputation approach for microarray missing value estimation" From IEEE International Conference on Bioinformatics and Biomedicine (BIBM 2014) Belfast, UK. 2-5 November 2014
11. Hsiuying Wang, Chia-Chun Chiu, Yi-Ching Wu, Wei-Sheng Wu "Shrinkage regression-based methods for microarray missing value imputation" From 24th International Conference on Genome Informatics (GIW 2013) Singapore, Singapore. 16-18 December 2013 12. Yang Yang, Zhuangdi Xu and Dandan Song "Missing value imputation
for microRNA expression data by using a GO-based similarity measure" Yang et al. BMC Bioinformatics 2015, 17(Suppl 1):10
13. Fanchi Meng, Cheng Cai, and Hong Yan "A Bicluster-Based Bayesian Principal Component Analysis Method for Microarray Missing Value Estimation" IEEE journal of biomedical and health informatics, vol. 18, no. 3, may 2014
14. Ester, M., Kriegel, H. P., Sander, J., & Xu, X. (1996, August). A density-based algorithm for discovering clusters in large spatial databases with noise. In Kdd (Vol. 96, №34, pp. 226–231).
16.Little, R.J., Rubin, D.B., 2014. Statistical Analysis with Missing Data. John Wiley & Sons.
17.Julie Josse•Jérôme Pagès•François Husso " Multiple imputation in principal component analysis" Adv Data Anal Classif (2011) 5:231–246 18.Paul T. Spellman,Gavin Sherlock, Michael Q. Zhang, Vishwanath R. Iyer, Kirk Anders, Michael B. Eisen, Patrick O. Brown, David Botstein, and Bruce Futcher " Comprehensive Identification of Cell Cycle–regulated Genes of the Yeast Saccharomyces cerevisiae by Microarray Hybridization" Molecular Biology of the CellVol. 9, No. 12. 19.Dinesh Singh, et al. "Gene Expression Correlates of Clinical Prostate
Cancer Behavior". Cancer Cell, 1:203-209, March, 2002
20.Alan Wee-Chung Liew Ngai-Fong Law Hong Yan " Missing value imputation for gene expression data: computational techniques to recover missing data from available information" Brief Bioinform. 2011 Sep;12(5):498-513
AUTHORSPROFILE
K.Ishthaq Ahamed received M.Tech from Indian School of Mines, Dhanbad and presently working as Associate Professor in Computer Science and Engineering Department in G Pulla Reddy Engineering College, Kurnool.