This is a repository copy of Color naming transitions.
White Rose Research Online URL for this paper:
http://eprints.whiterose.ac.uk/83694/
Version: Published Version
Proceedings Paper:
Brasil, M, Westland, S and Pan, Q (2014) Color naming transitions. In: Proceedings of
22nd Color and Imaging Conference: Colour Science, Systems and Applications. 22nd
Color and Imaging Conference: Colour Science, Systems and Applications, 03-07 Nov
2014, Boston, Massachusetts USA. Society for Imaging Science and Technology , 155 -
158 (4).
[email protected]
https://eprints.whiterose.ac.uk/
Reuse
Unless indicated otherwise, fulltext items are protected by copyright with all rights reserved. The copyright
exception in section 29 of the Copyright, Designs and Patents Act 1988 allows the making of a single copy
solely for the purpose of non-commercial research or private study within the limits of fair dealing. The
publisher or other rights-holder may allow further reproduction and re-use of this version - refer to the White
Rose Research Online record for this item. Where records identify the publisher as the copyright holder,
users can verify any specific terms of use on the publisher’s website.
Takedown
If you consider content in White Rose Research Online to be in breach of UK law, please notify us by
Color Naming Transitions
Maria J.S.P. Brasil, Stephen Westland* and Qianqian Pan* Physics Institute, UNICAMP, Brazil
*School of Design, University of Leeds, UK
Abstract
We explore the notion that variations in cone spectral sensitivities could cause variations in color-name boundaries between individuals. Fifteen observers made color matches to a test stimulus (580 nm) with three primary lights in a visual colorimeter. The same observers took part in two psychophysical experiments to determine the color-naming boundary between two focal colors (yellow and green). In one experiment observers used a slider bar to indicate the boundary; in the other they were presented with a color stimulus and asked to state whether it was yellow or green in a 2afc design. In the case of the 2afc experiment the results indicate some evidence to suggest a correlation in the position of the name boundary and the ratio of red and green lights used in visual color matches.
Introduction
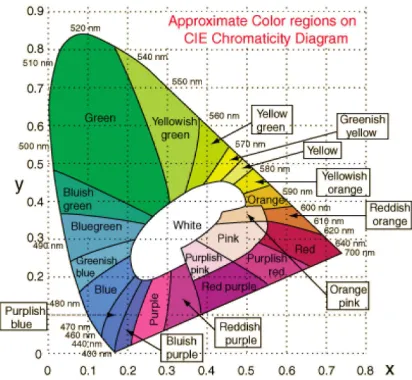
[image:2.612.74.280.419.609.2]The ability to associate labels to colors is very natural for humans [1]. Several attempts have been made to assign names to different parts of the CIE chromaticity diagram (and some other color spaces). For example the boundaries depicted in Figure 1 were adapted from a study by Kelly and Judd [2].
Figure 1: Typical categorization of the CIE chromaticity diagram into different color names.
Boynton and Olsen asked seven subjects to name 424 colors uniformly sampled from the OSA space [3]. Colors that were named according to one of the 11 basic color terms [4] were named faster than non-basic color terms. Sturges and Whitfield then
replicated these experiments in Munsell space though including more chromatic colors and more observers [5].
Attempts have also been made to model color-naming studies. For example, Lin et al., [6] derived a color-naming model to categorize all color coordinates in CIELAB color space into 11 basic color names. Later, Menegaz et al. [1] used a three-dimensional Delaunay triangulation of the CIELAB space to construct a model for color naming for the 11 basic color names. Another approach was to use a parametric model for automatic color naming where each color category was modeled as a fuzzy set [7].
There has been a long debate about the universality of color perception and the existence of cross-linguistic universals in color naming is still contested [4]. In 1969 Berlin and Kay [4] advanced the hypothesis that “a total universal of inventory of exactly 11 basic color categories exists from which the 11 or fewer basic color terms of any given language are always drawn.” The Berlin and Kay findings are contested and proponents of Whorfianism (who maintain that the structure of a language affects the way in which its speakers conceptualize the world – the so-called Sapir-Whorf hypothesis) point to weaknesses in the study; other researchers do not believe that the study supports universality at all [8]. Intriguingly, it has recently been suggested that language does affect color perception but primarily only in the right visual field via activation of language regions of the left hemisphere [9]. The recent literature on color naming has been dominated by these two major, but opposing views: that color categories are organized around universal foci and that color categories are determined at their boundaries by linguistic convention [10]. Philipona and O’Regan [9] have recently hypothesized that rather than being caused by neuronal representations of color or cultural/linguistic experiences, color categories could be explained by a third (biological) approach that takes in account only spectral properties of reflected light and the photo-pigments of the observer [11].
In this work we explore the notion that variations in cone spectral sensitivities could cause variations in color-name boundaries between individuals.
Experimental
primary light. Therefore, we can use the ratio of the intensities of the red and green lights used in the visual match to tell us something about the relative statistics of each observer’s L and M cone populations. Similar information could be obtained by recording the full color-matching functions; however, such an approach would be tedious and participants could become bored (and hence generate unreliable data) and is not necessary in this work.
[image:3.612.326.531.118.465.2]Figure 2 shows the cone fundamentals of the average observer [12] and the wavelength of the test stimulus that we used. It is evident that the test stimulus strongly activates both the L and M cones.
Figure 2: The Stockman and Sharpe cone fundamentals of the short-, medium- and long-wavelength sensitive cones in energy units normalized to 1. The wavelength of the test stimulus (580 nm) is highlighted and can be seen to strongly activate the L and
M cones.
Figure 3 shows spectroradiometric measurements of the primaries that were used in the visual colorimeter (upper pane), the test light that was used for matching (middle pane), and radiances of the RGB primaries in a display that we used for psychophysical experiments (lower pane).
Two psychophysical experiments were conducted to explore the boundaries between focal colors.
In Exp. 1 observers were presented with a strip of 20 colors on an LCD display. The colors at each end represented two of the focal colors used in the study and the 18 colors between the two ends showed a gradual transition from one focal color to the other. The first color of the strip at the left was repeated as the first small square. Observers were asked to denote the boundary between the two focal colors by selecting the right-most color on the strip that was still named with the same name as the focal color on the left (Figure 4). In Figure 4, the color that is shown above the strip of colors is the one that is currently selected by the position of the slider bar.
In Exp. 2 observers were presented with a single color patch and asked to indicate which of two colors names better described the patch in a 2-alternate forced-choice (2afc) design. The color of the patch was modified after each trial according to the observer response so that the majority of stimuli were close to the color
boundary (Figure 5). A psychophysical plot was derived and the point corresponding to a probability of 50% of selecting the color name as green/yellow was determined.
Figure 3: Spectroradiometric measurements of the display used for the psychophysical experiment (top), the primaries of the Tarrant visual colorimeter (middle), and the test colors that were
matched in the visual colorimeter (bottom).
The lower panel of Figure 3 shows the spectral radiance of the RGB primaries that were used in the display (HP DreamColor LP2480zx 30-bit display). Table 1 shows the RGB values of the focal colors that were explored.
[image:3.612.67.268.216.384.2]Figure 4: Screen-shot for Exp. 1. Observers used a slider bar to indicate the boundary between two colors.
Figure 5: Screen-shot for Exp. 2. Observers indicated whether the displayed color was one focal color (green) or another (yellow) in
a 2-alternate forced-choice design.
[image:4.612.308.565.115.186.2]Results
Figure 6 show the mean results (pooled over all observers) for each experiment and the error bars show +/- the standard deviations. For the colorimeter experiment, the mean value is the ratio between the red and green primary light intensities (R/G) from the color matching of the 580-nm test light. For the other three experiments (Exp. 1 at two intensity levels and Exp. 2) the mean value is what proportion of the way between yellow and green was denoted as the color-naming boundary. Note that the variability in the color-matching experiment is relatively large which might indicate a significant variability of the observers’ physiology.
Table 1: In the psychophysical experiments the participants were shown pairs of focal colors (green and yellow). The table shows the display RGB values (in the range 0-1) for of the focal
colors at two intensity levels referred to in the text as high intensity (first row) and low intensity (second row).
Green Yellow
R G B R G B
high
intensity 0 0.9 0 0.9 0.9 0
low
intensity 0 0.5 0 0.5 0.5 0
Figure 7 presents the results from our three experiments with 15 observers by presenting the relative positions of the Green-Yellow boundary determined by the experiments as a function of the R/G ratios from the colorimeter test at 580 nm.
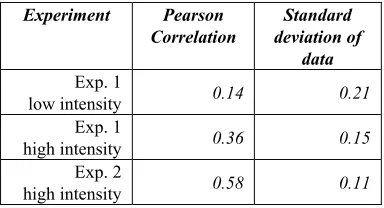
In this work we explore the notion that variations in cone spectral sensitivities could cause variations in color-name boundaries between individuals. The results from Exp. 2 give some evidence that variations on the cone sensitivities represented by the R/G ratios could affect the green-yellow color-naming boundary of the observers. However, note that in Exp. 1 there was no evidence of a correlation between the positions of the color-name boundaries and the R/G ratios. Table 2 summaries the correlations that were found. It also shows the standard deviations of the results from the fifteen observers. The standard deviations have two main sources; the actual variability between observers and random noise.
Figure 6: The mean scores for each of the experiments. For the colorimeter (color-matching) experiment the score is ratio R/G of red to green lights used in the match; for the other experiments the mean scores indicates a position between the two focal colors. The error bars are standard deviations for the data.
[image:4.612.77.269.291.422.2] [image:4.612.325.516.406.535.2]results suggest that a 2afc experiment is more appropriate to determine color-name boundaries.
[image:5.612.69.270.146.429.2]Figure 7: Scatter plots to show the scores from the three experiments against the corresponding ratios R/G of red/green lights used to match the stimulus at 580 nm for each observer.
Table 2: A summary of the correlation between the boundary experiments and the color-matching experiments. In the right-hand column, the inter-observer error is reported (as shown in Figure 6).
Experiment Pearson Correlation
Standard deviation of
data
Exp. 1
low intensity 0.14 0.21
Exp. 1
high intensity 0.36 0.15
Exp. 2
high intensity 0.58 0.11
Conclusions
In this work we explore the notion that variations in cone spectral sensitivities could cause variations in color-name boundaries between individuals. In one experiment there is some evidence that such a correlation exists. Observers who use more red in their match of a test stimulus at 580 nm place the color-name boundary between green and yellow closer to the yellow focal color. However, in the other experiment (carried out at two intensity levels) no such correlation is evident in the data. However, the higher standard deviations of observers’ data in this experiment could indicate that there was a higher amount of random noise in the data.
The work may contribute to the debate about whether color categories are organized around universal foci or determined at their boundaries by linguistic convention. The data (from one experiment, at least) are consistent with universality and with the additional idea that color categories could be explained by an approach that takes in account only spectral properties of reflected light and the photo-pigments of the observer [11].
References
[1] Menegaz G., Le Troter A., Sequeria J. and Boi J.M. (2007) A discrete model for color naming, EURASIP Journal on Advances in Signal Processing, 2007,29125.
[2] Kelly K. and Judd D. (1955) The ISCC-NBS color names dictionary and the universal color language, NBS Circular, 553, Nov.
[3] Boynton R.M. and Olson C.X. (1987), Locating basic colors in the OSA space, CRA, 12, 94-105.
[4] Kay P. and Regier T. (2003) Resolving the question of color naming universals, Proceedings of the National Academy of Sciences of the United States of America, 100 (15), 9085-9089.
[5] Sturges J. and Whitfield T.W.A. (1995), Locating basic colors in the Munsell space, CRA, 20 (6), 364-376.
[6] Lin H., Luo M.R., MacDonald L.W. and Tarrant A.W.S. (2001), A cross-cultural colour-naming study. Part III – A colour-naming model, CRA, 26 (4), 270-277.
[7] Benavente R., Vanrell M. and Baldrich R., (2009) Language, thought, and color: Whorf was half right, Trends in Cognitive Science, 13 (10), 439-446.
[8] Lucy J.A. (1997) The linguistics of “color”, in Color categories in thought and language, C.L. Hardin & L Maffi (eds.), 320-436, Cambridge University Press.
[9] Regier T. and Kay P. (2009) Language, thought, and color: Whorf was half right, Trends in Cognitive Science, 13 (10), 439-446. [10] Regier T., Kay P. and Khetarpal N. (2007) Color naming reflects
optial partitions of color space, Proceedings of the National Academy of Sciences of the United States of America, 104 (4), 1436-1441. [11] Philipona D.L. and O’Regan J.K. (2006), Color naming, unique hues,
and hue cancellation predicted from singularities in reflection properties, CRA, 26 (4), 270-277.
[image:5.612.80.272.553.657.2]