http://eprints.whiterose.ac.uk/105444/ Version: Accepted Version
Article:
Chinelatto, A.L., Boulahya, K., Perez-Coll, D. et al. (6 more authors) (2015) Synthesis of a 12R-type hexagonal perovskite solid solution Sr3NdNb3-xTixO12-delta and the influence of acceptor doping on electrical properties. Dalton Transactions, 44 (16). pp. 7643-7653. ISSN 1477-9226
https://doi.org/10.1039/c5dt00170f
[email protected] https://eprints.whiterose.ac.uk/
Reuse
Unless indicated otherwise, fulltext items are protected by copyright with all rights reserved. The copyright exception in section 29 of the Copyright, Designs and Patents Act 1988 allows the making of a single copy solely for the purpose of non-commercial research or private study within the limits of fair dealing. The publisher or other rights-holder may allow further reproduction and re-use of this version - refer to the White Rose Research Online record for this item. Where records identify the publisher as the copyright holder, users can verify any specific terms of use on the publisher’s website.
Takedown
If you consider content in White Rose Research Online to be in breach of UK law, please notify us by
This is an Accepted Manuscript, which has been through the Royal Society of Chemistry peer review process and has been accepted for publication.
Accepted Manuscripts are published online shortly after
acceptance, before technical editing, formatting and proof reading. Using this free service, authors can make their results available to the community, in citable form, before we publish the edited article. We will replace this Accepted Manuscript with the edited and formatted Advance Article as soon as it is available.
You can find more information about Accepted Manuscripts in the
Information for Authors.
Please note that technical editing may introduce minor changes to the text and/or graphics, which may alter content. The journal’s standard Terms & Conditions and the Ethical guidelines still apply. In no event shall the Royal Society of Chemistry be held responsible for any errors or omissions in this Accepted Manuscript or any consequences arising from the use of any information it contains.
Accepted Manuscript
Transactions
1
Synthesis of a 12R-type Hexagonal Perovskite Solid Solution
Sr
3NdNb
3-xTi
xO
12-and the Influence of Acceptor Doping on Electrical
Properties
Adilson L. Chinelattoa,b, Khalid Boulahyac, Domingo Pérez-Colla, Ulises Amadord, Corina Tabacarua, Simon Nichollse, Markus Hoelzelf, Derek C. Sinclaire,
Glenn C. Mathera*
a Instituto de Cerámica y Vidrio, CSIC, Cantoblanco,28049 Madrid, Spain
bDepartamento de Engenharia de Materiais, Universidade Estadual de Ponta Grossa, Av. Gal. Carlos
Cavalcanti, 4748, 84030-900- Ponta Grossa-PR, Brazil
cDepartamento de Química Inorgánica I, Facultad de Ciencias Químicas, Universidad Complutense,
Ciudad Universitaria, 28040 Madrid, Spain
dFacultad de Farmacia, Departamento de Química, Urbanización Monteprincipe, Universidad CEU San
Pablo, Boadilla del Monte, 28668 Madrid, Spain
e
Department of Materials Science & Engineering, Sir Robert Hadfield Building, University of Sheffield, Mappin Street, Sheffield S1 3JD, United Kingdom
f Forschungsneutronenquelle Heinz Maier-Leibnitz(FRM II),Technische Universität München,
Lichtenbergstrasse 1, D-85747 Garching, Germany
*e-mail address: [email protected] Tel.: + 34 917355840
Fax.: + 34 917355843
Abstract
A solid solution forms for Sr3NdNb3-xTixO12-with approximate limits 0 ≤ x ≤ 0.06. The
system crystallizes with a 12R-type hexagonal perovskite structure in space groupR , 3 as determined by neutron diffraction and selected area electron diffraction. The electrical properties of the end members have been investigated by impedance spectroscopy in the temperature range 550800 °C in various gas atmospheres and as a function of oxygen and water-vapour partial pressure. Proton transport dominates in wet oxidising conditions in the temperature range 550 to 700 °C, as confirmed by the H+/D+ isotope effect. Acceptor doping considerably enhances proton conductivity with a value of 3.3 × 10⁻⁶ Scm-1 for the bulk response of x = 0.06 at 700 °C in moistened air. The presence of a ¼ slope for both doped and undoped samples in the range 10-19≤ pO2≤
10-8 atm at 900 °C indicates n-type transport in reducing conditions following the extrinsic model attributable to acceptor centres. The conductivity is essentially independent of pO2 at 600 °C in dry oxidising conditions, consistent with oxide-ion
transport; a positive power-law dependence at higher temperature indicates extrinsic behaviour and a significant electron-hole contribution. The dielectric constant at RT of nominally stoichiometric Sr3NdNb3O12 is r ~ 37, with a moderately high quality factor
of Q × f ~ 16400 GHz at fr ~ 6.4 GHz. The temperature coefficient of resonant
Dalton
Transactions
Accepted
2
frequency of x = 0 is f ~ 12ppm/°C, which lowers to -3 ppm/°C for the Ti-doped phase
x = 0.06.
Keywords: Proton conduction, microwave dielectric, crystal structure, acceptor centre, octahedral tilting, defect analysis
Dalton
Transactions
Accepted
3 1. Introduction
Oxides derived from the perovskite structure (ABO3) are probably the most
widely studied class of compounds in solid-state chemistry. The ability of the perovskite structure to accommodate the majority of cations in the periodic table, with ranging compositions, leads to an extremely diverse array of physical properties, encompassing electrical, magnetic, dielectric, optical and catalytic applications.
Perovskites may be classified structurally according to close packing of the AO3
layers. Cubic close packing (ccp) gives rise to the familiar cubic perovskite structure in which all BO6 octahedra share corners. Hexagonal close packing (hcp) is characterised
by face-sharing octahedra with the cation sites in close proximity. Different combinations of ccp and hcp stacking sequences with both corner- and face-sharing octahedra lead to a rich structural and compositional complexity within the hexagonal-perovskite family [1,2]. The nomenclature employed to describe the unit cells of the family members includes the number of AO3 layers per cell and a symbol to describe
the unit-cell symmetry.
Proton transport in perovskite oxides is of considerable interest for applications in high-temperature electrochemical devices such as proton-conducting solid oxide fuel cells (protonic ceramic fuel cells, PCFCs) and ceramic hydrogen-permeation membranes 3–5. The best proton-conducting perovskites have large A2+ and B4+ cations, such as Ba2+ and Ce4+,and are doped on the B site with a lower valence cation (typically Y3+) to form oxygen vacancies in the dry state. A number of interdependent factors involving the constituent cations and perovskite lattice have varying degrees of influence on the proton transport, including basicity, molar volume, tolerance factor and symmetry 3,4,6. The key properties of high conductivity and good stability are, however, somewhat incompatible, making the search for better materials, including the
exploration of other structure types 7, highly relevant. In this regard, we recently reported that modest proton conductivity is observed in humid, oxidising atmospheres for the 12R-type hexagonal perovskite Sr3LaNb3O12 (12 AO3 layers, rhombohedral
symmetry) 8, which is, to our knowledge, the first report of proton transport in a cation-deficient perovskite, AxB1-xO3x.
Whereas the use of perovskites in ion-conducting applications at high temperatures is very promising, their employment as dielectric materials in ambient conditions is critical to state-of-the-art electrical components such as tunable microwave devices, for which the required properties are moderate to high permittivity, low
Dalton
Transactions
Accepted
4 dielectric losses and negligible temperature variation of the resonant frequency ( f ~ 0
ppm /K) 9,10. The structure-property relations of hexagonal perovskites, although less well understood than the ccp counterparts 11, are receiving increasing attention in this regard 12,13. Sr3LaNb3O12 has recently been investigated as a good low-loss dielectric
material for resonators and filters 14,15. Here again, the interplay among the polarisability of the constituent cations, tolerance factor and degree of octahedral tilting play fundamental roles in the observed properties 14,16.
In this paper, we have undertaken a first, wide-ranging study of the structural and electrical properties of the hexagonal perovskite Sr3NdNb3O12. Neutron diffraction
and selected area electron diffraction, in addition to high resolution transmission electron microscopy, are employed to analyse the crystal structure. The range and effects on properties of doping with the lower valence Ti cation on the Nb site (so-called acceptor doping) are examined. Electrical characterisation focuses on both high-temperature transport and the low-high-temperature, microwave-dielectric properties, highlighting the role of acceptor centres on the electrical behaviour.
2. Experimental
Sr3NdNb3O12 (SNN) and Ti-doped phases Sr3NdNb3-xTixO12-(0 ≤ x ≤ 0.1) were
prepared by solid-state reaction from dried precursors of SrCO3, Nd2O3 Nb2O5 and TiO2
(all Sigma Aldrich, 99.9% purity or higher) in the appropriate stoichiometric ratios. The reagents were firstly milled in acetone in an agate mortar, dried, and calcined at 1100 °C for 12 hours. Mixtures were subsequently fired at 1250 °C for 24 hours with intermediate grinding in an agate mortar, then attrition milled in isopropanol in teflon vials with ZrO2 balls, dried and sieved. Pellets were uniaxially pressed from this powder
and fired in the range 13001500 °C in air for up to 12 hours.
Completeness of reaction and phase purity were confirmed by powder X-ray diffraction (XRD) with a Bruker D8 diffractometer equipped with a solid-state rapid
LynxEye detector, using monochromatic Cu K1 radiation obtained with a Ge
monochromator. The microstructure of polished surfaces, thermally etched at 1450 °C, were analysed by scanning electron microscopy (SEM) with a Zeiss DSM400 instrument.
For Rietveld refinement of the crystal structure, neutron-diffraction data were collected on the high-resolution powder diffractometer SPODI 17
Dalton
Transactions
Accepted
5 (Forschungsneutronenquelle Heinz-Maier Leibnitz (FRM II), Garching, Munich,
Germany) over the scattering angle range 3 ≤ ≤154°. A wavelength of = 1.5484 Å was selected using a Ge (551) monochromator. Structural models were refined with the Fullprof software package 18.
The density of ceramics sintered at 1400 °C or greater was measured by the Archimedes method on displacement of water and was > 94% of the theoretical value. Porous pellets were also prepared for the purpose of measuring the pO2 dependence of
electrical conductivity at 900 °C, and for temperature-dependence conductivity measurements in reducing conditions where stabilisation with the atmosphere was found to be sluggish. For these samples, a porosity correction was made based on
Archie’s law 19,20
:
(1)
where Bappis the apparent bulk conductivity,
B
is the intrinsic bulk conductivity, P is
the porosity of the sample and m is a constant based on geometric considerations (m ~ 2).
Samples for high-resolution transmission electron microscopy (HRTEM) were ground in n-butyl alcohol and ultrasonically dispersed. A few drops of the resulting suspension were deposited on a carbon-coated grid. Selected-area electron diffraction (SAED) and HRTEM were performed with a Jeol 300 FEG transmission electron microscope working at 300 kV.
For electrical-conductivity measurements, the pellets were lightly polished with SiC paper then coated with Au paste and fired at 950°C for 1 hour in air to remove the organic content, harden the Au and attach it to the pellet faces. Microwave dielectric
measurements were performed on pellets sintered at 1500 °C for 6 h (x = 0) or 12 h (x = 0.06) with a relative density of ~ 98%.
High-temperature electrical-conductivity measurements were carried out with an Autolab PGStat302N impedance spectrometer employed in potentiostatic mode with a
signal amplitude of 300 mV over the frequency range 1 ≤ f ≤ 106 Hz. The temperature dependence of conductivity was determined from data collected on cooling in steps of
50 or 100 °C in the temperature range 550 800 °C in wet and dry air atmospheres. Dry
gases were fed from the bottle through a drying column containing a commercial
Dalton
Transactions
Accepted
6 moisture trap of aluminosilicate- and zeolite-based beads. For wet atmospheres, gases were firstly bubbled through H2O or D2O (Apollon Scientific, 99.9%) at room
temperature to provide a water content of ~ 0.03 atm 21.
The pO2 dependence of conductivity in the range 6.5 × 10⁻³ pO2 1 atm was
measured by impedance spectroscopy on mixing different ratios of dried flows of O2
and N2 via electronic mass-flow controllers (Bronkhorst); the actual pO2 was monitored
with an yttrium-stabilised zirconia sensor situated adjacent to the sample, and attached to an external voltmeter with Pt electrodes. Similarly, the pH2O dependence of
conductivity in the range 10-3 pH2O 10-1.5 atm was measured on mixing different
ratios of dry and wet flows of air via the mass-flow controllers. To measure the pO2
dependence of conductivity in reducing conditions, isothermal impedance measurements on porous pellets of x = 0 and 0.06were collected as a function of pO2 in
a similar manner to that reported previously 8,22; this method was adopted since mixing of hydrogen with a diluting gas (e.g. N2) does not provide ready accessibility to
incremental changes in pO2 in the reducing range. The porous pellets were employed to
enhance the equilibration times with the gas ambient. The cell was firstly equilibrated in dry 10% H2:90% N2 over a period of 2 days until the sample resistance had stabilised;
the gas flow was then switched off and the chamber allowed to equilibrate over several
days with the outside air. The pO2 was measured in intervals of 20 minutes or longer
with the yttrium-stabilised zirconia sensor. Analysis of impedance spectra was performed with the Zview 2.9c software (Scribner Associates) by fitting the data to appropriate equivalent circuits to resolve the response into bulk, grain-boundary and electrode contributions.
The MW dielectric properties were measured with an HP8510 Vector Network
Analyser. r at MW frequencies was determined by the resonant-post method. The
dielectric loss, Q, of the samples was measured using a transmission resonant cavity technique with an Au-coated brass cavity and fuse silica support employing a resonance
frequency of ~ 6GHz. The temperature coefficient of resonance frequency ( f) was
registered for five temperatures in the range 25-84 °C.
3. Results and Discussion
3.1 Phase Analysis and Solid-solution Formation
Dalton
Transactions
Accepted
7 The X-ray powder pattern of SNN sintered at 1500 °C for 6 hours showed the formation of a single phase which could be indexed by analogy with Sr3LaNb3O12 on a
hexagonal unit cell in space groups R or 33 R m . The synthesis of Sr3NdNb3O12 has
previously been described by Averkova et al. 23 who documented the formation of the series Sr3LnNb3O12 (Ln = La – Nd); however, to date no structural characterisation of
the Nd member has been reported. No secondary phases were identified in the XRD powder pattern or corresponding scanning electron micrographs.
The introduction of defects in metal oxides via substitution with aliovalent cations is widely exploited to induce functionality, including desirable electrical properties. The charge-compensation mechanism on substitution with a lower-valence cation involves the formation of one or more type of positively charged defect, commonly including mixed-cation valence states, oxide-ion vacancies, or protons when the vacancies become hydrated. As mentioned earlier, we recently reported proton transport in Sr3LaNb3O12 for nominally stoichiometric and acceptor-doped phases 8. In
the present work, solid-solution formation on substituting Nb with Ti according to the
series Sr3NdNb3-xTixO12- was examined. Single-phase material was obtained for x =
0.06 by XRD on final firing at 1500 °C for 12 hours, whereas experimentation with shorter firing times (6 h) or higher Ti contents (x ≥ 0.1) resulted in the presence of
second phases. Hence, the composition Sr3NdNb2.94Ti0.06O12- is expected to be close to
the solid-solution limit for Ti doping on the Nb site.
Scanning electron micrographs of a thermally etched surface of
Sr3NdNb2.94Ti0.06O12- are shown in Fig. 1 at two magnifications; no secondary phases
were observed in accordance with the XRD phase analysis. The microstructure is composed of tightly packed platelets with a typical width of several microns and a thickness of the order of a micron; the platelets are generally much more elongated than those found in Sr3LaNb3O128. The absence of cracks and open porosity are apparent in
the micrographs. Similar micrographs, revealing a dense, microstructure of platelet-shaped grains, were obtained for Ti-doped and undoped samples, independent of the final atmospheric treatment.
3.2 Crystal Structure
As is widely known, tilting of the BO6 octahedra of perovskite oxides involving
slight movements of the oxygen positions may lead to a lowering of the space-group
Dalton
Transactions
Accepted
8 symmetry which is difficult to detect by X-ray diffraction due to the low X-ray scattering length of oxygen 24. The oxygen sublattice is a much stronger scatterer of neutrons and electrons; however, whereas weak superlattice phenomena may still be
difficult to observe by neutrons, electron diffraction is more sensitive to weak short-range reflections 25. Consequently, SAED was employed to investigate the space group, accompanied by examination of the defect structure via collection of images by
HRTEM. The space group of SNN was verified as R or 33 R m by SAED. High-resolution transmission electron microscopy images projected along the [0 1 0] and [0 0 1] zone axes are shown in Fig. 2. The corresponding Fourier transform images along both zone axes, provided as insets, show a well-ordered material of rhombohedral symmetry with d-spacings of 4.9 and 27.1 Å, corresponding to d100 and d001
respectively. Contrast variation of the [010] zone axis image clearly shows the atomic positions: bright dots correspond to rows of Sr/Nd and Nb atoms, as superimposed in Fig. 2(a). No ordering between Sr and Nd was observed. An image calculation was performed employing the refined atomic parameters of SNN (see next section). The
simulated image (inset in Figure 2(a)) provides a good fit to the experimental image at
t = 30 Å and f = -350 Å.
Neutron powder diffraction (NPD) was undertaken to perform a more detailed structural refinement, not only for the much higher sensitivity to subtle oxygen movements in comparison to X-ray diffraction but also because the platelet-shaped grains of the SNN and Ti-doped SNN compositions resulted in excessive preferred orientation for in-house XRD patterns which proved difficult to model successfully. Analogous to the La-containing analogue, refinement of the NPD data of SNN was
performed more successfully in space group R (R3 wp = 5.05%) rather than inR3 (Rm wp
= 22.8%) , the difference in the space groups residing in the allowance for octahedral tilting in the former. A non-assigned small peak was observed in the NPD pattern at 38.6 °2 for the x = 0.06 sample, and corresponds to metallic Nb from the experimental
setup. Structural parameters for the Sr3NdNb3-xTixO12- end members and agreement
factors on refinement of NPD data are listed in Table 1. The observed NPD pattern of SNN and the difference pattern between observed and calculated data are shown in Fig. 3.
The refinements indicate occupation of the A1 site by Nd and Sr in approximately equivalent amounts and full occupation of the A2 site by Sr. In contrast
Dalton
Transactions
Accepted
9 to the case of Sr3LaNb3O128, there was no evidence for the presence of a slightly higher
Sr content on the A1 site which could explain the acceptor-dopant behaviour of the nominally undoped phase (discussed in section 3.3). Nevertheless, Sr and Nd have
comparable neutron scattering lengths and the minor quantities of acceptor dopant required to control the defect concentrations and thereby influence the electrical properties may be difficult to determine employing diffraction methods. The Ti-doped sample attained the lowest refinement parameters on location of Ti on the Nb(2) site and the oxygen vacancies on the O(1) site.
A schematic diagram of the ion arrangement in Sr3NdNb3O12 is shown in Fig.
4(a). The structure consists of the stacking of four (hhcc)3 sequences of AO3
close-packed layers along the c axis of the unit cell. Nb(1) and Nb(2) ions are located between ccp and hcp layers and between two ccp layers, respectively, whereas the cation sites between adjacent hcp layers are vacant. This gives rise to blocks of three-layer-thick, corner-sharing octahedra (Nb(1)O6-Nb(2)O6-Nb(1)O6) with B-cation
vacancies occurring every fourth layer. Successive octahedral blocks are shifted by a vector (“shift”-type structure 26). The Nb(2)O6 octahedra in the centre of the
layers are perfectly regular and undistorted; however, the Nb(1) ions are displaced along the c axis towards the adjacent cation vacancies, giving rise to highly distorted Nb(1)O6
octahedra, as shown in Fig. 4(b); selected bond lengths, octahedral distortions and additional structural information are provided in Table 2. The mixed Nd/Sr(1)-occupied sites are situated within the layers of corner-sharing octahedral blocks, and the Sr(2) sites are located adjacent to the B-site vacancies.
In space group R , the octahedra of the three-layer blocks are tilted along the 3
Cartesian x, y and z axes of the pseudocubic subcell according to the a-a-a- tilt system (Glazer notation27). That is, there are three anti-phase tilts of equal magnitude around the pseudo-cubic directions, as illustrated schematically in Fig. 4(c) for a fragment of the three-layer-thick block projected down the c axis of the unit cell. The octahedral tilts, listed in Table 2, were estimated from the N(1)-O(1)-Nb(2) bond angle ( ), obtained from the neutron data as (180 – )/2.
3.3 High-temperature Electrical Characterisation
Complex impedance, Z* plots of Sr3NdNb3-xTixO12- (x = 0, 0.06) in oxidising
conditions at high temperature (550800°C) were dominated by a large, slightly
Dalton
Transactions
Accepted
10 depressed, high-frequency arc accompanied by a poorly resolved low-frequency response, Fig. 5. The large arc was modelled by a single RQ element with an estimated
capacitance of . A value of 4.6 pFcm-1 was calculated at 700 °C in air, typical of a bulk contribution for samples with r ~101-2 28. As is the case for the
La-containing analogue 8, there is clear evidence of proton transport from the impedance spectra, as indicated by both the higher conductivity in wet in comparison to dry conditions and the observance of a conductive isotope effect; the conductivity in air moistened with H2O at 700 °C is a factor of 1.15 greater than that measured in D2
O-wetted air.
The temperature dependence of the bulk electrical conductivity for Sr3NdNb 3-xTixO12- (x = 0, 0.06) in dry air and air humidified with H2O and D2O is shown in Fig.
6; data for Sr3LaNb3O12 and Sr3LaNb2.9Ti0.1O12- in wet air taken from ref. 8 are also
plotted for comparison. Both the conductivity in wet air and the difference in conductivity between wet and dry regimes for SNN increase significantly on Ti doping. The introduction of the lower-valence Ti dopant directly increases proton transport through the hydration of oxygen vacancies and the creation of mobile protons in accordance with the equilibrium
(2)
where the mass-action law relates the concentration of the species by means of the corresponding equilibrium constant KW according to
(3)
The inset of Fig. 6 shows the greater magnitude of the isotope effect in moistened air for the Ti-doped as compared to the undoped sample, resulting from a greater contribution of protonic carriers to transport in the Ti-containing material. The effect of increasing temperature is to diminish the conductive isotope effect as a result of the exothermic nature of the above equilibrium, which results in a lower proton content and a higher concentration of competing charge carriers (discussed below). A further manifestation of this is the smooth transition to a slightly higher activation-energy, Ea, regime with
Dalton
Transactions
Accepted
11 increasing temperature in the Arrhenius plots; this behaviour is fairly typical of oxide proton conductors 29.
The activation energies in wet and dry oxidising conditions, listed in Fig. 6, were
calculated in the temperature range 550700 °C where proton transport is expected to
dominate and before any discernible inflection to a higher activation-energy regime
takes place. Both end-members of the Sr3NdNb3-xTixO12- series exhibited slightly
greater Ea values in D2O-containing air, 0.84 and 0.92 eV for x = 0 and 0.06,
respectively, in comparison to wet air, the difference ( ~ 0.030.07) being approximate
to that expected between proton and deuteron hopping 3. The activation energies in wet oxidising conditions for the Nd-containing series are somewhat lower than those observed in Sr3LaNb3O12 (0.93-1.13eV, ref 8); however, the effect of adding Ti dopant
to the Nd series is not to lower the Ea for proton conduction with respect to the undoped
phase, as was observed on doping Sr3LaNb3O12. It is notable that conductivity is higher
in wet oxidising conditions for the Ti-doped, Nd-containing phase (x = 0.06) in comparison to the La-containing analogue with x = 0.1, despite a lower acceptor dopant level. The reasons for this are not readily apparent. One possible explanation could be that proton hopping distances to neighbouring oxygen sites are slightly shorter due to the smaller ionic radius of Nd resulting in a smaller Sr3NdNb3O12 unit cell compared to
the larger La ion in Sr3LaNd3O12.
The electrical-conductivity dependencies of selected partial-pressure variations
of the Sr3NdNb3-xTixO12- system are shown in Fig. 7. In dry oxidising conditions, Fig.
7(a), the positive conductivity dependence on pO2 at 800 °C is suggestive of a p-type
contribution to transport. Under these conditions, oxidation is expected to occur according to (Kröger-Vink notation)
(4)
giving the mass-action expression
(5)
Dalton
Transactions
Accepted
12 where Ko is the mass-action constant for the oxidation reaction. Assuming that the
oxygen vacancies are the major positive carriers, the charge-neutrality condition in this region is
(6)
and combining with eq. (5) gives the number of electron-hole charge carriers and
conductivity as proportional to 30,31. The value of the exponent at 800 °C (pO20.14) thus indicates a significant contribution from electron holes to transport. In
contrast, the pO2 dependence of conductivity is close to zero at 600 °C, suggesting the
conductivity is dominated by oxide-ion charge carriers at this temperature, the concentration of which is effectively independent of pO2. The exponent of 0.14 at 800
°C, lying between the values expected for pure p-type and pure oxide-ion conductivity,
is, therefore, reflective of mixed p-typeand oxide-ion transport. The higher
activation-energy regime in the Arrhenius plots, which evolves with increasing temperature in wet conditions, Fig. 6, can thus be understood to result from an increasing contribution of
both oxide-ion and p-type charge carriers on the exothermic loss of protonic charge carriers.
In conditions of low pO2, the equilibrium loss of oxygen is expressed by the
reduction reaction
(7)
and corresponding mass-action expression
(8)
where Kr is the mass-action constant. It follows that the number of electron charge
carriers n and thereby conductivity is proportional to when reduction is the
major source of defects (intrinsic model, refs. 30,32) and charge neutrality is approximated by
(9)
Dalton
Transactions
Accepted
13 In less extreme reducing conditions, the charge-neutrality condition is represented by eq. (6) which, on substituting into the mass-action expression (eq. (8)), shows that n is
proportional to , according to the extrinsic model for defect formation 30–32. The pO2 dependencies of conductivity of SNN and Ti-doped SNN in reducing conditions,
Fig. 7 (b), are thus n-type, as revealed by a negative power-law relationship with a
gradient close to the theoretical value for pure n-type transport of ¼ in the range 10-8 pO2 10-23 atm at 900 °C. The isothermal measurement was performed at this
temperature to limit any possible influence of protons on the determined dependency. The change in slope, closer to a -1/6 dependence, occurring below this range, (< 10–23 atm) is likely to result from intrinsic defect formation whereupon the reduction reaction (eq.(7)) is the major source of defects.
The behaviour presented by SNN in reducing conditions is consistent with that
of both nominally undoped BaTiO3 and Sr3LaNb3O12 8,30. The ¼ power-law
dependence of the former phase has been attributed to small amounts of acceptor impurity A on the perovskite B site. Equally, we speculated in our earlier work on the hexagonal perovksite Sr3LaNb3O128that “self doping” of the La/Sr A1 site with a slight
excess of Sr would also result in the generation of positive oxygen-vacancy defects. In the case of the La-containing analogue, it was argued that such off-stoichiometric behaviour results in excess La which may be present as surface La(OH3).
In wet oxidising conditions, in the temperature range encompassed by the low-activation-energy regime below 700 °C (Fig. 6), the defect concentration is principally dependent on the hydration reaction eq. (2), whereby the acceptor centres are charge compensated by protons and oxygen vacancies:
(10)
Assuming the above electroneutrality condition, when acceptor dopants are charge
compensated principally by oxygen vacancies ( protons as a minority defect exhibit a concentration dependence of p(H2O)½29; on the other hand, if protons
are the majority charge-compensating defect ( , proton conductivity is
independent of the water-vapour partial pressure ( . The protonic
conductivity dependency with p(H2O)0.20 at 800 °C for SNN, Fig. 7 (c), lies
Dalton
Transactions
Accepted
14 between these two limiting defect situations. We note that although this dependency is a further indication of proton transport in wet oxidising conditions, the component is likely to be partially influenced by the presence of competing positive charge carriers
(oxide ions and electron holes) as analysed below.
3.4. Numerical analysis of defect equilibria
The experimental conductivity results were further examined employing solution of the expected defect equilibria. Under wet oxidising conditions, the concentration of different species is governed by simultaneous equilibria of equations (2) and (4), with the general electroneutrality condition expressed as
(11)
Recombination of eqs. (3), (5) and (11) provides a relation between the concentration of all the species in a unique polynomial equation according to
(12)
where
(13)
(14)
and
(15)
The solution of Eq. (12) for various values of pH2O gives the defect profiles for each
species according to Eqs. (13)-(15). We note that the approximation used in the analysis
considers that X O
[O ] is constant and that the concentration of n-type carriers is negligible
under the studied oxidising conditions. The estimation of the concentration of the various defects was performed by assuming values of equilibrium constants for Eqs. (3) and (5) consistent with those previously reported for perovskite-based protonic conductors 33–35; Table 3(a) lists the equilibrium constants employed in the current fitting compared to previously employed values for similar systems. After obtaining the
Dalton
Transactions
Accepted
15 defect profiles, the conductivity of the various transport species as a function of pH2O
was simulated by assuming relations between the mobility of carriers similar to those reported in the literature 34 (Table 3(b)). The mobilities were slightly modified in order to obtain a suitable fitting of total conductivity with the experimental results as a function of both pH2O and pO2 in dry conditions.
The simulated conductivity associated to the different carriers, fitted according to the criteria mentioned above, and comparison with the experimental results of total conductivity are shown in Figs. 8 and 9 for x = 0 and x = 0.06, respectively. The simulated conductivities of the different species as interpreted by the defect chemistry, although only representing estimations of the transport behaviour, fit the experimental data very well. The fitting results indicate that the total conductivity under wet conditions is mainly governed by protons in wetter atmospheres; however, their contribution to transport decreases drastically as pH2O decreases, with concomitant
increases in contributions from oxide ions and electronic carriers. Considering that the presence of protonic defects requires the existence of oxygen vacancies in the dry state, which are hydrated on exposure to wet atmospheres according to Eq. (2), the simulated results corresponding to x = 0 were obtained with an acceptor-centre content of 0.013. These acceptor centres, a requirement for the charge-compensation of positive defects (Eq. 11), are indicated to be present by the pO2 power-law dependencies of conductivity
(Fig. 7). As mentioned previously, the presence of acceptor centres in the undoped phase may arise from unavoidable acceptor impurities or self-doping of Sr on the Nd
site.
3.5 Microwave-dielectric measurements
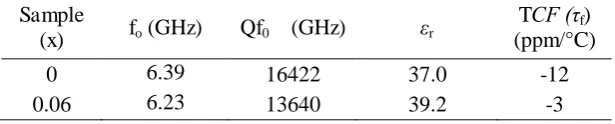
The microwave-dielectric properties of Sr3NdNb3-xTixO12 (x = 0 and 0.06) are
listed in Table 4. The relative permittivity, r ~ 3739, is only marginally higher than
that of Sr3LaNb3O12 ( r ~ 36) 14, which is to be expected based on the similar
polarisability of the constituent cations 36,37. The Q × f value of the title phase is, however, somewhat lower than the varied values measured for SLN (23,500 GHz, ref. 14; 45,327 GHz ref 15). The effect of Ti doping on SNN is to introduce additional dielectric loss, probably attributable to the much greater concentration of point defects (principally oxygen vacancies). Neither of the Nd-containing materials offer a Q × f value that could be considered competitive with commercial high-performance
dielectric materials with r ~ 35 -40. The presence of acceptor centres in both the title
Dalton
Transactions
Accepted
16 phase and Sr3LaNb3O12, which has been seen to heavily influence the high-temperature
electrical behaviour via the electroneutrality condition represented by eq. (6), are likely to contribute to the dielectric loss. Hence, sample processing may have a significant
influence on the measured Q × f value 38. Indeed, this appears to be the case for the La-containing analogue, as expounded by the divergence of the values quoted in different studies. Moreover, texturing of the platelet structure of these materials may have a dramatic impact on limiting the dielectric loss 39.
The f value is low for both samples but is also sensitive to the dopant content,
lowering to only -3 ppm / °C for the sample x = 0.06 (Table 4). Whereas f in many
3C-type ABO3 perovskites is influenced by the tolerance factor and the tilt system of the
BO6 octahedra 11, the structure–property relations in hexagonal perovskites are less well
understood. However, Sinclair and co-workers 14 have shown that a lower tolerance factor and larger tilt angle in Sr3LaNb3O12 compared to Ba3LaNb3O12 (BLN) increases
the transition temperature to an untilted system (Ttilt) thereby lowering both r and the
gradient of r versus temperature, correlated with a lowering of the magnitude of f
from -100 (BLN) to -5 ppm/°C (SLN). Here, the effect of lowering the tolerance factor (Table 2) in the Nd-containing analogues also appears to lower f considerably in
comparison to BLN, whereas the much slighter differences in f between SLN and the
Nd-containing phases do not directly correlate with tolerance factor and may be attributable to additional factors such as processing conditions.
4. Conclusions
The observance of moderate levels of proton conductivity in Sr3NdNb3O12 is the
second such example in a 12R-type hexagonal pervoskite and suggests the presence of protonic defects in this structure type and related hexagonal perovskites may be quite widespread. The protons are introduced in the nominally undoped phase by acceptor centres arising from unavoidable acceptor impurities or over stoichiometry of Sr on the A1 site. These acceptor centres also control the defect behaviour in reducing conditions, as revealed by a power-law dependence on pO2 of -¼ in the range 10-19 pO2 10-8
atm in accordance with defect formation via the intrinsic model. In dry, oxidising conditions, the conductivity is principally via oxide-ion vacancies at 600 °C with p-type
charge carriers contributing to transport at higher temperature. On introducing
significant quantities of acceptor dopant via the solid solution Sr3Nb3-xTixO12-(0 ≤ x ≤
Dalton
Transactions
Accepted
17 0.06), conductivity increases substantially, whether via protons (wet oxidising conditions) or oxide-ions and p-type charge carriers (dry oxidising conditions).
Sr3NdNb3O12 exhibits a moderately high permittivity, ~ 37, a quality factor Q
× f ~ 16400 GHz (at 6.3 GHz) and low coefficient of resonant frequency, f ~ 12ppm
/°C. The effects of acceptor doping with Ti on the Nb site are to lower the quality factor
to ~13600 and f to near-zero ( f ~ 3ppm /°C). The higher dielectric loss in the Ti-doped
phase most probably results from a much higher concentration of point defects. Dielectric loss in the undoped phase may be improved by changes in the processing which limits the role of acceptor impurities and optimises the highly oriented platelet-like microstructure.
Acknowledgements
We thank CAPES (Brazil, project no. BEX 9119/11-6), MINECO (Spain, ENE2012-30929) and CSIC (Spain, i-link0743) for funding.
Dalton
Transactions
Accepted
18 Table1. Structural parameters for Sr3NdNb3-xTixO12- obtained from NPD data
Sr3NdNb3O12a Sr3NdNb2.94Ti0.06O12-b
ah (Å) 5.64213(3) 5.63855(6)
ch (Å) 27.1506(2) 27.1452(4)
Sr(1)/Nd(1) position 6c
Occ Sr/Nd 0.5/0.5 0.5/0.5
z 0.28499(9) 0.2845(1)
U*100 (Å2) 0.80(4) 0.93(9)
Sr(2) position 6c
z 0.1391(1) 0.1386(2)
Occ 1.0 1.0
U*100 (Å2) 1.09(6) 1.4(1)
Nb(1) position 6c
z 0.42378(8) 0.4241(1)
Occ 1.0 1.0
U*100 (Å2) 0.22(2) 0.32(5)
Nb(2)/Ti(1) position
Occ 1.0/0.0 0.94/0.06
U*100 (Å2) 0.22(2) 0.32(5)
O(1) position 18f
x 0.2174(5) 0.2164(8)
y 0.8909(4) 0.8889(7)
z 0.62750(7) 0.6274(1)
Occ 1.0 0.9183
U*100 (Å2) 1.48(3) 1.24(6)
O(2) position 9d
x 0.2284(2) 0.2290(5)
y 0.8933(4) 0.8928(6)
z 0.45367(6) 0.4542(1)
Occ 1.0 1.0
U*100 (Å2) 1.14(3) 1.38(6)
Space Group R3(#148, hexagonal setting): 3a (0 0 0), 6c (0 0 z), 18f (x y z)
a2= 4.00 , R
wp= 5.05%, Rexp= 2.48%, RB= 4.45%, (cryst) = 5.842 g/cm3 b2= 9.27, R
wp= 7.80%, Rexp= 2.56%, RB= 4.91%, (cryst) = 5.781 g/cm3
Dalton
Transactions
Accepted
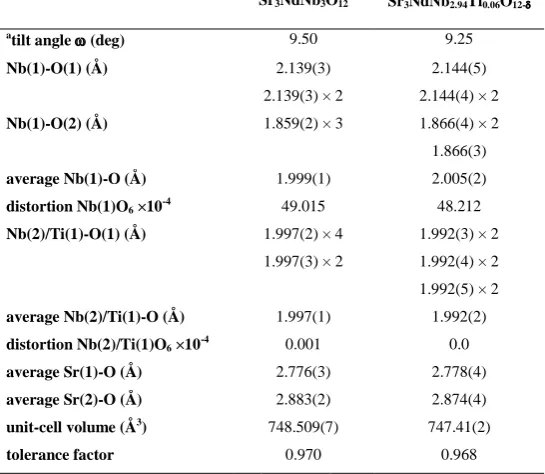
19 Table 2. Selected structural information for Sr3NdNb3-xTixO12- obtained from NPD data. Angles are
given in degrees and distances in Å, distortion of the BOn polyhedra and perovskite tolerance factor, t,
are also reported. = 1/n j=1,n {(dn - <d(B-O)>) / <d(B-O)>}
2 and t = <r(A)> + r(O) / √2 <r(B)> + r(O);
where r(A), r(B) and r(O) are the A, B and O average ionic radii, respectively 40.
Sr3NdNb3O12 Sr3NdNb2.94Ti0.06O12-
atilt angle (deg) 9.50 9.25
Nb(1)-O(1) (Å) 2.139(3) 2.139(3) × 2
2.144(5) 2.144(4) × 2
Nb(1)-O(2) (Å) 1.859(2) × 3 1.866(4) × 2 1.866(3)
average Nb(1)-O (Å) 1.999(1) 2.005(2)
distortion Nb(1)O6 ×10-4 49.015 48.212
Nb(2)/Ti(1)-O(1) (Å) 1.997(2) × 4 1.992(3) × 2 1.997(3) × 2 1.992(4) × 2
average Nb(2)/Ti(1)-O (Å)
distortion Nb(2)/Ti(1)O6 ×10-4
1.997(1) 0.001
1.992(5) × 2 1.992(2)
0.0
average Sr(1)-O (Å) 2.776(3) 2.778(4)
average Sr(2)-O (Å) 2.883(2) 2.874(4)
unit-cell volume (Å3) 748.509(7) 747.41(2)
tolerance factor 0.970 0.968
a along [100] of the pseudocubic cell
Dalton
Transactions
Accepted
[image:21.595.82.355.136.373.2]20 Table 3.
(a) Equilibrium constants employed for the simulation of defect profiles as function of pH2O. Data from literature are shown for comparison.
Phase Equilibrium constants Reference
Sr3NdNb2.94Ti0.06O12-
Sr3NdNb3O12-
KW= 30 atm-1, KO= 5x10⁻⁶ atm-1/2
KW= 2 atm-1, KO= 10-6 atm-1/2
this work this work
2 4 3
0.9 0.1 2.95
A B M O KW= 20 atm-1, KO= 10-5 atm-1/2 35
SrCe0.95Yb0.05O3- KW= 4.24x10⁻⁶ exp(14214/T) atm-1
KO= 5x10⁻⁶ atm-1/2
34
(b) Mobility ratio between different charge carriers used for the simulation of conductivity behaviour as function of pH2O compared to data from literature.
Phase Mobility ratio Reference
Sr
3NdNb
2.94Ti
0.06O
12-(800 ºC) h/H = 63; V/H ~0.27 this workSr
3NdNb
3O
12-(800 ºC) h/H = 60; V/H ~0.37 this workSrCe0.95Yb0.05O3-900°C h/H ~100; 2V/H ~0.1 34
Dalton
Transactions
Accepted
21 Table 4.
Microwave-dielectric properties of Sr3NdNb3-xTixO12-
Sample
(x) fo (GHz) Qf0 (GHz) r
TCF ( f) (ppm/°C)
0 6.39 16422 37.0 -12
0.06 6.23 13640 39.2 -3
Dalton
Transactions
Accepted
22 Figure Captions
1. Scanning electron micrographs of Sr3NdNb2.94Ti0.06O12- at magnifications of (a)
600× and (b) 1800× showing platelet-like microstructure.
2. High-resolution transmission electron microscopy images of Sr3NdNb3O12
projected down the (a) [0 1 0] and (b) [0 0 1] zone axes. The corresponding selected area electron diffraction patterns are shown as insets (bottom-right corners).
3. Observed (circles), calculated (continuous line) and difference (continuous line at bottom) neutron powder diffraction profiles of (a) Sr3NdNb3O12 and (b)
Sr3NdNb2.94Ti0.06O12-. Vertical bars indicate the expected position of Bragg
peaks. The presence of a Nb parasite peak arising from the experimental set-up is indicated in Fig. 3(b).
4. Schematic diagrams of the Sr3NdNb3O12 structure: (a) projection down the [1 0
0] zone axis, showing hhcc stacking sequence of AO3 layers; (b) represention of
Nb(1)O6 octahedron showing displacement of Nb towards a cation-site vacancy;
(c) projection down the [0 0 1] zone axis showing octahedral tilting according to the a-a-a- tilt system along the pseudo-cubic cell directions.
5. Z* plots of Sr3NdNb3O12 in dry and humidified air at 700 °C (numbers refer to
the approximate value of log10 of the frequency in Hz).
6. Temperature dependencies of the bulk conductivity of the Sr3NdNb3-xTixO12-
and Sr3LaNb3-xTixO12- (from ref. 8) in dry and wet air shown with open and
shaded symbols, respectively. The inset shows the magnitude of the conductive isotope effect for x = 0 and 0.06 members of the Nd-containing series as a function of temperature employing conductivity data collected in D2O-wetted
air.
7. Selected partial-pressure dependencies of electrical conductivity for Sr3NdNb 3-xTixO12- (x = 0 and 0.06): (a) bulk conductivity as a function of pO2 in dry
oxidising conditions; (b) total conductivity as a function of pO2 in reducing
conditions; (c) bulk conductivity as a function of pH2O in oxidising atmosphere.
Simulated conductivity of transport carriers and total conductivity at 800 °C as a function of pH2O (a) and pO2 (b) and comparison with the experimental results
of total conductivity (closed squares) for Sr3NdNb3O12-
Simulated conductivity profiles of transport species and total conductivity at 800 °C as a function of (a) pH2O and (b) pO2 showing fit with the experimental
results of total conductivity (closed squares) for Sr3NdNb2.94Ti0.06O12-.
Dalton
Transactions
Accepted
23 References
1 L. Katz and R. Ward, Inorg. Chem., 1964, 3, 205–211.
2 J. Darriet and M. A. Subramanian, J. Mater. Chem., 1995, 5, 543–552.
3 T. Norby, M. Widerøe, R. Glöckner and Y. Larring, Dalt. Trans., 2004, 3012– 3018.
4 K. D. Kreuer, Annu. Rev. Mater. Res., 2003, 33, 333–359.
5 E. Fabbri, D. Pergolesi and E. Traversa, Chem. Soc. Rev., 2010, 39, 4355–69.
6 K. Kreuer, Solid State Ionics, 1997, 97, 1–15.
7 R. Haugsrud and T. Norby, Nat. Mater., 2006, 5, 193–196.
8 C. Tabacaru, A. Aguadero, J. Sanz, A. L. Chinelatto, A. Thursfield, D. Pérez-Coll, I. S. Metcalfe, M. T. Fernandez-Díaz and G. C. Mather, Solid State Ionics, 2013, 253, 239–246.
9 A. Feteira, D. C. Sinclair, I. M. Reaney, Y. Somiya and M. T. Lanagan, 2004, 1087, 1082–1087.
10 I. M. Reaney and D. Iddles, J. Am. Ceram. Soc., 2006, 89, 2063–2072.
11 E. L. Colla, I. M. Reaney and N. Setter, J. Appl. Phys., 1993, 74, 3414–3425.
12 H. Yamada, T. Okawa, Y. Tohdo and H. Ohsato, J. Eur. Ceram. Soc., 2006, 26, 2059–2062.
13 G. M. Keith, C. A. Kirk, K. Sarma, N. M. Alford, E. J. Cussen, M. J. Rosseinsky and D. C. Sinclair, Chem. Mater., 2004, 2007–2015.
14 R. Rawal, A. J. McQueen, L. J. Gillie, N. C. Hyatt, E. E. McCabe, K. Samara, N. M. Alford, A. Feteira, I. M. Reaney and D. C. Sinclair, Appl. Phys. Lett., 2009, 94, 192904.
15 L. Fang, H. Zhang, Q. Yu, H. Su, B. Wu and X. Cui, J. Am. Ceram. Soc., 2009, 92, 556–558.
16 R. M. Adams, University of Huddersfield, 2010.
17 M. Hoelzel, a. Senyshyn, N. Juenke, H. Boysen, W. Schmahl and H. Fuess, Nucl. Instruments Methods Phys. Res. Sect. A Accel. Spectrometers, Detect. Assoc. Equip., 2012, 667, 32–37.
18 J. Rodriguez-Carvajal, Phys. B, 1993, 192, 55–69.
19 M. C. Steil, T. F. and M. Kleitz, J. Electrochem. Soc., 2000, 144, 390–398.
Dalton
Transactions
Accepted
24 20 D. Pérez-Coll, E. Sánchez-López and G. C. Mather, Solid State Ionics, 2010, 181,
20–26.
21 L. Haar, J. S. Gallagher and G. S. Kell, NBS/NRC Steam Tables, Hemisphere Publishing Corporation, New York, 1984.
22 J. C. Pérez Flores, C. Ritter, D. Pérez-Coll, G. C. Mather, F. García-Alvarado and U. Amador, J. Mater. Chem., 2011, 21, 13195–13204.
23 O. E. Averkova, E. A.A. and V. P. Sirotinkin, Russ. J. Inorg. Chem., 1987, 32, 1183.
24 C. J. Howard, K. S. Knight, B. J. Kennedy and E. H. Kisi, J. Phys. Condens. Matter, 2000, 12, L677–L683.
25 D. I. Woodward and I. M. Reaney, Acta Crystallogr. B., 2005, 61, 387–99.
26 G. Trolliard, N. Ténèze, P. Boullay and D. Mercurio, J. Solid State Chem., 2004, 177, 1188–1196.
27 A. M. Glazer, Acta Crystallogr. Sect. B Struct. Crystallogr. Cryst. Chem., 1972, 28, 3384–3392.
28 J. T. S. Irvine, D. C. Sinclair and A. R. West, Adv. Mater., 1990, 2, 132–138.
29 R. Haugsrud and T. Norby, Solid State Ionics, 2006, 177, 1129–1135.
30 N. Chan, R. Sharma and D. Smyth, J. Am. Ceram. Soc., 1981, 64, 556–562.
31 M. J. Rampling, G. C. Mather, F. M. B. Marques and D. C. Sinclair, J. Eur. Ceram. Soc., 2003, 23, 1911–1917.
32 N.-H. Chan, R. K. Sharma and D. M. Smyth, J. Am. Ceram. Soc., 1982, 65, 167– 170.
33 F. Krug, T. Schober and T. Springer, Solid State Ionics, 1995, 81, 111–118.
34 T. Schober, W. Schilling and H. Wenzl, Solid State Ionics, 1996, 86-88, 653– 658.
35 N. Bonanos and F. W. Poulsen, J. Mater. Chem., 1999, 9, 431–434.
36 C. Vineis, P. K. Davies, T. Negas and S. Bell, Mater. Res. Bull., 1996, 31, 431– 437.
37 R. D. Shannon, J. Appl. Phys., 1993, 73, 348–366.
38 M. Li, A. Feteira, M. Mirsaneh, S. Lee, M. T. Lanagan, C. a. Randall and D. C. Sinclair, J. Am. Ceram. Soc., 2010, 93, 4087–4095.
Dalton
Transactions
Accepted
25 39 K. Wada, Y. Fukami, K. Kakimoto and H. Ohsato, Jpn. J. Appl. Phys., 2005, 44,
7094–7097.
40 R. D. Shannon, Acta Crystallogr. Sect. A, 1976, 32, 751–767.
Dalton
Transactions
Accepted
δ ! "
# ! " $ # % & ' '
50 m
(b)
10 m
(a)
300
0012
[010]
Dalton
Transactions
Accepted
( ' )
* % ! " + , ! " + , - . '
% ! "/ ' %
! "
Dalton
Transactions
Accepted
0 ! "1 ' ! ' ' " ! ' '
" ' % ! " ! "
δ 2 . 3 &
& . '
! "
(a)
(b)
*
Dalton
Transactions
Accepted
' ' 4 ! " * % +
, - . 1 % & 5' 6 ) / ! "
! " % % 0 )/ ! "
* % + , - . %
) ' '
c c h h
(a)
a1
a2
ac (c)
(b)
Sr(2) 1.86Å
1.86Å 1.86Å
2.14Å 2.14Å
2.14Å
Nd/Sr(1)
Nb(1)O6
Nb(2)O6
(b)
Dalton
Transactions
Accepted
7 8 ) ' 9 :;
! ' . 0 ' 5' ) (-"
0 1x10³
2x10³ 3x10³
0.0 5.0x10² 1.0x10³ 1.5x10³ 2.0x10³
3
5 4
0 6
5
4
3 0
2 dry air
wet air (D2O)
wet air (H2O)
-Z
"
k
cm
Z' k cm
1
Dalton
Transactions
Accepted
' ' & ' 0 )
. . δ < . . δ! +$," ) % % %
) 1 0 ) % ' ' 0
. = '
' ) ' 0 ) > %
-8.5 -8.0 -7.5 -7.0 -6.5 -6.0 -5.5 -5.0 -4.5 -4.0
0.90 1.00 1.10 1.20
lo g [ σσσσ (S cm -1)]
1000/T (K-1)
RE=Nd, x=0.06; 0.85 eV
RE=Nd, x=0.06; 1.06 eV
RE=Nd, x=0; 0.81 eV
RE=Nd, x=0; 1.30 eV RE=La, x=0.1; 0.93 eV
RE=La, x=0; 1.13 eV
1.0 1.2 1.4 1.6
500 600 700 800
σσσσb u lk (H 2 O ) / σσσσb u lk (D 2 O )
T / °C
Dalton
Transactions
Accepted
9 ' ' 0 )
. . δ!. = "4 ! " ' & ' 0 ) ' ) .
/ ! " ' 0 ) ' ' / ! " ' &
' 0 ) ' ( .
(a) (b) (c)
Dalton
Transactions
Accepted
$ ' ' 0 ) ' 0 ) '
( ! " ! " % . '
' 0 ) ! 5' " δ.
-7 -6 -5
-4 -3 -2 -1
log [PH2O(atm)]
lo g [σσσσ ( S cm
-1 )] σσσσH
σ σ σ σtotal (a) σ σ σ σO σ σ σ σh -6.5 -6.0 -5.5 -5.0
-2.5 -1.5 -0.5 0.5 1.5
log [PO2(atm)]
' ' 0 ) ' 0 )
' ! " ( ! " % % . '
' 0 ) ! 5' " δ
-7 -6 -5
-4 -3 -2 -1
log [PH2O(atm)]
lo g [σσσσ ( S cm -1 )] σ σσ σH σ σ σ σh σ σ σ σtotal (a) σ σσ σO -6.5 -6.0 -5.5 -5.0
-2.5 -1.5 -0.5 0.5 1.5
log [PO2(atm)]
The solid solution Sr3NdNb3 xTixO12δ (0≤x≤0.06) crystallises with a 12R type
hexagonal perovskite structure and exhibits increasing proton conductivity with x.
a1 a2
ac
-7 -6 -5
-4 -3 -2 -1
log [PH2O(atm)]
lo
g
[σσσσ
(
S
cm
-1)] σσσσH
σ σσ σh σ
σ σ
σtotal
σ σ σ σO
x=0.06