This is a repository copy of
The effects of compression on single and multiphase flow in a
model polymer electrolyte membrane fuel cell gas diffusion layer
.
White Rose Research Online URL for this paper:
http://eprints.whiterose.ac.uk/83977/
Version: Accepted Version
Article:
Tranter, TG, Burns, AD, Ingham, DB et al. (1 more author) (2015) The effects of
compression on single and multiphase flow in a model polymer electrolyte membrane fuel
cell gas diffusion layer. International Journal of Hydrogen Energy, 40 (1). 652 - 664. ISSN
0360-3199
https://doi.org/10.1016/j.ijhydene.2014.11.051
© 2015, Elsevier. Licensed under the Creative Commons
Attribution-NonCommercial-NoDerivatives 4.0 International
http://creativecommons.org/licenses/by-nc-nd/4.0
Reuse
Unless indicated otherwise, fulltext items are protected by copyright with all rights reserved. The copyright exception in section 29 of the Copyright, Designs and Patents Act 1988 allows the making of a single copy solely for the purpose of non-commercial research or private study within the limits of fair dealing. The publisher or other rights-holder may allow further reproduction and re-use of this version - refer to the White Rose Research Online record for this item. Where records identify the publisher as the copyright holder, users can verify any specific terms of use on the publisher’s website.
Takedown
If you consider content in White Rose Research Online to be in breach of UK law, please notify us by
The effects of compression on single and multiphase flow in a model
polymer electrolyte membrane fuel cell gas diffusion layer
T. G. Trantera,∗, A. D. Burnsa, D. B. Inghama, M. Pourkashaniana a
Energy Technology and Innovation Initiative, University of Leeds, Leeds, LS2 9JT, UK, T: +44(0) 113 343 6143
Abstract
A two-dimensional study of an idealised fibrous medium representing the gas diffusion layer of a PEMFC is
conducted using computational fluid dynamics. Beginning with an isotropic case the medium is compressed
uni-directionally to observe the effects on single and multiphase flow. Relations between the compression
ratio and the permeability of the medium are deduced and key parameters dictating the changes in flow
are elucidated. The main conclusions are that whilst compression reduces the absolute permeability of an
isotropic medium, the creation of anisotropic geometry results in preferential liquid water pathways. The
most important parameter for capillary flow, in uniformly hydrophobic media, is the minimum fibre spacing
normal to the flow path. The effect is less pronounced with decreasing contact angle and non-existent for
neutrally wettable media.
Keywords: PEMFC, Gas Diffusion Layer, Compression, Computational Fluid Dynamics, Permeability
Corresponding author:
Thomas Tranter
Energy Technology & Innovation Initiative
University of Leeds, Leeds LS2 9JT, United Kingdom
Email: [email protected] Tel.: +44 113 343 5113 Fax: +44 113 246 7310
Color reproduction: Required for web.
∗Corresponding author
1. Introduction
The Gas Diffusion Layer (GDL) of a Polymer Electrolyte Membrane Fuel Cell (PEMFC) is a crucial
component and performs several functions simultaneously; it facilitates reactant gas transport towards the
catalyst regions and also provides pathways for product water and electron transport. A review of gas
diffusion layer properties and characterisation is provided by Park et al. [1]. The GDL also helps protect
the membrane when the Membrane Electrode Assembly (MEA) is sealed between the current collector
plates. Typically the current collectors will have gas channels, between 1 and 2mm wide, which can be
connected in a range of configurations [2]. This presents a series of channels and ribs or land areas that form
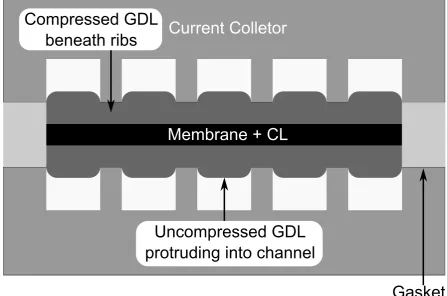
the contact points with the GDL. It is necessary to clamp the fuel cell together using bolts and a gasket in
order to seal the gasses and this can exert considerable pressure on the GDL, thus changing the material
structure and properties of the medium with sections beneath the ribs subject to high compression.
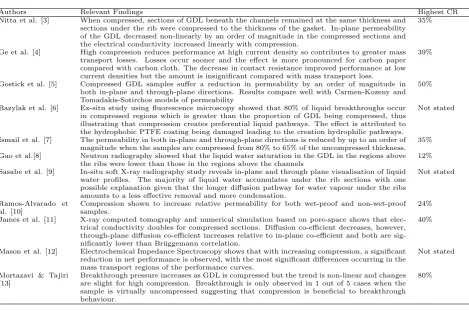
Several experimental studies of the effect of compression on the GDL have been made and are summarised
in Table 1. Compression is found to affect the liquid water profile in the GDL and the performance of the
fuel cell, but no clear picture emerges about the mechanism by which compression affects transport or how
this can be controlled.
Numerical studies of the effects of compression include a study by Hottinen et al. which revealed that
non-uniform current and temperature distributions occur and this can lead to hot-spots in the membrane
which affect the proton conductivity [14]. Su et al. found that cell performance is controlled by transport
under the channel area but when a sufficient pressure difference exists between adjacent channels,
cross-flow occurs and brings more reactant gas to the sections beneath the rib which improves performance [15].
Wang & Chen looked more closely at the water distribution inside compressed GDL and applied a spatially
varying porosity in order to obtain a saturation profile which matched neutron radiography data [16]. These
studies were all performed using CFD incorporating models for liquid water that rely on a saturation
profile linked to the liquid phase pressure. Another approach that does not rely on this assumption or
constitutive relationships, but instead models the percolation process directly, is the pore network model.
Lee et al. observed the effect of compression on the saturation profile in the GDL which took a more linear
shape under increasing compression [17]. The assumptions on the construction of the network and how the
geometry changes under compression meant that the pore-entry pressure for liquid was unaffected in the
through-plane direction but increased in the lateral in-plane directions thus creating preferential flow in the
through-plane direction.
Current Colletor
Membrane + CL
Compressed GDL
beneath ribs
Uncompressed GDL
protruding into channel
[image:4.595.73.521.253.549.2]Authors Relevant Findings Highest CR Nitta et al. [3] When compressed, sections of GDL beneath the channels remained at the same thickness and
sections under the rib were compressed to the thickness of the gasket. In-plane permeability of the GDL decreased non-linearly by an order of magnitude in the compressed sections and the electrical conductivity increased linearly with compression.
35%
Ge et al. [4] High compression reduces performance at high current density so contributes to greater mass transport losses. Losses occur sooner and the effect is more pronounced for carbon paper compared with carbon cloth. The decrease in contact resistance improved performance at low current densities but the amount is insignificant compared with mass transport loss.
39%
Gostick et al. [5] Compressed GDL samples suffer a reduction in permeability by an order of magnitude in both in-plane and through-plane directions. Results compare well with Carmen-Kozeny and Tomadakis-Sotirchos models of permeability
50%
Bazylak et al. [6] Ex-situ study using fluorescence microscopy showed that 80% of liquid breakthroughs occur in compressed regions which is greater than the proportion of GDL being compressed, thus illustrating that compression creates preferential liquid pathways. The effect is attributed to the hydrophobic PTFE coating being damaged leading to the creation hydrophilic pathways.
Not stated
Ismail et al. [7] The permeability in both in-plane and through-plane directions is reduced by up to an order of magnitude when the samples are compressed from 80% to 65% of the uncompressed thickness.
35% Gao et al.[8] Neutron radiography showed that the liquid water saturation in the GDL in the regions above
the ribs were lower than those in the regions above the channels
12% Sasabe et al. [9] In-situ soft X-ray radiography study reveals in-plane and through plane visualisation of liquid
water profiles. The majority of liquid water accumulates under the rib sections with one possible explanation given that the longer diffusion pathway for water vapour under the ribs amounts to a less effective removal and more condensation.
Not stated
Ramos-Alvarado et al. [10]
Compression shown to increase relative permeability for both wet-proof and non-wet-proof samples.
24% James et al. [11] X-ray computed tomography and numerical simulation based on pore-space shows that
elec-trical conductivity doubles for compressed sections. Diffusion co-efficient decreases, however, through-plane diffusion co-efficient increases relative to in-plane co-efficient and both are sig-nificantly lower than Br¨uggemann correlation.
40%
Mason et al. [12] Electrochemical Impedance Spectroscopy shows that with increasing compression, a significant reduction in net performance is observed, with the most significant differences occurring in the mass transport regions of the performance curves.
Not stated
Mortazavi & Tajiri [13]
Breakthrough pressure increases as GDL is compressed but the trend is non-linear and changes are slight for high compression. Breakthrough is only observed in 1 out of 5 cases when the sample is virtually uncompressed suggesting that compression is beneficial to breakthrough behaviour.
[image:5.595.72.542.104.414.2]80%
Table 1: Experimental studies of the effects of compression on the GDL.
are most commonly found:
i Nam & Kaviany’s Inverted-Tree hypothesis [18] pictures many smaller flows agglomerating into a larger
branch towards the gas channel.
ii Litster et al. [19] present a picture of fingering and channelling where many liquid pathways emerge
from the catalyst region in a finger like fashion with some meeting dead-ends and others reaching the
gas channel.
Park et al. [20] were, to the author’s knowledge, the first to utilise the volume of fluid (VOF) method to
capture liquid water dynamics in a realistic 3-D GDL structure. Drainage was simulated and the pressure
gradient from reactant flow and the contact angle were observed to be the most important parameters
influencing the removal process, however the domain was very small and the percolation process was not
captured. Suresh & Jayanti [21] also modelled liquid transport through a representative GDL structure
and the methods employed are the basis for the present study. A regular isotropic lattice of cylindrical
where gas-flow is absent, present in the channel and present through the GDL were simulated to observe the
effects of gas shearing on the liquid dynamics. The general pattern was that of channelling and fingering
similar to the description of [19]. When gas-flow was present in the channel, liquid droplets emerging at the
GDL-channel interface were removed from the surface, as observed by many experimenters and modellers
[22], [23], [24]. Gas-flow in the GDL was also observed to influence the dynamics of liquid water, creating
flow in the stream of the gasses. This convective flow, however, is dependent on the permeability of the
GDL medium, which reduces when the GDL is compressed as shown by many of the experimental results
in Table 1
In the present study, an idealised 2-D lattice of fibres representing the GDL is subject to compression
in the through-plane direction. Single phase and multiphase VOF simulations are conducted to observe the
effect of compression on the permeability and capillary flow which dominates the liquid transport process. It
will be shown that whilst permeability is reduced by compression, liquid flow in the through-plane direction
is actually positively affected leading to lower saturation of the GDL at breakthrough. Furthermore, the
effect of the contact angle on the liquid dynamics in the most compressed case is investigated and reducing
it is shown to have a detrimental effect on liquid water removal.
No previous study on the effects of GDL compression have been conducted using this technique. The
advantage of the technique over other modelling approaches is the resolution of the discrete phases when
compared to a mixture model and the solving of the full Navier-Stokes equations when compared to a
pore network model, lattice Boltzmann or morphological technique. Modelling provides the opportunity to
carefully control and investigate geometric and other parameters in order to elucidate fundamental cause
and effect in a way experimental studies cannot.
2. Method
2.1. Modelling Domain
The modelling domain is a 2-D cross section of cylindrical fibres that are non-overlapping and equally
spaced in a lattice configuration. This represents a small section of the GDL and channel configuration and
is idealised to enable a sufficiently detailed parametric study of the effects of changing the fibre spacing in
both the in-plane and through plane directions by means of compression; the model is most similar to a
carbon paper type GDL. The modelling process involves the construction of five geometrical configurations
added to three of the modelling domains (cases A, C & E) which are used for the multiphase simulation.
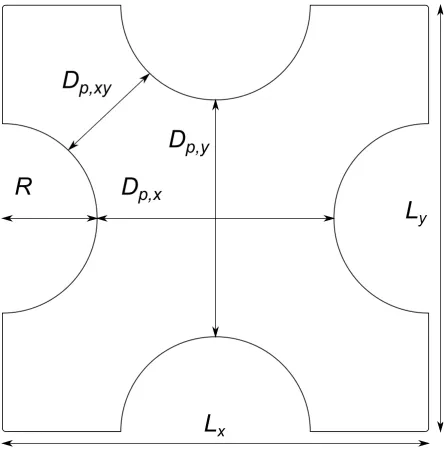
Figure 2 shows the unit cell with characteristic lengths.
R
D
p,y
D
p,xy
D
p,x
L
x
L
y
Figure 2: Unit cell with characteristic lengths for the modelling domain.
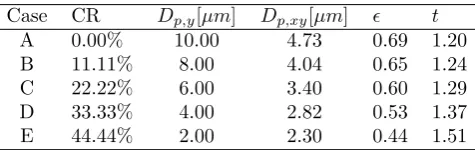
The change in important parameters are also summarised in Table 2, whereǫis the porosity which can
easily be calculated from the geometry and t is the tortuosity which is commonly related to the porosity
through Archie’s Law: t=ǫ−n wherenis typically taken to be 0.5 when applying Br¨uggemann’s correction
Case CR Dp,y[µm] Dp,xy[µm] ǫ t
[image:8.595.179.417.109.184.2]A 0.00% 10.00 4.73 0.69 1.20 B 11.11% 8.00 4.04 0.65 1.24 C 22.22% 6.00 3.40 0.60 1.29 D 33.33% 4.00 2.82 0.53 1.37 E 44.44% 2.00 2.30 0.44 1.51
Table 2: Characteristic lengths and properties of the compressed geometry,t=ǫ−0.5.
Following the common assumptions that fibres are incompressible and that deformation only occurs in
the direction of compression [5], the fibre radius (R) and pore diameter in the x-direction (Dp,x) are fixed
at 4µmand 10µmrespectively, for all cases. The compression ratio (CR) is defined as follows [26]:
CR=L
∗
y−Ly
L∗
y
= D
∗
p,y−Dp,y
D∗
p,y+ 2R
(1)
where∗ denotes the uncompressed value.
The modelling domains, which are 10 pores by 5, were created using ANSYSR
ICEM CFDTM by
constructing an ordered mesh surrounding a single fibre with an octagonal boundary which forms the interior
connections. The single fibre mesh is translated diagonally and copied and nodes are merged to form the
modelling domain. Additional square sections between adjacent fibres in each row are also required but can
easily be tessellated and merged in the same manner, providing the node spacing matches the vertical and
horizontal node spacing of the octagonal mesh. A section of the final result is shown in Figure 3. Typical
commercial GDLs can range in thickness between 110 and 420µm as surveyed by El-kharouf and Mason
[27], and the current collector’s gas flow channels are usually between 1 and 2 mm in height. In the present
study, the thickest uncompressed GDL section is approximately 90 µm thick which is close to the actual
thickness of some GDLs and allows for a good degree of variability in the liquid flow paths whilst minimising
the computational expense of the simulation. We are not primarily concerned with channel droplet dynamics
or the behaviour of the liquid water after it has permeated through the GDL and merely include the channel
as representative of an open space so only part of it is resolved.
2.2. Governing Equations
2.2.1. Single-phase study
For the single-phase study the top and bottom edges form the inlets and outlets to calculate
through-plane permeability and the sides are treated as no slip walls, free slip boundary conditions for the domain
and the sides become the inlets and outlets. The circular boundaries around each fibre are treated as no slip
walls in all cases. The simulation is isothermal and the full Navier-Stokes equations of motion are solved
with zero gravity and other body forces owing to the dominance of viscous forces at these length scales. The
fluid is modelled as incompressible air (but any Newtonian fluid could have been chosen) which is a valid
assumption for low mass flow rates.
The continuity equation is given by:
∂ρ
∂t +∇.(ρ~v) = 0 (2)
whereρis the fluid density and~vis the velocity. The momentum equation is given by:
∂
∂t(ρ~v) +∇.(ρ~v~v) =−∇p+∇.(~τ) (3)
wherepis the pressure and~τ is the stress tensor given by:
~τ= [µ(∇~v+∇~vT)−2
3∇.~vI] (4)
whereµis the dynamic viscosity andI is the unit tensor.
Ismail et al. [28] have shown that, when calculating permeability, the Forchheimer or non-Darcy terms
cannot be ignored for higher flow rates when inertial losses account for a significant proportion of the
pressure drop across the medium. Ward [29] has shown that a smooth transition occurs between the linear
Darcy regime and the non-linear Forchheimer regime when increasing the Reynolds number, defined as
Re=ρ~vK1/2/µwhereK is the permeability, above 1. The simulations are all conducted forRe <1 and so
Darcy’s law holds:
Q=KA µ
∆p
L (5)
where Qis the volumetric flow rate, A is the cross-sectional area of the medium open to flow and Lis
the length of the medium.
2.2.2. Multiphase study
For the multiphase study, the domain is initially filled with air and three of the inter-fibre sections at the
lower boundary are selected for water inlets with the rest being set to no slip walls. The inlet velocity is set
to 0.01m/s corresponding to a capillary number,Ca=µlvl/σwhere σis the coefficient of surface tension,
closest to the capillary fingering flow regime reported in the literature [30] whilst remaining computationally
efficient and is also consistent with other studies [21],[31],[32]. A channel region above the GDL is included
in the flow domain with a pressure outlet at the top of the domain set to zero gauge pressure.
The VOF model is employed to simulate the multiphase behaviour with the primary phase being air and
the secondary phase being liquid water, thus simulating the environment within the GDL of the cathode
side of a PEMFC. The VOF model is a surface tracking technique where two immiscible fluids share a single
set of momentum equations and the volume fraction of each fluid is tracked throughout each cell of the
computational domain. The continuity equation for each phase becomes:
∂
∂t(αqρq) +∇.(αqρqv~q) = 0 (6)
and the momentum equation becomes dependent on each phase through the phase averaged density and
viscosity terms:
ρ=Xαqρq (7)
µ=Xαqµq (8)
where αq is the volume fraction of the qth phase. As for the single-phase simulations, the effects of
gravity are ignored in the multiphase simulations. This is justified by considering the E¨otv¨os number of the
system, a dimensionless measure of the relative importance of gravity and surface tension:
Eo¨= ∆ρgd
2
σ (9)
which for droplets of diameter 30µm(the largest possible in the simulation) is of the order 10−4, therefore
the surface tension is the dominant force.
2.3. Capillary Pressure Models
For simple straight capillary tubes, the capillary pressure, Pc, is determined by the curvature of the
interface. The curvature is essentially governed by the contact angle, θ, between the phases at the solid
boundaries constricting the flow and can be expressed by the Washburn relation:
Pc =2σcos(θ)
whereRis the capillary tube radius. The contact angle is a measure of how much a fluid wets (θ <90◦) or
doesn’t wet (θ >90◦) a particular surface and determines the direction of capillary flow as the fluid filling
the concave side of an interface will be at higher pressure. In the present study the contact angle is set to
130◦, thus signifying a uniformly hydrophobic medium. This value has been shown by Fairweather et al.
[33] to hold for a range of PTFE loadings. In reality, the PTFE coverage is not even and fuel cell diffusion
media do not possess uniform wettability but for the purposes of this study, which is more focused on the
geometrical structure of the medium, it is best to eliminate the influence of other variables on the results so
each fibre has the same boundary conditions applied.
More generally the capillary pressure is defined as the difference between the phase pressures and is
determined by the Young-Laplace equation [34] which makes use of the curvature of the interface (κ):
Pc=σκ=σ∇.nˆ=Pl−Pg (11)
where
ˆ
n= n
|n| (12)
and
n=∇αq (13)
where Pc >0 is conventionally understood to mean that liquid is the non-wetting phase as is the case
in a hydrophobic medium. Gostick [34] remarks that the Washburn relation’s simple dependence on the
contact angle erroneously predicts a switch in wettability for contact angle transitions across the value of
90◦ when in fact a porous medium remains neutrally wettable across a wide range of contact angles from
75◦ to 105◦. This suggests that wettability alone cannot determine the transport but dependence on the
structure, such as pore throat shapes and sizes, also plays an important role.
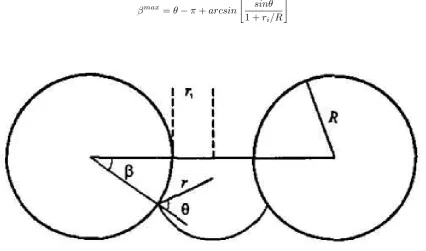
A model, shown schematically in Figure 4 and first proposed by Purcell [35], incorporates the influence
of geometry on the capillary pressure by considering a liquid interface passing through a toroid. Equation
(14) is an analytical expression for the capillary pressure and has been discussed in detail by Mason and
Morrow [36] and shown by Gostick [37] to fit very well with capillary pressure data for GDLs:
Pc=
−2σ ri
. cos(θ−β)
1 +R/ri(1−cos(β))
(14)
reaches the smallest constriction at the centre of the throat. The filling angle at which the maximum
meniscus curvature occurs,βmax, was shown by Mason and Morrow to be:
βmax=θ−π+arcsin
sinθ
1 +ri/R
[image:13.595.84.511.164.415.2]
(15)
Figure 4: Schematic of a meniscus in the converging-diverging orifice of a toroid ring. For a non-zero contact angle, the position of the maximum meniscus curvature is below the constriction in the torus.[36]
Surface tension is accounted for in this study by using the continuum surface force (CSF) model proposed
by Brackbill et al. [38] based on the Young-Laplace equation. It is expressed as a volume forceFvol as part
of the momentum equation where:
Fvol=σpq
ρκ∇αp
1/2(ρp+ρq)
(16)
In the present study, the surface tension coefficient between the phases (σpq) is taken to be 0.072 N/m which
corresponds to room temperature.
2.4. Mesh Independence
Mesh independence was established by observing the multiphase flow on a smaller section of the domain.
A structured mesh was favoured to an unstructured approach due to the recommendations that surface
tension models are very sensitive to mesh uniformity and quadrilaterals and hexahedra should be used in
with a structured approach with special attention paid to the node spacing normal to the fibre walls thus
ensuring a smooth transition from smaller to larger cells. Two tessellation techniques were applied with
one forming acute angles in the cells of adjoining units. These acute angles were observed to influence the
direction of liquid permeation so the technique was abandoned in favour of the octagonal approach with
adjoining square sections. The optimum number of cells was found to be about 200,000 for the uncompressed
case and about 350,000 for the most compressed case. Further details of the mesh and solution procedure
are available on request.
3. Results and Discussions
3.1. Single-Phase Study
The motivation for the single-phase study is partly to validate the modelling approach against published
experimental results and theories of permeability and partly to observe the effects on the flow to enable
comparisons with the multiphase modelling. The geometry is idealised in this approach and has a limited
range of pore and throat sizes but can be thought of as representing the average properties of the medium.
The 2-D restriction is necessary for computational efficiency but imposes a level of order which is not
commonly found in real GDL materials. Therefore, it is important to establish whether valid conclusions
can be drawn from such a modelling approach; comparisons made with established theory is the best way
of doing this.
The most frequently used permeability relation in studies of porous medium is the Kozeny-Carman
(K-C) equation, which is based on the idea of a porous medium being comprised of many tortuous capillary
tubes [40]:
K= ǫ
kc
Vp
Ap
!2
= ǫ¯r
2
4kc
= ǫ¯r
2
8tv
(17)
where Vp and Ap are the total volume and surface area of the pore space, kc is the Kozeny constant
and ¯r= ¯D/2 is the mean intercept half-length of the pore structure, a measure of the average pore radius.
The tortuosity for viscous flow,tv, is not defined straight-forwardly for complicated geometry and is usually
combined with the Kozeny constant as a fitting parameter for the medium and therefore:
K=CǫD¯
2
Tomadakis & Sotirchos [41] showed that for random non-overlapping fibres ¯D/R = 2ǫ/(1−ǫ) and
therefore Equation (17) can be written:
K= ǫ
3R2
8tv(1−ǫ)2
= ǫ
3R2
4kc(1−ǫ)2
(19)
where Ris the fibre radius, however this equation does not account for orthotropic fibre spacing unless
different constants are used for different directions so Equation (18) will be used.
Inspection of the velocity profile through the two extreme modelling domains in Figure 5 reveals that as
the geometry is compressed the flow path becomes less tortuous and regions develop where flow is stagnant
and unaffected by the bulk flow. A flow pattern emerges which is similar to a capillary tube and so fits well
with the K-C model.
[image:15.595.81.509.335.461.2](a) Case A (b) Case E
Figure 5: Comparison of the through-plane velocity profiles: Uncompressed case has uniform flow whereas most compressed case shows areas of low velocity and capillary tube like flow.
By analysing the pressure drop and tangential velocity along a stream line that passes through the
mid-point of each throat, an effective capillary tube diameter can be derived using the following equation based
on flow through a slowly varying channel [42]:
v= h
2
2µ dp dx
y2
h2−1
!
(20)
wherehis the half channel height, similar to ¯r, in Equation (17), andy is the distance from the mid-point
of the channel. Therefore, along the stream-line coinciding withy= 0, the effective capillary tube diameter
that the fluid appears to pass through can be calculated as:
Def f = 2
s
2µv
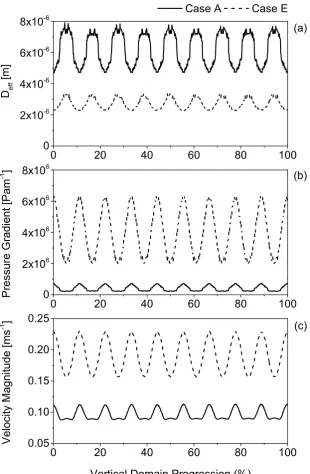
The flow parameters and effective capillary tube diameter along a streamline passing through the centre
of each pore throat for the uncompressed case and the most compressed case are shown in Figure 6.
The pressure gradients in all cases oscillate between a regular minima and maxima when passing through
pores and throats respectively. The minima and maxima lie within an order or magnitude of one-another so
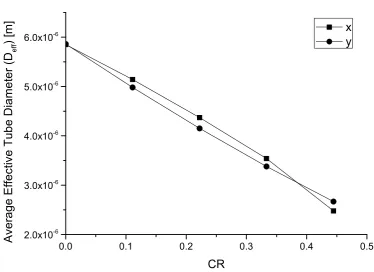
to constrict the permeability calculation purely to a minimum length scale would be inaccurate. Excluding
edge effects the average effective capillary tube diameter is calculated for all cases in both in-plane (x) and
through-plane (y) directions and plotted as a function of compression ratio in Figure 7.
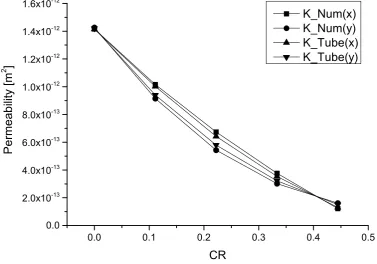
Figure 8 shows the numerically calculated permeability according to Darcy’s Law plotted against
com-pression ratio along with a simplified K-C type permeability utilising the average effective capillary tube
diameter and Equation (17). Here a constant value of C = 2.31 is used and Archie’s Law is used for the
tortuosity for lack of a better approximation that holds over the compression range. It can be seen that
the through-plane permeability becomes greater than the in-plane permeability under high compression.
Equation (18), can be tuned withkc= 9.5 to match the through-plane data quite well. Akc value of 8.10
was found by Gostick et al. [5] to correspond well to the permeability of SGL-10BA with flow perpendicular
to the fibre direction. Therefore, it can be concluded that the results are representative of carbon paper
GDLs.
3.2. Multiphase Study - Low Compression
The results from the multiphase simulations for the uncompressed and middle cases are presented in
Figures 9 and 10 respectively. The general pattern of evolution of the liquid phase through the GDL is
similar for the uncompressed and mid-level compression cases, and again they are both similar to the work
of Suresh & Jayanti’s case without the presence of air flow [21]. Liquid flows from each inlet and upon
meeting a fibre wall deforms and flows in one or both of two directions around it. As each row of fibres has
its centres placed directly between the fibres in the rows above and below, and there are no other deforming
forces present, the direction of flow is largely random and subject to bifurcation. Due to the method of
mesh creation the conditions at each of the inlets should be identical yet the individual pathways are not,
because of the non-linearity in the governing equations.
Before the liquid front has reached the mid-point through the fibrous domain, the paths have converged
and the pressure field is shared throughout the bulk of the liquid. As more liquid is added through the inlets,
capillary pressure increases and the interfaces penetrate the constricting throats between fibres further.
The flow pattern is that of a build up and quick release of pressure in the bulk fluid as surface tension
0 20 40 60 80 100 0 2x10 -6 4x10 -6 6x10 -6 8x10 -6
0 20 40 60 80 100 0 2x10 6 4x10 6 6x10 6 8x10 6
0 20 40 60 80 100 0.05
0.10 0.15 0.20 0.25
Case A Case E
D e f f [ m ] (a) (b) (c) P r e ssu r e G r a d i e n t [ P a m -1 ] V e l o ci t y M a g n i t u d e [ m s -1 ]
[image:17.595.139.450.147.622.2]Vertical Domain Progression (%)
0.0 0.1 0.2 0.3 0.4 0.5 2.0x10 -6 3.0x10 -6 4.0x10 -6 5.0x10 -6 6.0x10 -6 A v e r a g e E f f e c t i v e T u b e D i a m e t e r ( D e f f ) [ m ] CR x y
Figure 7: Average effective capillary tube diameter ( ¯Def f) for single-phase flow in the in-plane (x) and
0.0 0.1 0.2 0.3 0.4 0.5 0.0
2.0x10
-13
4.0x10
-13
6.0x10
-13
8.0x10
-13
1.0x10
-12
1.2x10
-12
1.4x10
-12
1.6x10
-12
P
e
r
m
e
a
b
i
l
i
t
y
[
m
2
]
CR
[image:19.595.93.471.283.547.2]K_Num(x) K_Num(y) K_T ube(x) K_T ube(y)
(a) 3 ms
(b) 10 ms
[image:20.595.179.417.135.671.2](c) 16 ms
(a) 3 ms
(b) 8 ms
[image:21.595.181.416.203.614.2](c) 13 ms
(a) 0.5 ms
(b) 1.5 ms
[image:22.595.180.416.127.457.2](c) 3.9 ms
Figure 11: Most compressed case (CR = 44.44%) showing liquid permeation as a function of time from 3 inlets through the fibrous GDL and emerging as 3 separate droplets in the channel with no lateral spreading of the paths.
allowed to flow through the pore throat and it expands quite quickly to fill the pore space. Simultaneously,
the other interfaces connected by the bulk recede owing to the drop in liquid phase pressure. This effect
is most obvious when the liquid reaches the GDL surface and expands rapidly to form a droplet, but does
occur throughout the entire process. As the inlet velocity is maintained constant a periodic oscillation in
the pressure at the inlets can be observed corresponding to mini-breakthroughs of the liquid front through
the restricting pore throats.
Once a droplet is formed at the GDL surface a preferential pathway is established through the connected
bulk fluid. The force required to expand the surface of the droplet is less than that required to penetrate
3.3. Multiphase Study - High Compression
The most compressed case, shown in Figure 11, differs greatly from the other multiphase cases
invest-igated with the differences solely due to the change in minimum fibre spacing. All other flow parameters
and wall contact angles remain the same. High compression of the medium creates anisotropy in the
min-imum fibre spacing normal to flow and this influences the evolution of the liquid path significantly. No
lateral spreading is observed in the high compression case and permeation occurs in a fraction of the time,
indicating much higher relative permeability. As paths do not converge, multiple droplets form at the GDL
surface.
For the lesser compressed cases, the minimum fibre spacing is the diagonal between successive displaced
rows of fibres termedDp,xy in Figure 3 but for the most compressed case it is the vertical space between
columns of fibres termedDp,y. As flow in both the x and y directions must pass throughDp,xy, both are
subject to the same resistive forces and the flow is approximately uniform in both directions for the first
two cases. However, becauseDp,y only restricts the flow in the direction normal to it, flow parallel toDp,y
progresses and the liquid follows the path of least resistance. Due to the regularity of the geometry, the effect
is perhaps accentuated as the liquid front is always presented with a wider throat to flow through in the same
direction. The characteristic of the medium, which should reflect the anisotropy in the fibre spacing normal
to flow, is the permeability; a GDL which has higher through-plane permeability than in-plane permeability
should give a preferentially directed liquid flow (and correspondingly a higher relative permeability) in
the through-plane direction. Typically GDLs have higher in-plane permeability but compressed sections
may experience a switch due to a smaller reduction in the average fibre spacing normal to the direction of
compression (which is always through-plane).
Ramos-Alvarado et al. have experimentally determined the effect of compression on the absolute and
relative permeability of Toray 090 carbon paper [10]. It was observed that whilst absolute permeability
decreased with compression relative permeability increased, which can now be explained by the relative
change in fibre spacing.
3.4. Influence of contact angle
When the contact angle is 90◦, Equation (14) shows that the capillary pressure is zero at the mid-point
of the throat where the filling angle β = 0, this is also the point at which maximum curvature occurs
(βmax). After the invading fluid passes through the mid-point, the sign of the capillary pressure becomes
(a) Contact angle = 130◦
(b) Contact angle = 110◦
[image:24.595.182.415.112.461.2](c) Contact angle = 90◦
Figure 12: Three snapshots at 3.5 ms for the most compressed case (E) with different contact angles.
(15) shows that the maximum curvature occurs after the point of maximum constriction with increasing
β. This phenomenon explains why we observe interfaces that have penetrated past the mid-point but are
unable to progress any further when the surface contact angle is greater than 90◦. Once capillary pressure
is great enough to push the interface past the point of maximum curvature the fluid flows uninhibited as
surface tension decreases with expanding pore diameter.
Radhakrishnan and Haridoss have shown that compression can decrease the contact angle or rather
increase the wettability of GDLs and with cyclic compression these changes may become permanent [43].
The most likely cause for this change in wettability is the damage and breakup of the PTFE coating.
Equation (14) shows that for neutrally wettable media the capillary pressure is zero when the filling angle
β is zero regardless of the width of the pore. Therefore, one would expect the effects of fibre spacing on
multiphase flow to become less pronounced for neutrally wettable media. Two further simulations for the
CR θ Saturation
[image:25.595.233.363.109.161.2]0.00% 130 0.34 22.22% 130 0.51 44.44% 130 0.25
Table 3: Saturation levels in the GDL for the multiphase simulations at breakthrough.
lesser directional flow and greater saturation with lesser contact angle. It is therefore important to increase
the through-plane permeability and retain the hydrophobic nature of the GDL in order to direct flow. In
other words, smaller hydrophobic throats are more effective at stopping liquid flow than neutrally wettable
ones.
3.5. Saturation
The saturation is an important parameter when considering multiphase transport and is linked to
ca-pillary pressure and relative permeability by empirical relationships throughout fuel cell literature. The
capillary pressure in these cases is that required for the liquid to penetrate the narrowest throat or
constric-tion and overcome the greatest surface tension force. Saturaconstric-tion levels at breakthrough (i.e. when droplets
begin to form at the surface of the GDL) for each case are presented in Table 3. At low compression, where
the minimum fibre spacing is isotropic, the saturation is high and the variation between results is reflective
of the non-linear nature of the governing equations. For high compression, where the minimum fibre spacing
is anisotropic, the liquid is directed effectively in one direction towards the channel and the saturation is
much lower. When the contact angle is decreased this lessens the effect of anisotropic surface tension forces
and the lateral spreading increases. This leads to a greater saturation but breakthrough is not achieved in
the same time-scale for the lesser contact angles so they are not shown in Table 3.
The results agree with the observations of Bazylak et al. [6] who observe preferential liquid pathways
under compressed sections of a GDL and also explain the results of Gao et al. [8] who observe a reduced
saturation under compressed sections of a GDL before and after liquid breakthrough. The method of
observation and experimental set-up is different in both of these experiments with the key difference being
the location of liquid water injection. Bazylak et al. allow water to absorb across the whole section of
GDL (both compressed and uncompressed) whereas Gao et al. inject water only into the channel section.
As there will be a negative porosity gradient from the uncompressed GDL adjacent to the channel to the
compressed GDL in contact with the rib one would expect there to be limited lateral spreading and thus
directional transport to liquid water by altering the average throat spacing [44], which is the same mechanism
observed in the present study.
Porosity gradients may in-fact play an important role in determining the liquid water distribution and
overall saturation as shown by Zhan et al. [45] and more recently Wang and Chen [16] and Garcia-Salaberri
et al. [46]. As porosity is directly linked to the local fibre spacing the results presented in this study would
also indicate that porosity grading plays an important role in directing liquid transport. However, it may
be better to base relationships on fibre spacing directly as porosity is a volume averaged parameter and may
smooth out the local anisotropy introduced by compression.
Chi et al. have studied the effect of compression on the fuel cell performance using a continuum model of
a single PEMFC with a serpentine flow channel [47]. They find that saturation increases downstream when
compression effects on the absolute permeability are accounted for. However, the effect of compression on
the relative permeability or the capillary pressure is not mentioned. Further detailed investigation of how
compression alters these key relationships is required for modelling purposes to understand the whole effect
of compression on PEMFC performance and flooding.
4. Conclusions
The effect of compression on a representative PEMFC gas diffusion layer has been modelled using
com-putational fluid dynamics. Five geometries were meshed utilising a structured tessellation technique and a
single-phase study revealed that a switch in permeability occurs at high compression where the
through-plane permeability becomes greater than the in-through-plane permeability. A simplified Kozeny-Carman relation
using an effective capillary tube diameter is found to agree very well with the numerical data and reproduces
the permeability switch at the correct level of compression.
Multiphase simulations using three of the geometries reveal that liquid transport is directed by
com-pression resulting in a lower saturation at breakthrough. The cases with mild or no comcom-pression display
high levels of lateral spreading owing to the bifurcations in liquid flow path and uniform surface tension
in both directions whereas the case with high compression exhibits preferential liquid pathways and fast
water ejection. When the contact angle is reduced to represent a neutrally wettable media the effect is also
reduced signifying both the importance of structure and surface energy in determining the liquid flow.
These findings help to explain some of the previous experimental observations in Table 1 but further
work is required to establish relations for the relative permeability as a function of compression ratio and
investigations using PNMs or other techniques and highlights the need for further understanding on the
topic of transport under compression. Moreover, a critical assumption highlighted by this study is how
the fibre spacing changes in each direction under compression. The absolute in-plane and through-plane
permeability of the medium could be used to determine whether tensorial relative permeability exists. From
the findings it can also be concluded that increasing the through-plane permeability by other methods would
have a beneficial impact on the liquid water transfer.
Acknowledgements
The first author would like to thank the ETII, University of Leeds for providing the resources and the
5. Nomenclature
Roman
A[m2
] Cross-sectional area Dp,i[m] Pore diameter in directioni
g[m2
s−1] Gravitational constant
K0[m 2
] Absolute permeability L[m] Length
P[P a] Pressure Q[m3
s−1] Volumetric flow rate
R[m] Fibre radius r[m] Pore radius
s Saturation
t Tortuosity
V[m3
] Volume
vi[s−
1
] Velocity of phasei
Greek
α Volume fraction of phaseq
ǫ Porosity
θ[deg] Contact angle κ[m−1] Curvature of interface
µ[P as] Dynamic viscosity φ[deg] Interfacial Orientation ρ[kgm−3] Density
σ[P am−1] Surface tension coefficient
τ[P a] Stress Tensor
Abbreviations
CFD Computational Fluid Dynamics CR Compression Ratio
CSF Continuum Surface Force GDL Gas Diffusion Layer HPC High Performance Computng MEA Membrane Electrode Assembly PEMFC Polymer Electrolyte Membrane
Fuel Cell
PNM Pore Network Model PTFE Polytetrafluoroethylene VOF Volume of Fluid
Suffices c Capillary g Gas l Liquid p pore v viscous w water
References
[1] S. Park, J.-W. Lee, B. N. Popov, A review of gas diffusion layer in PEM fuel cells: Materials and designs, International
Journal of Hydrogen Energy 37 (7) (2012) 5850–5865.doi:10.1016/j.ijhydene.2011.12.148.
[2] X. Li, I. Sabir, Review of bipolar plates in PEM fuel cells: Flow-field designs, International Journal of Hydrogen Energy
30 (4) (2005) 359–371. doi:10.1016/j.ijhydene.2004.09.019.
[3] I. Nitta, T. Hottinen, O. Himanen, M. Mikkola, Inhomogeneous compression of PEMFC gas diffusion layer, Journal of
Power Sources 171 (1) (2007) 26–36. doi:10.1016/j.jpowsour.2006.11.018.
[4] J. Ge, A. Higier, H. Liu, Effect of gas diffusion layer compression on PEM fuel cell performance, Journal of Power Sources
159 (2) (2006) 922–927. doi:10.1016/j.jpowsour.2005.11.069.
[5] J. T. Gostick, M. W. Fowler, M. D. Pritzker, M. A. Ioannidis, L. M. Behra, In-plane and through-plane gas permeability
of carbon fiber electrode backing layers, Journal of Power Sources 162 (1) (2006) 228–238. doi:10.1016/j.jpowsour.
2006.06.096.
[6] A. Bazylak, D. Sinton, Z.-S. Liu, N. Djilali, Effect of compression on liquid water transport and microstructure of PEMFC
gas diffusion layers, Journal of Power Sources 163 (2) (2007) 784–792. doi:10.1016/j.jpowsour.2006.09.045.
[7] M. Ismail, T. Damjanovic, D. B. Ingham, L. Ma, M. Pourkashanian, Effect of polytetrafluoroethylene-treatment and
microporous layer-coating on the in-plane permeability of gas diffusion layers used in proton exchange membrane fuel
cells, Journal of Power Sources 195 (19) (2010) 6619–6628.doi:10.1016/j.jpowsour.2010.04.036.
[8] Y. Gao, T. Nguyen, D. Hussey, D. Jacobson, In Situ Imaging of Water Distribution in a Gas Diffusion Layer by Neutron
Radiography, ECS Transactions 33 (1) (2010) 1435–1441.doi:10.1149/1.3484635.
[9] T. Sasabe, S. Tsushima, S. Hirai, In-situ visualization of liquid water in an operating PEMFC by soft X-ray radiography,
International Journal of Hydrogen Energy 35 (20) (2010) 11119–11128.doi:10.1016/j.ijhydene.2010.06.050.
[10] B. Ramos-Alvarado, J. D. Sole, A. Hernandez-Guerrero, M. W. Ellis, Experimental characterization of the water transport
properties of PEM fuel cells diffusion media, Journal of Power Sources 218 (2012) 221–232. doi:10.1016/j.jpowsour.
2012.05.069.
[11] J. James, H.-W. Choi, J. Pharoah, X-ray computed tomography reconstruction and analysis of polymer electrolyte
membrane fuel cell porous transport layers, International Journal of Hydrogen Energy 37 (23) (2012) 18216–18230.
doi:10.1016/j.ijhydene.2012.08.077.
[12] T. J. Mason, J. Millichamp, P. R. Shearing, D. J. Brett, A study of the effect of compression on the performance of polymer
electrolyte fuel cells using electrochemical impedance spectroscopy and dimensional change analysis, International Journal
of Hydrogen Energy 38 (18) (2013) 7414–7422. doi:10.1016/j.ijhydene.2013.04.021.
[13] M. Mortazavi, K. Tajiri, Liquid water breakthrough pressure through gas diffusion layer of proton exchange membrane
fuel cell, International Journal of Hydrogen Energy 39 (17) (2014) 9409–9419.doi:10.1016/j.ijhydene.2014.03.238.
[14] T. Hottinen, O. Himanen, S. Karvonen, I. Nitta, Inhomogeneous compression of PEMFC gas diffusion layer, Journal of
Power Sources 171 (1) (2007) 113–121. doi:10.1016/j.jpowsour.2006.10.076.
[15] Z. Su, C. Liu, H. Chang, C. Li, K. Huang, P. Sui, A numerical investigation of the effects of compression force on PEM
fuel cell performance, Journal of Power Sources 183 (1) (2008) 182–192.doi:10.1016/j.jpowsour.2008.04.060.
[16] Y. Wang, K. S. Chen, Effect of Spatially-Varying GDL Properties and Land Compression on Water Distribution in PEM
[17] K.-J. Lee, J. H. Nam, C.-J. Kim, Pore-network analysis of two-phase water transport in gas diffusion layers of polymer
electrolyte membrane fuel cells, Electrochimica Acta 54 (4) (2009) 1166–1176.doi:10.1016/j.electacta.2008.08.068.
[18] J. H. Nam, M. Kaviany, Effective diffusivity and water-saturation distribution in single- and two-layer PEMFC diffusion
medium, International Journal of Heat and Mass Transfer 46 (24) (2003) 4595–4611. doi:10.1016/S0017-9310(03)
00305-3.
[19] S. Litster, D. Sinton, N. Djilali, Ex situ visualization of liquid water transport in PEM fuel cell gas diffusion layers, Journal
of Power Sources 154 (1) (2006) 95–105. doi:10.1016/j.jpowsour.2005.03.199.
[20] J. W. Park, K. Jiao, X. Li, Numerical investigations on liquid water removal from the porous gas diffusion layer by reactant
flow, Applied Energy 87 (7) (2010) 2180–2186.doi:10.1016/j.apenergy.2009.11.021.
[21] P. Suresh, S. Jayanti, Effect of air flow on liquid water transport through a hydrophobic gas diffusion layer of a polymer
electrolyte membrane fuel cell, International Journal of Hydrogen Energy 35 (13) (2010) 6872–6886. doi:10.1016/j.
ijhydene.2010.04.052.
[22] A. Theodorakakos, T. Ous, M. Gavaises, J. M. Nouri, N. Nikolopoulos, H. Yanagihara, Dynamics of water droplets
detached from porous surfaces of relevance to PEM fuel cells., Journal of Colloid and Interface Science 300 (2) (2006)
673–87.doi:10.1016/j.jcis.2006.04.021.
[23] C. E. Colosqui, M. J. Cheah, I. G. Kevrekidis, J. B. Benziger, Droplet and slug formation in polymer electrolyte membrane
fuel cell flow channels: The role of interfacial forces, Journal of Power Sources 196 (23) (2011) 10057–10068. doi:
10.1016/j.jpowsour.2011.08.084.
[24] Z. Zhan, C. Wang, W. Fu, M. Pan, Visualization of water transport in a transparent PEMFC, International Journal of
Hydrogen Energy 37 (1) (2012) 1094–1105. doi:10.1016/j.ijhydene.2011.02.081.
[25] N. Zamel, X. Li, Effective transport properties for polymer electrolyte membrane fuel cells With a focus on the gas
diffusion layer, Progress in Energy and Combustion Science 39 (1) (2013) 111–146. doi:10.1016/j.pecs.2012.07.002.
[26] P. Chippar, K. O, K. Kang, H. Ju, A numerical investigation of the effects of GDL compression and intrusion in polymer
electrolyte fuel cells (PEFCs), International Journal of Hydrogen Energy 37 (7) (2012) 6326–6338. doi:10.1016/j.
ijhydene.2011.04.154.
[27] A. El-kharouf, T. J. Mason, D. J. Brett, B. G. Pollet, Ex-situ characterisation of gas diffusion layers for proton exchange
membrane fuel cells, Journal of Power Sources 218 (2012) 393–404. doi:10.1016/j.jpowsour.2012.06.099.
[28] M. Ismail, D. Borman, T. Damjanovic, D. B. Ingham, M. Pourkashanian, On the through-plane permeability of
micro-porous layer-coated gas diffusion layers used in proton exchange membrane fuel cells, International Journal of Hydrogen
Energy 36 (16) (2011) 10392–10402. doi:10.1016/j.ijhydene.2010.09.012.
[29] J. Ward, Turbulent flow in porous media, University of Arkansas, Engineering Experiment Station, 1965.
[30] P. K. Sinha, C.-Y. Wang, Pore-network modeling of liquid water transport in gas diffusion layer of a polymer electrolyte
fuel cell, Electrochimica Acta 52 (28) (2007) 7936–7945. doi:10.1016/j.electacta.2007.06.061.
[31] Y. Tabe, Y. Lee, T. Chikahisa, M. Kozakai, Numerical simulation of liquid water and gas flow in a channel and a simplified
gas diffusion layer model of polymer electrolyte membrane fuel cells using the lattice Boltzmann method, Journal of Power
Sources 193 (1) (2009) 24–31.doi:10.1016/j.jpowsour.2009.01.068.
[32] Z. Y. Ahmad, S. Didari, J. Moon, T. A. Harris, Computational fluid dynamics of water droplet formation and detachment
from gas diffusion layer, ECS Transactions 45 (23) (2013) 89–100. doi:10.1149/04523.0089ecst.
membrane fuel cell gas diffusion layers, Journal of Power Sources 195 (3) (2010) 787–793.doi:10.1016/j.jpowsour.2009. 08.032.
[34] J. T. Gostick, M. A. Ioannidis, M. W. Fowler, M. D. Pritzker, Wettability and capillary behavior of fibrous gas diffusion
media for polymer electrolyte membrane fuel cells, Journal of Power Sources 194 (1) (2009) 433–444. doi:10.1016/j.
jpowsour.2009.04.052.
[35] W. Purcell, Interpretation of capillary pressure data, Journal of Petroleum Technology 189 (1950) 369–371.doi:10.2118/
950369-G.
[36] G. Mason, N. Morrow, Effect of contact angle on capillary displacement curvatures in pore throats formed by spheres,
Journal of Colloid and Interface Sciencedoi:10.1006/jcis.1994.1402.
[37] J. T. Gostick, Random Pore Network Modeling of Fibrous PEMFC Gas Diffusion Media Using Voronoi and Delaunay
Tessellations, Journal of the Electrochemical Society 160 (8) (2013) F731–F743.doi:10.1149/2.009308jes.
[38] J. Brackbill, D. Kothe, C. Zemach, A continuum method for modeling surface tension, Journal of Computational Physics
100 (1992) 335–354.doi:10.1016/0021-9991(92)90240-Y.
[39] Ansys, 14.0 theory guide, ANSYS inc.
[40] M. M. Tomadakis, T. J. Robertson, Viscous Permeability of Random Fiber Structures: Comparison of Electrical and
Diffusional Estimates with Experimental and Analytical Results, Journal of Composite Materials 39 (2) (2005) 163–188.
doi:10.1177/0021998305046438.
[41] M. M. Tomadakis, S. V. Sotirchos, Knudsen diffusivities and properties of structures of unidirectional fibers, AIChE
Journal 37 (8) (1991) 1175–1186.doi:10.1002/aic.690370807.
[42] B. Gebart, Permeability of Unidirectional Reinforcements for RTM, Journal of Composite Materials 26 (8) (1992) 1100–
1133. doi:10.1177/002199839202600802.
[43] V. Radhakrishnan, P. Haridoss, Effect of cyclic compression on structure and properties of a Gas Diffusion Layer used in
PEM fuel cells, International Journal of Hydrogen Energy 35 (20) (2010) 11107–11118. doi:10.1016/j.ijhydene.2010.
07.009.
[44] A. Bazylak, V. Berejnov, B. Markicevic, D. Sinton, N. Djilali, Numerical and microfluidic pore networks: Towards designs
for directed water transport in GDLs, Electrochimica Acta 53 (26) (2008) 7630–7637. doi:10.1016/j.electacta.2008.
03.078.
[45] Z. Zhan, J. Xiao, Y. Zhang, M. Pan, R. Yuan, Gas diffusion through differently structured gas diffusion layers of PEM
fuel cells, International Journal of Hydrogen Energy 32 (17) (2007) 4443–4451.doi:10.1016/j.ijhydene.2007.03.041.
[46] P. A. Garc´ıa-Salaberri, M. Vera, I. Iglesias, Modeling of the anode of a liquid-feed DMFC: Inhomogeneous compression
effects and two-phase transport phenomena, Journal of Power Sources 246 (2014) 239–252. doi:10.1016/j.jpowsour.
2013.06.166.
[47] P. Chi, S. Chan, F. Weng, A. Su, P. Sui, N. Djilali, On the effects of non-uniform property distribution due to compression
in the gas diffusion layer of a PEMFC, International Journal of Hydrogen Energy 35 (7) (2010) 2936–2948.doi:10.1016/
List of table and figure captions
Figure 1: Schematic illustration of PEMFC showing compression of GDL occurs up to the thickness of the
gasket.
Figure 2: Unit cell with characteristic lengths for the modelling domain.
Figure 3: Tessellated Structured Mesh.
Figure 4: Schematic of a meniscus in the converging-diverging orifice of a toroid ring. For a non-zero contact
angle, the position of the maximum meniscus curvature is below the constriction in the torus.[36]
Figure 5: Comparison of the through-plane velocity profiles: Uncompressed case has uniform flow whereas
most compressed case shows areas of low velocity and capillary tube like flow.
Figure 6: Comparison of key flow data for the uncompressed case (A) and most compressed case (E): (a)
effective capillary tube diameter, (b) tangential pressure gradient along stream-line (c) tangential velocity
along streamline.
Figure 7: Average effective capillary tube diameter ( ¯Def f) for single-phase flow in the in-plane (x) and
through-plane (y) directions.
Figure 8: Absolute permeability as a function of compression ratio with simple Kozeny-Carman relationship.
Figure 9: Uncompressed geometry showing liquid permeation as a function of time from 3 inlets through the
fibrous GDL and emerging as a droplet in the channel.
Figure 10: Mid-level compression (CR = 22.22%) case showing liquid permeation as a function of time from
3 inlets through the fibrous GDL and emerging as a droplet in the channel.
Figure 11: Most compressed case (CR = 44.44%) showing liquid permeation as a function of time from 3
inlets through the fibrous GDL and emerging as 3 separate droplets in the channel with no lateral spreading
of the paths.