Open Access
Research article
Inter-rater reliability of nursing home quality indicators in the U.S
Vincent Mor*
1, Joseph Angelelli
1, Richard Jones
2, Jason Roy
1, Terry Moore
3and John Morris
2Address: 1Brown University Department of Community Health & Center for Gerontology and Health Care Research, Providence, RI., USA, 2Hebrew Rehabilitation Center for Aged, Research and Training Center, Boston, Mass., USA and 3Abt Associates, Inc., Cambridge, Mass., USA
Email: Vincent Mor* - [email protected]; Joseph Angelelli - [email protected]; Richard Jones - [email protected]; Jason Roy - [email protected]; Terry Moore - [email protected]; John Morris - [email protected]
* Corresponding author
Abstract
Background: In the US, Quality Indicators (QI's) profiling and comparing the performance of hospitals, health plans, nursing homes and physicians are routinely published for consumer review. We report the results of the largest study of inter-rater reliability done on nursing home assessments which generate the data used to derive publicly reported nursing home quality indicators.
Methods: We sampled nursing homes in 6 states, selecting up to 30 residents per facility who were observed and assessed by research nurses on 100 clinical assessment elements contained in the Minimum Data Set (MDS) and compared these with the most recent assessment in the record done by facility nurses. Kappa statistics were generated for all data items and derived for 22 QI's over the entire sample and for each facility. Finally, facilities with many QI's with poor Kappa levels were compared to those with many QI's with excellent Kappa levels on selected characteristics.
Results: A total of 462 facilities in 6 states were approached and 219 agreed to participate, yielding a response rate of 47.4%. A total of 5758 residents were included in the inter-rater reliability analyses, around 27.5 per facility. Patients resembled the traditional nursing home resident, only 43.9% were continent of urine and only 25.2% were rated as likely to be discharged within the next 30 days.
Results of resident level comparative analyses reveal high inter-rater reliability levels (most items >.75). Using the research nurses as the "gold standard", we compared composite quality indicators based on their ratings with those based on facility nurses. All but two QI's have adequate Kappa levels and 4 QI's have average Kappa values in excess of .80. We found that 16% of participating facilities performed poorly (Kappa <.4) on more than 6 of the 22 QI's while 18% of facilities performed well (Kappa >.75) on 12 or more QI's. No facility characteristics were related to reliability of the data on which Qis are based.
Conclusion: While a few QI's being used for public reporting have limited reliability as measured in US nursing homes today, the vast majority of QI's are measured reliably across the majority of nursing facilities. Although information about the average facility is reliable, how the public can identify those facilities whose data can be trusted and whose cannot remains a challenge.
Published: 04 November 2003
BMC Health Services Research 2003, 3:20
Received: 09 June 2003 Accepted: 04 November 2003
This article is available from: http://www.biomedcentral.com/1472-6963/3/20
Background
Health care providers' and insurers' accountability for the services that they render is increasingly a subject of con-cern to regulators, advocates and consumers [1]. As efforts to contain costs while increasing competition in the health care field have advanced in many countries, con-cerns about deteriorating quality of care now receive even more attention than health care costs. Measuring health care quality and comparing providers' performance has emerged as the most hopeful strategy for holding them accountable for the care they provide. [2]
Now quality measurement, performance monitoring and quality improvement is a constant refrain in the entire sec-tor in the US. [3] Hospitals regularly produce statistics regarding their performance in selected clinical areas and most are now surveying their patients about their satisfac-tion with the care they receive. [4,5] Insurers, particularly managed care companies, are routinely compared on how well they insure that preventive health services are deliv-ered to their subscribers.[6] Surgeons' mortality rates are publicly reported in several US states while ambulatory practices' performance in holding down waiting times and measuring blood glucose levels is compared and pro-viders are rewarded accordingly. [7,8] Finally, since late 2002 all nursing homes in the US are compared on numerous quality indicators developed over the past dec-ade, and the results regularly advertised in local newspa-pers and posted permanently on a web site. [9–11]
Measures of nursing home quality have frequently been proposed and used by researchers in the past, but gener-ally only for a small number of facilities or in select groups of facilities. Until recently, most such measures were based upon aggregate data reported by the home as part of the federally required survey and certification proc-ess.[12,13] However, the federally mandated universal introduction of the Minimum Data Set (MDS) for resident assessment in all nursing homes in 1991 made it possible to construct uniform measures based upon common data characterizing all residents of all facilities.[13,14] The MDS was designed to improve the quality of clinical needs assessment to facilitate improved care planning for this increasingly frail population.[15] A comprehensive assessment is done upon admission to the facility parts of which are updated periodically thereafter with a complete reassessment done annually. As part of its changing approach to monitoring provider quality, in 1998 the gov-ernment began requiring all nursing homes to computer-ize all the MDS assessments performed on all residents as a condition of participation in the Medicare and Medicaid programs. By 2002 over 10 million assessments a year were being entered into a national nursing home database.
Prior to and throughout the course of its implementation, the MDS was repeatedly tested for inter-rater reliability among trained nurse assessors in nursing homes, large and small, for-profit and voluntary, throughout the coun-try. Results of these tests revealed adequate levels of relia-bility when the MDS was first implemented nationally in late 1990.[16] A modified version of the MDS was designed and retested in 1995 and was found to have improved in reliability in those areas with less than ade-quate reliability while sustaining reasonably high reliabil-ity in other areas. [17–19] While testing under research conditions revealed adequate reliability, other studies found comparisons of research assessments with those in the facility chart to be less positive. One study of 30 facil-ities found discrepancies in 67% of the items compared across residents and facilities but that often "errors" were miscoding into adjacent categories and the bias was not systematic (neither "up-coding" exacerbate nor "down-coding" to minimize the condition). Indeed, when relia-bility was assessed using the weighted Kappa statistic, the authors found that many items with poor absolute agree-ment rates did achieve adequate reliability.[20] The Office of the Inspector General undertook an audit in several facilities in 8 different states and also identified discrepan-cies between data in the chart and residents' conditions on independent assessment. [21] Analysis of observed dis-crepancies didn't differentiate between those within one category or those that differed by more than one category in an ordinal scale, suggesting that had a weighted Kappa statistic been used, the results would have been more comparable with those reported by Morris and his colleagues.
The availability of clinically relevant, universal, uniform, and computerized information on all nursing home resi-dents raised the possibility of using this information to improve nursing home care quality. As with most efforts designed to improve health care quality, the incentives and the targets were multifaceted. First, government regu-lators anticipated that creating indicators of nursing homes' quality performance would guide and make more rigorous and systematic existing regulatory oversight proc-esses that had been characterized as idiosyncratic. Sec-ondly, the more enlightened facility administrators felt that such information could facilitate their own existing quality improvement activities. Finally, advocates for nursing home residents thought that making this infor-mation available would create greater "transparency" to guide consumers' choices of a long-term care facility.
facility. Zimmerman and his colleagues were among the first to develop, test and apply them. [22] Medical care quality process measures based upon medical record review have been proposed and the Joint Commission on the Accreditation of Health Care Organizations (JCAHO) has instituted a mandatory mechanism for reporting an outcome indicator data set for all nursing homes they accredit. [23,24] In 1998 the Centers' for Medicare and Medicaid (CMS) contracted with the authors' organiza-tions to undertake a comprehensive review of existing QI's for nursing homes with an aim of modifying or develop-ing new QI's on which to compare facilities with the ulti-mate purpose of reporting those publicly. [9] While this effort focused on all possible QI domains, most attention was focused on care processes and clinical outcomes. To address this gap, CMS issued another contract to develop QI's specifically designed to measure quality of life in nursing homes, but this effort remains in the develop-mental stage. [25]
After a 6 month six-state pilot project using a sub-set of the newly revised clinical process and outcome quality indicators, the Centers for Medicare and Medicaid Services (CMS) began to publish on their web-site facility-specific, MDS-based quality measures for every Medicare/Medicaid certified nursing facility in the country. The quality meas-ures, applied to both long-stay and short-stay post-acute nursing home residents, included items such as pressure ulcer prevalence, restraint use, mobility improvement, pain, and ADL decline. Advertisements were published in every major newspaper ranking most nursing homes in the community in the form of "league tables". Data on all measures for all facilities were included on CMS' "Nursing Home Compare" web site http://www.medicare.gov/ NHCompare/home.asp.
As part of a national study to validate the newly revised and developed quality indicators, we undertook the larg-est tlarg-est of the inter-rater reliability of the MDS ever con-ducted in order to determine whether the data elements used in the construction of quality indicators are suffi-ciently reliable to be used as the basis for public reporting. Prior testing of the MDS had generally been done in select facilities so the current study sought to estimate reliability across all raters in all facilities. Since quality indicators represent a facility specific aggregation of particular patient characteristics recorded on the MDS, we sought to identify the degree to which there was variability in relia-bility across facilities.
Methods
OverviewParticipating facilities in six states agreed to allow trained research nurses enter the facility, interview management staff, observe patient interactions and abstract a sample of
up to 30 patient records. Research nurses conducted inde-pendent resident assessments of sampled residents by observing the patient, reviewing the chart and asking front line staff about the residents' behavior. Some 100 data ele-ments collected as part of the research nurses' assessele-ments were compared to the most recent MDS for that patient done by facility nurses. The Kappa statistic was calculated for each data element and for the composite QI's for all residents and separately per facility.
Sampling States, Facilities and Subjects
The final analytic sample for this study was comprised of 209 freestanding and hospital-based facilities located in six states: California, Illinois, Missouri, Ohio, Pennsylva-nia and Tennessee. States were selected for regional repre-sentation and size in terms of numbers of facilities. Facility selection was stratified based upon volume of post-hospital discharge, sub-acute care provided, as indi-cated by whether the facility is hospital based or not. Within these two strata, we sought to select facilities based upon their QI scores in the year prior to the study (2000) in order to compare historically poor and well performing facilities. A total of 338 non-hospital based facilities and 124 hospital-based facilities were approached about par-ticipating in the study.
We attempted to select 30 residents per facility. In non-hospital based facilities, the sample was comprised of 10 residents with a recently completed admission MDS assessment; 10 residents with a recently completed quar-terly MDS assessment; and 10 residents with a recently completed annual MDS assessment. "Recently pleted" assessments were defined as those that were com-pleted one-month prior to the nurse researcher arriving at the site. If a sample could not be captured with recently completed assessments, the nurse assessors looked back as far as 90 days to fulfill the sample. In hospital-based facilities, the sample was the 30 most recently assessed patients.
Nurse Training and Data Collection
corresponding guidelines for assessment from the stand-ard MDS User's Manual. Trainees were instructed to fol-low the standard assessment processes specified in the User's Manual using multiple sources of information (e.g., resident observation, interviews with direct care staff, chart review). Scripted videotaped vignettes were pre-sented to demonstrate interviewing techniques and to provide practice in coding. Trainees were paired for role-playing exercises to practice their interviewing skills. Case presentations and follow-up discussion were used to illus-trate assessment techniques and correct coding responses. To certify competency in MDS assessment, each trainee completed a case and met individually with the lead trainer for review.
The field protocol had two component parts. The nurse assessor first completed the MDS, talking with the resi-dent and knowledgeable staff member and reviewing the medical record for the two-week assessment window. Once this was completed, the nurse assessor conducted a number of QI validation related activities, including con-ducting three "walk-thru's" of the facility to characterize the ambience of the nursing home and facility care prac-tices, received and reviewed a self-administered survey completed by the Administrator or Director of Nursing of the facility, and completed a process related record review.
Nurse assessors were instructed to complete MDS assess-ments according to instructions provided in the Long Term Care Resident Assessment Instrument (RAI) User's Manual, Version 2.0 (October 1995). All relevant sources of information regarding resident status, including medi-cal records, communication with residents and staff (including the CNA most familiar with the resident), and observation of residents, were to be utilized in determin-ing the codes to be used for each of the 100 MDS items included in the reliability study. Per the RAI User's Man-ual, the medical record review was to provide a starting point in the assessment process. No additional guidance or criteria for assessment was communicated by the project team; thus, nurse assessors were expected to rely on clinical judgment and the face validity of the various data sources when making final determinations regarding MDS item coding. Finally, nurse assessors were instructed to complete MDS assessments prior to completing other data collection protocols, in order to ensure impartiality.
Two research nurses undertook data collection at each participating facility. Nurse researchers were required to complete at least two independent, paired assessments with their partner per facility. These cases were selected at random once the resident sample at each facility had been selected. Nurses were not to share findings until each of their assessments was complete and data entered (all data were entered into laptops by research nurses on site using
customized software). Inter-rater review cases were sub-mitted to project investigators. While there were not enough residents assessed by the same pair of raters to permit inter-rater reliability assessments for each research nurse, we pooled the paired reliability assessments done among the research nurses. In this way, we established the general inter-rater reliability of the research nurses as an overall group. These data made it possible to substantiate the degree of agreement among the research nurses to insure that they could be treated as the "gold standard".
Measures
The abbreviated version of the MDS contained over 100 data elements. These data elements included both dichot-omous (e.g. dementia present yes or no) as well as ordinal elements (e.g. 5 levels of dependence in ambulation or transfer). Virtually all items included in the assessment were required in the construction of one of the 22 dichot-omous cross-sectional QI's tested as part of the overall study. Only cross-sectional quality indicators could be tested for reliability since our reliability data were based upon a single point in time when we did the data collec-tion in each facility. Longitudinal incidence or change quality indicators require measures of patient status at two consecutive assessments. Data elements included: cognitive patterns; communication/hearing patterns; mood and behavior patterns; physical functioning; conti-nence in last 14 days; disease diagnoses; health condi-tions; oral/nutritional status; skin condicondi-tions; activity pursuit patterns; medications; special treatment proce-dures; and discharge potential and overall status. These items were selected both because they were incorporated into the construction of many of the QI's and because they constitute readily observable residents conditions as well as more complex clinical judgments.
Analytic Approach
The approach used to test inter-rater reliability is the Kappa statistic, or the weighted Kappa for ordinal meas-ures such as ADL performance, etc. [26–28]
This statistic compares the two sets of raters who have each observed and assessed the same patient independ-ently. However, rather than merely calculate the percent-age of cases on which they agree, the Kappa statistic corrects for "chance" agreement, where "chance" is a func-tion of the prevalence of the condifunc-tion being assessed. It is possible that two raters could agree 98 percent of the time that a resident had episodes of disorganized speech. However, it might be the case that when one rater thought disorganized speech was present the other never agreed. In this instance, in spite of the fact that the level of agree-ment would be very high, the Kappa would be very low. [29] Depending upon the importance of the assessment construct, having a low Kappa in the face of very high agreement and high prevalence could be very problem-atic, or trivial. However, since some quality indicators have relatively low prevalence, meaning that infrequent disagreements might be very important, we were quite sensitive to this possibility. For this reason, we present the Kappa statistic as well as the percentage agreement of the facility raters relative to the "gold standard" research nurses. The weighted and unweighted Kappas are identi-cal for dichotomous (binary) measures such as all the Quality Indicators (presence or absence); however, the ordinal measures like ADL or cognitive decision-making are more appropriately assessed with the weighted Kappa.
The quality indicators are supposed to reflect the
perform-ance of a facility viz. a given aspect of quality. The
reliabil-ity of each QI is actually a function of the reliabilreliabil-ity of the constituent data elements. [30] Even if the QI is com-posed of ordinal data elements (e.g. level of dependence in mobility), the QI definition of the numerator is based upon a specific "cut-point" which results in a dichoto-mous variable. Thus, in most instances the inter-rater reli-ability of a QI measured across numerous patients in a facility will be lower than that of most of the constituent elements, particularly if these are ordinal measures. Kappa statistics were calculated for all constituent data elements for each of the 22 QI's as well as for each QI for each facil-ity in the study.
By convention, a Kappa statistics that is .70 or higher is excellent whereas a Kappa statistic that is less than .4 is considered unacceptable and levels in between are accept-able. We apply these conventions in our interpretation of the inter-rater reliability data, both of the individual MDS data elements as well as the composite, dichotomous Quality Indicators. The number of pairs of observations per facility is between 25 and 30. This number of
observa-tions yields a fairly stable estimate of inter-rater reliability to characterize the facility, given that the observations are representative of the residents and nurse raters in the facil-ity and conditional on the relative prevalence and distri-bution of the condition (e.g. dementia or pain) in the facility. In some instances, restrictions on the residents included in the denominator of a QI results in reducing the number of paired comparisons within a facility. We set an arbitrary minimum number of paired cases needed to calculate the Kappa statistic at 5. The confidence inter-val around an estimate of the Kappa is a function of the absolute percentage agreement, the prevalence, or vari-ance, of the condition as well as the number of pairs being compared. Holding constant the prevalence and agree-ment rate, the size of the confidence interval is primarily related to the number of observations. For a facility with 30 paired observations, the approximate 95% confidence interval is .25 whereas for only 5 observations it is +/-.65. This lower threshold was almost never reached for any of the participating facilities. Since most measures in almost all facilities were based upon 25 or more residents, the results section doesn't present confidence intervals, preferring to provide information on the prevalence of the condition.
Results
A total of 462 facilities in 6 states were approached and 219 agreed to participate, yielding a response rate of 47.4%. The response rate for hospital-based facilities (N = 65 participating) was 52.4% and the response rate for free-standing facilities (N = 154 participating) was 45.6%. Of the 219 facilities that participated in some part of the over all study, 10 (6 hospital based) chose not to partici-pate in the inter-rater reliability component. Participating facilities were of similar size (average of 110 beds), but were less likely to be part of a chain (52.5% vs. 58.4%) or to be proprietary (50.2% vs. 61.7%).
A total of 5758 residents were included in the inter-rater reliability analyses, around 27.5 per facility. Patients resembled the traditional nursing home resident, only 43.9% were continent of urine, 1.7% were coded as hav-ing end stage disease and only 25.2% were rated as likely to be discharged within the next 30 days (most of these were in hospital based facilities).
research and facility assessments that was greater than 30 days and when the QI Kappa values for these facilities was compared to those with shorter intervals, we found no sta-tistically significant differences on any QI Kappa. Thus, all assessments of both the facility and the research nurse assessors were included in all reliability analyses.
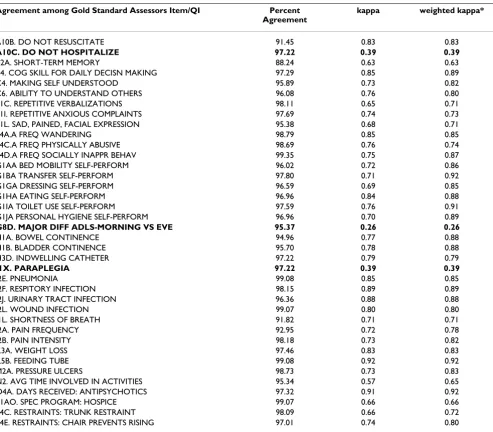
A total of 119 patients were independently assessed by two research nurses. Table 1 presents the results of the comparisons for a number of the individual data elements included in the assessment. Almost all the data elements reveal Kappa values in the excellent range and only 3 were found to be in the poor range. Inter-rater reliability was
[image:6.612.63.556.98.530.2]calculated for all 100 data elements and only the 3 items shown were found to be in the "poor" range. Most not shown had Kappa values resembling those shown. Those data elements where the weighted Kappa value is higher than the simple Kappa are ordinal response measures. Additional variation in the distribution generally results in higher Kappa values. However, even for the 5 category ordinal response measures like dressing or pain intensity, we found very high rates of absolute agreement suggesting that these research nurses really are assessing patients in the same way as can be seen in table one below.
Table 1: Inter-Rater Reliability Statistics of MDS items for Research Nurse Pairs
Agreement among Gold Standard Assessors Item/QI Percent Agreement
kappa weighted kappa*
A10B. DO NOT RESUSCITATE 91.45 0.83 0.83
A10C. DO NOT HOSPITALIZE 97.22 0.39 0.39
B2A. SHORT-TERM MEMORY 88.24 0.63 0.63
B4. COG SKILL FOR DAILY DECISN MAKING 97.29 0.85 0.89
C4. MAKING SELF UNDERSTOOD 95.89 0.73 0.82
C6. ABILITY TO UNDERSTAND OTHERS 96.08 0.76 0.80
E1C. REPETITIVE VERBALIZATIONS 98.11 0.65 0.71
E1I. REPETITIVE ANXIOUS COMPLAINTS 97.69 0.74 0.73
E1L. SAD, PAINED, FACIAL EXPRESSION 95.38 0.68 0.71
E4A.A FREQ WANDERING 98.79 0.85 0.85
E4C.A FREQ PHYSICALLY ABUSIVE 98.69 0.76 0.74
E4D.A FREQ SOCIALLY INAPPR BEHAV 99.35 0.75 0.87
G1AA BED MOBILITY SELF-PERFORM 96.02 0.72 0.86
G1BA TRANSFER SELF-PERFORM 97.80 0.71 0.92
G1GA DRESSING SELF-PERFORM 96.59 0.69 0.85
G1HA EATING SELF-PERFORM 96.96 0.84 0.88
G1IA TOILET USE SELF-PERFORM 97.59 0.76 0.91
G1JA PERSONAL HYGIENE SELF-PERFORM 96.96 0.70 0.89
G8D. MAJOR DIFF ADLS-MORNING VS EVE 95.37 0.26 0.26
H1A. BOWEL CONTINENCE 94.96 0.77 0.88
H1B. BLADDER CONTINENCE 95.70 0.78 0.88
H3D. INDWELLING CATHETER 97.22 0.79 0.79
I1X. PARAPLEGIA 97.22 0.39 0.39
I2E. PNEUMONIA 99.08 0.85 0.85
I2F. RESPITORY INFECTION 98.15 0.89 0.89
I2J. URINARY TRACT INFECTION 96.36 0.88 0.88
I2L. WOUND INFECTION 99.07 0.80 0.80
J1L. SHORTNESS OF BREATH 91.82 0.71 0.71
J2A. PAIN FREQUENCY 92.95 0.72 0.78
J2B. PAIN INTENSITY 98.18 0.73 0.82
K3A. WEIGHT LOSS 97.46 0.83 0.83
K5B. FEEDING TUBE 99.08 0.92 0.92
M2A. PRESSURE ULCERS 98.73 0.73 0.83
N2. AVG TIME INVOLVED IN ACTIVITIES 95.34 0.57 0.65
O4A. DAYS RECEIVED: ANTIPSYCHOTICS 97.32 0.91 0.92
P1AO. SPEC PROGRAM: HOSPICE 99.07 0.66 0.66
P4C. RESTRAINTS: TRUNK RESTRAINT 98.09 0.66 0.72
P4E. RESTRAINTS: CHAIR PREVENTS RISING 97.01 0.74 0.80
Using the research nurses as the "gold standard", we com-pared their ratings with those of the facility nurses mani-fest in the MDS in the record. The inter-rater reliability of the MDS assessment items between the "gold standard" and facility nurses revealed that while 15 of the data ele-ments had an "excellent" Kappa value in excess of .75, 28 had poor (< .4) Kappa values. Complete listing of Kappa values of the component data elements for both the gold standard and the research and facility nurse comparisons are available from the authors. By and large those with poor Kappa values were highly skewed and the percent agreement was otherwise quite high.
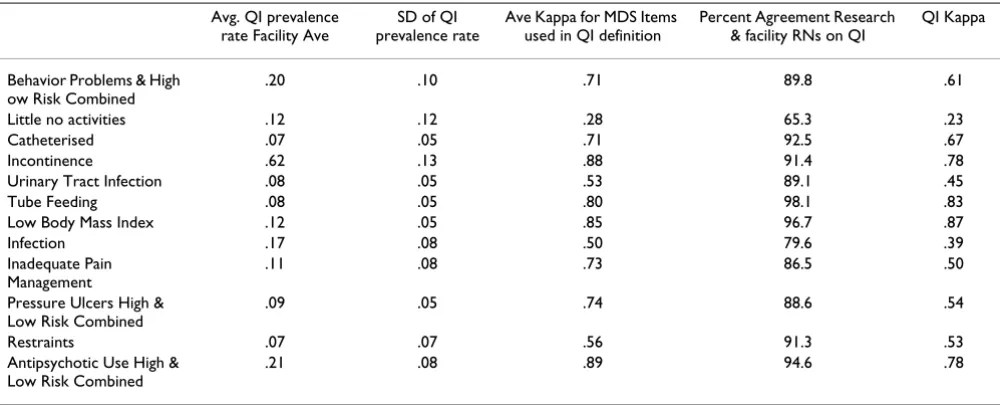
We calculated the average Kappa for each facility for the 22 cross-sectional QIs. Table 2 presents the average pro-portion of patients in study facilities with the designated QI present and the standard deviation among facilities. Also presented is the average Kappa value across all partic-ipating facilities for the MDS data elements that go into defining the denominator and the numerator of each QI. Finally, the last column presents the average Kappa over all facilities for the dichotomous QI. All QI's have ade-quate Kappa levels, although two, "Little or no activity" and "infections", are only barely adequate. On the other hand 4 QI's have Kappa values averaged over all partici-pating facilities in excess of .80 as cam be seen in table 2 below.
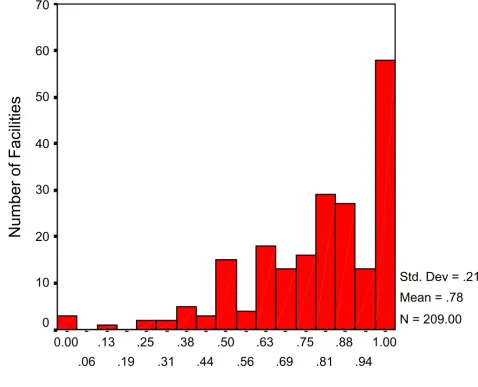
The relatively positive findings on the overall perform-ance of the QI's belies considerable inter-facility variation. Figures 1 and 2 present the distribution of Kappa values for each facility. Kappa values can assume values of less than 0.0 if the variable is skewed and there is little
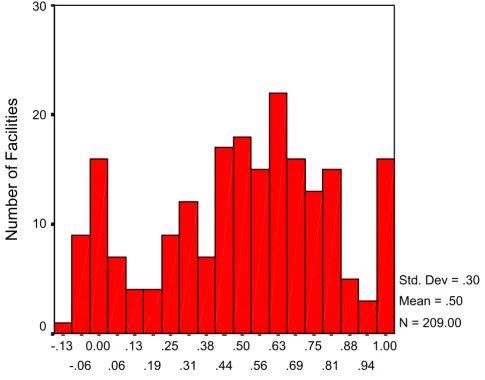
agree-ment between the raters when one records the low preva-lence condition as present and the other does not. As can be seen, while the incontinence QI (Figure 1) has a rea-sonably good Kappa value for most facilities, there are clearly some facilities which did quite poorly. Nearly 60 facilities exhibited almost perfect Kappa values when the "gold" standard and facility assessors are compared but over a dozen had poor performance on the incontinence QI. In the case of the inadequate pain management qual-ity indicator, the average Kappa of .50 reflects a very broad distribution, with over 90 of the 209 facilities having Kappa values in excess of .60 but over 30 facilities with Kappa values of .10 or lower.
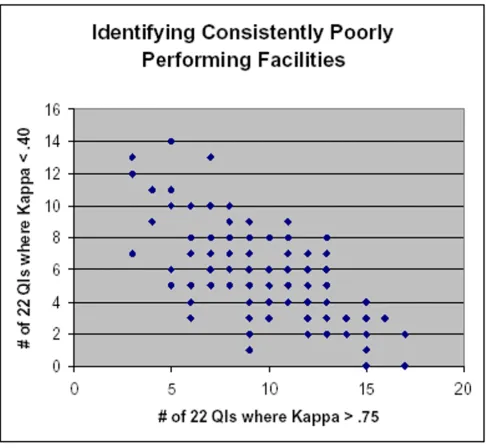
[image:7.612.55.555.100.302.2]We classified facilities in terms of the absolute count of the 22 QIs for which they had a kappa exceeding .75 ver-sus the absolute number of QIs for which the kappa fell below .40. This basically contrasts the likelihood that a facility has QIs with unacceptable Kappa values with the likelihood that they have exceptionally good reliability on some QIs. These two values were then plotted against each other to visually identify facilities that had relatively few HIGH kappa values while having an exceptionally large number of LOW kappas and the reverse. There are clearly facilities in the off-diagonals indicating that they performed very well on some QIs but also performed quite poorly on a reasonably high number of QIs. None-theless, as can be seen in Figure 3, the correlation between these two views of facility QI reliability of measurement was good (-.67) with the average facility having nearly 10 QI's with kappa values in the excellent range and around 6 in the "poor" range.
Table 2: Prevalence and Inter-Rater Agreement and Reliability of Selected Facility Quality Indicators
Avg. QI prevalence rate Facility Ave
SD of QI prevalence rate
Ave Kappa for MDS Items used in QI definition
Percent Agreement Research & facility RNs on QI
QI Kappa
Behavior Problems & High ow Risk Combined
.20 .10 .71 89.8 .61
Little no activities .12 .12 .28 65.3 .23
Catheterised .07 .05 .71 92.5 .67
Incontinence .62 .13 .88 91.4 .78
Urinary Tract Infection .08 .05 .53 89.1 .45
Tube Feeding .08 .05 .80 98.1 .83
Low Body Mass Index .12 .05 .85 96.7 .87
Infection .17 .08 .50 79.6 .39
Inadequate Pain Management
.11 .08 .73 86.5 .50
Pressure Ulcers High & Low Risk Combined
.09 .05 .74 88.6 .54
Restraints .07 .07 .56 91.3 .53
Antipsychotic Use High & Low Risk Combined
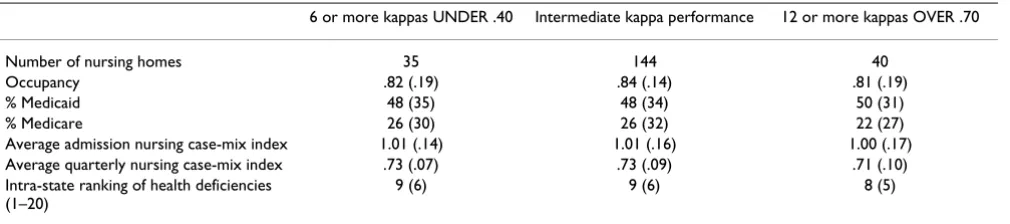
In light of the substantial inter-facility variation in QI reli-ability, we sought to identify facility characteristics that might be related to data reliability. There are 35 nursing homes with six or more low kappa values (less than .40) which we compared with the 40 nursing homes with twelve or more kappa values in excess of .70, using as the reference group the majority of nursing homes (n = 144) meeting neither threshold. As can be seen in Table 3, the "poor performers" did not significantly differ from the high performers or intermediate performers on facility occupancy rate or the percent of Medicaid or Medicare res-idents in the facility. In addition, there were no differences
in the average acuity of residents at admission or during quarterly assessments (based on the nursing case-mix index values used to create case mix classification).[31] Finally, there were no significant differences between the facilities in the number of health-related deficiencies cited during the most recent state survey process which we standardized per state.[32] Table 3 below depicts the differences.
Discussion
This study represents one of the largest inter-rater reliabil-ity trials ever conducted, involving over 200 nursing
[image:8.612.71.549.94.481.2]facil-Facility Kappa Values Comparing "Gold Standard" Raters withfacil-Facility Nurses: Incontinence Quality Indicator
Figure 1
Facility Kappa Values Comparing "Gold Standard" Raters withFacility Nurses: Incontinence Quality Indicator
The distribution of Kappa values averaged for all residents in each facility reflecting the inter-rater reliability of the "gold stand-ard" nurses and facility nurses on the Incontinence quality indicator. The "Y" axis indicates the number of facilities and the "X" axis the facility inter-rater reliability level calculated for the Incontinence QI.
1.00
.94
.88
.81
.75
.69
.63
.56
.50
.44
.38
.31
.25
.19
.13
.06
0.00
Number of Facilities
70
60
50
40
30
20
10
0
Std. Dev = .21
Mean = .78
ities and nearly 6000 pairs of nursing home residents. Relative to research nurses with proven high levels of inter-rater reliability who can be treated as the "gold standard", we found reasonably high average levels of inter-rater reliability on resident assessment information that is the basis for publicly reported measures of nursing home quality. We also found that almost all the compos-ite quality indicators measured in the average nursing facility in the six states studied, achieved adequate to good levels of inter-rater reliability. However, we did observe substantial facility variation in QI reliability. The majority of facilities participating in the study had reasonably good
reliability on most quality indicators, but a minority of facilities revealed unacceptably poor levels of reliability on many quality indicators. Unfortunately, traditional organizational or resident case-mix measures did not dif-ferentiate between facilities with high levels of QI reliabil-ity and those with low levels of QI reliabilreliabil-ity.
These findings are quite consistent with various prior studies of the reliability of the MDS as an assessment instrument for general use in the nursing home setting. [16–18] Earlier studies were based upon convenience samples of facilities located close to the investigators and
[image:9.612.69.554.99.479.2]Facility Kappa Values Comparing "Gold Standard" Raters with Facility Nurses: Inadequate Pain Management Quality Indicator
Figure 2
Facility Kappa Values Comparing "Gold Standard" Raters with Facility Nurses: Inadequate Pain Management Quality Indicator The distribution of Kappa values averaged for all residents in each facility reflecting the inter-rater reliabil-ity of the "gold standard" nurses and facilreliabil-ity nurses on the Pain Management qualreliabil-ity indicator. The "Y" axis indicates the number of facilities and the "X" axis the facility inter-rater reliability level calculated for the Pain Management QI.
1.00
.94
.88
.81
.75
.69
.63
.56
.50
.44
.38
.31
.25
.19
.13
.06
0.00
-.06
-.13
Number of Facilities
30
20
10
0
Std. Dev = .30
Mean = .50
so were not representative. The current study drew strati-fied random samples of facilities in each of six states. While around half of the facilities declined to participate, the resulting sample is still far more representative of the nation's nursing homes than any of the prior studies. The low participation rate is likely due to the substantial
demands participating in the overall study entailed for the facility since administrators and directors of nursing were interviewed and care planning meetings were observed and patients' charts were audited.
[image:10.612.64.550.95.543.2]Scatter plot of the number of HIGH QI Kappa Values and the number of LOW QI Kappa Values per Facility
Figure 3
Scatter plot of the number of HIGH QI Kappa Values and the number of LOW QI Kappa Values per Facility
This study may also serve to better understand the results of several other prior studies of the reliability of the MDS assessment process since we do observe considerable inter-facility variation and variation in which data ele-ments are likely to have reliability problems. The multi-facility studies done by Abt Associates and by the General Accounting Office found random (as opposed to direc-tionally biased) disagreement, particularly on the ordinal, multi-level items used to assess functional performance. It is likely that use of a weighted Kappa might have revealed results more comparable to those presented here. On the other hand, our finding of considerable inter-facility vari-ation in measurement may suggest that the selection of the facility for participation is influential in determining the results.
The reliability of the data used to construct quality indica-tors or measures of performance for health care providers has only recently emerged as an important methodologi-cal issue.[33,34,30,35] Kerr and her colleagues found reasonably good correspondence between computerized records in the Veteran's Administration's clinical data bases and more detailed medical charts which gave them greater confidence that the performance measures they were calculating really reflected facility quality in the area they were examining. Scinto and colleagues as well as Huff, found that while simple process quality indicators were highly reliable when abstracted from records, more complex measures requiring data elements related to eligibility for the treatment had significantly lower relia-bility levels using the Kappa statistic. Since the MDS rep-resents the end-point of a complex clinical assessment of residents' needs, characteristics and the processes of care provided, it is encouraging to find reasonably high levels of reliability when two independent assessors undertake the same process of documentation. However, the more complex and subjective (less subject to direct observation) the assessment, the lower the reliability levels.
While some of the QI's have only marginal reliability (Kappa between .40 & .50), there are numerous examples
of facilities which have high levels of inter-rater reliability even on the most "difficult" quality and functioning con-cepts. This suggests that it is possible to improve the qual-ity of assessment and data. There may be something about how the assessment process is organized and documented and whether the clinical assessment and care planning process are fully integrated that influences the level of data reliability. Unfortunately, we know little about the organ-izational and supervisory processes that are associated with implementing thorough clinical assessments. There is some evidence that the initial introduction of the MDS was associated with improvements in care processes and outcomes, but how universal this is at present is not known.[36,37] Unfortunately, preliminary analyses of the structural factors associated with QI reliability levels pro-vided little insight as to what kinds of facilities are more likely to have adequate reliability. Indeed, even facilities with poor government quality inspection records were no more or less likely to have excellent or poor QI reliability levels.
Since our measure of reliability, Kappa, adjusts for chance, particularly penalizing any disagreements in the assess-ment of "rare" conditions, we do observe the well-docu-mented relationship between reliability and prevalence. [29] While considerable statistical research has been devoted to making adjustments in the Kappa statistic for prevalence, the fact remains that disagreements about whether something rare is actually present are highly problematic. [38,28] Of interest in the case of QI reliabil-ity is that some qualreliabil-ity problems will, in realreliabil-ity, be less prevalent in high quality facilities. Theoretically, this could result in lower levels of reliability precisely because the observed conditions are less prevalent. This
funda-mental measurement problem viz. quality measurement
reliability and true quality deserves considerably more attention in the methodological and quality improve-ment literature.
To the extent that the quality indicators now in use to characterize the performance of nursing homes through-Table 3: Facility Differences in Level of Reliability Across Quality Indicators
6 or more kappas UNDER .40 Intermediate kappa performance 12 or more kappas OVER .70
Number of nursing homes 35 144 40
Occupancy .82 (.19) .84 (.14) .81 (.19)
% Medicaid 48 (35) 48 (34) 50 (31)
% Medicare 26 (30) 26 (32) 22 (27)
Average admission nursing case-mix index 1.01 (.14) 1.01 (.16) 1.00 (.17)
Average quarterly nursing case-mix index .73 (.07) .73 (.09) .71 (.10)
Intra-state ranking of health deficiencies (1–20)
[image:11.612.56.561.100.212.2]out the United States are relied upon by consumers and regulators, our findings suggest that the reliability of the indicators will vary by facility. While most facilities have adequate to excellent data reliability on the bulk of QI's, there are others with more mixed, or generally poorer reli-ability. Since, at the present time, the government has no mechanism for assessing data reliability on an ongoing basis, those using the publicly reported information will have no idea as to whether the observed QI rate reflects error or real facility performance. Efforts to automatically examine issues related to data quality or to incorporate that as part of the annual facility inspection process should be explored if we are to use nursing home QI's as they are intended.[39,40]
There are various limitations in the current study. First, while we were drawing a stratified random sample of facil-ities in each of six states, we experienced less than a 50% response rate. There is some indication that non-partici-pating facilities were smaller, proprietary and rural. It is likely that the performance of participating facilities might differ systematically from that of those that refused; however, it is not clear in which direction the difference might be. Indeed, among participants, these factors were unrelated to QI reliability levels. Obviously, asserting that our research nurses were actually the "gold standard" is subject to debate. While they adhered to the assessment protocol in which they were trained and which should mimic that which is done in all US nursing facilities, depending upon how assessments are routinely done in participating facilities, research nurses clearly did not have the benefit of more extended observation periods or per-sonal knowledge of patients' condition. Whether the research nurses represented the "truth" on all assessment items, it is clear that they were highly consistent among themselves, making them a reasonable yard stick against which existing assessments in each facility could be compared.
Conclusions
In summary, our study suggests that by and large, the MDS based nursing home quality indicators now being publicly reported are reliable. While there is variation in the level of reliability across the different indicators which probably should be noted in the public reports and some facilities clearly have less reliable data than do others, most of the indicators are replicable and most facilities are measuring them reliably. It is imperative that the organi-zational factors, leadership practices and assessment proc-esses that are associated with high and low levels of data reliability be carefully scrutinized. The fact that nearly half of all participating facilities had inadequate reliability lev-els on some of the publicly reported QI's, could serve to undermine public confidence in the quality of informa-tion about nursing home quality.
Competing interests
All authors were part of a team of researchers under con-tract from the Centers for Medicare & Medicaid to design and validate quality indicators based upon the Minimum Data Set assessment instrument. This manuscript reflects the opinions of the authors and not necessarily those of the contracting government agency.
Authors' contributions
Joseph Angelelli, Ph.D. was responsible for conducting the analysis of average facility inter-rater reliability, facility factors in reliability levels and he contributed to the edit-ing of the manuscript.
Richard Jones designed the sampling frame, oversaw field activity, monitored data quality, undertook the first line analyses of inter-rater reliability and contributed to edit-ing of the document.
Jason Roy, Ph.D. conducted the statistical analyses and comparisons, drafted parts of the methods section and edited the entire document.
Terry Moore, RN, MPH designed the field data collection effort, created the training protocols, participated in train-ing research staff nurses drafted the relevant sections of the methods and edited the entire document.
John Morris, Ph.D. served as the Principal Investigator, designed the overall validation study design, designed the inter-rater reliability study and revised and edited the manuscript.
Acknowledgements
Supported in part by CMS Contract #98-026 to Abt Associates with major sub-contracts to the Hebrew Rehabilitation Center for Aged and Brown University School of Medicine. Dr. Mor's effort was also supported by a grant from the NIA (AG $11624).
References
1. Epstein AM: Rolling down the runway: the challenges ahead for quality report cards.Jama 1998, 279:1691-1696.
2. Jencks SF: The government's role in hospital accountability for quality of care.Jt Comm J Qual Improv 1994, 20:364-369.
3. Fernandopulle R, Ferris T, Epstein A, McNeil B, Newhouse J, Pisano G and Blumenthal D: A research agenda for bridging the 'qual-ity chasm.'.Health Aff (Millwood) 2003, 22:178-190.
4. Jencks SF: Medicare analysis and use of outcome-based data. Ann Thorac Surg 1996, 62:S12-3; discussion S31-2.
5. Jencks SF, Huff ED and Cuerdon T: Change in the quality of care delivered to Medicare beneficiaries, 1998-1999 to 2000-2001. Jama 2003, 289:305-312.
6. Guadagnoli E, Epstein AM, Zaslavsky A, Shaul JA, Veroff D, Fowler F. J., Jr. and Cleary PD: Providing consumers with information about the quality of health plans: the Consumer Assessment of Health Plans demonstration in Washington State.Jt Comm J Qual Improv 2000, 26:410-420.
7. Schneider EC and Epstein AM: Influence of cardiac-surgery per-formance reports on referral practices and access to care. A survey of cardiovascular specialists. N Engl J Med 1996,
Publish with BioMed Central and every scientist can read your work free of charge "BioMed Central will be the most significant development for disseminating the results of biomedical researc h in our lifetime."
Sir Paul Nurse, Cancer Research UK
Your research papers will be:
available free of charge to the entire biomedical community
peer reviewed and published immediately upon acceptance
cited in PubMed and archived on PubMed Central
yours — you keep the copyright
Submit your manuscript here:
http://www.biomedcentral.com/info/publishing_adv.asp
BioMedcentral 8. Blumenthal D and Epstein AM: Quality of health care. Part 6: The
role of physicians in the future of quality management.N Engl J Med 1996, 335:1328-1331.
9. Berg K, Mor V, Morris J, Murphy KM, Moore T and Harris Y: Identi-fication and evaluation of existing nursing homes quality indicators.Health Care Financ Rev 2002, 23:19-36.
10. Mor V, Berg K, Angelelli J, Gifford D, Morris J and Moore T: The quality of quality measurement in U.S. nursing homes. Geron-tologist 2003, 43 Spec No 2:37-46.
11. Mor V, Angelelli J, Gifford D, Morris J and Moore T: Benchmarking and quality in residential and nursing homes: lessons from the US.Int J Geriatr Psychiatry 2003, 18:258-266.
12. Harrington C: Developing public information on nursing home quality.J Aging Soc Policy 1991, 3:127-146.
13. Zinn JS: Market competition and the quality of nursing home care.J Health Polit Policy Law 1994, 19:555-582.
14. Phillips CD, Morris JN, Hawes C, Fries BE, Mor V, Nennstiel M and Iannacchione V: Association of the Resident Assessment Instrument (RAI) with changes in function, cognition, and psychosocial status.J Am Geriatr Soc 1997, 45:986-993.
15. Morris JN, Hawes C, Fries BE, Phillips CD, Mor V, Katz S, Murphy K, Drugovich ML and Friedlob AS: Designing the national resident assessment instrument for nursing homes.Gerontologist 1990,
30:293-307.
16. Brandeis GH, Morris JN, Nash DJ and Lipsitz LA: The epidemiology and natural history of pressure ulcers in elderly nursing home residents.Jama 1990, 264:2905-2909.
17. Berlowitz DR, Brandeis GH, Morris JN, Ash AS, Anderson JJ, Kader B and Moskowitz MA: Deriving a risk-adjustment model for pressure ulcer development using the Minimum Data Set.J Am Geriatr Soc 2001, 49:866-871.
18. Hawes C, Morris JN, Phillips CD, Mor V, Fries BE and Nonemaker S:
Reliability estimates for the Minimum Data Set for nursing home resident assessment and care screening (MDS). Geron-tologist 1995, 35:172-178.
19. Morris JN, Nonemaker S, Murphy K, Hawes C, Fries BE, Mor V and Phillips C: A commitment to change: revision of HCFA's RAI. J Am Geriatr Soc 1997, 45:1011-1016.
20. Associates Abt: Development and Testing of a Minimum Data Set Accuracy Protocol-Final Report.Massachusetts, Abt Associ-ates, Inc; 2001.
21. General Office of the Inspector: Nursing Home Resident Assess-ment Quality of Care. 2001.
22. Zimmerman DR, Karon SL, Arling G, Clark BR, Collins T, Ross R and Sainfort F: Development and testing of nursing home quality indicators.Health Care Financ Rev 1995, 16:107-127.
23. Saliba D. Solomon D., Rubenstein LZ.: Nursing Home Quality of Care Indicators from the ACOVE Project: Steps of Care that Improve Outcomes for 24 Conditions in Nursing Homes.Sepulveda, CA, Center for the Study of Healthcare Provider Behavior, RAND Affiliate; 2002.
24. JACHO: Performance Measurement in Health Care. 2003 [http://www.jcaho.org/pms/index.htm]. Joint Commission on Accredita-tion of Health Care OrginaAccredita-tions
25. Kane R: Quality of life measures for nursing home residents. Journal of Gerontological A Biological Science Medical Science 2003,
58:240-248.
26. Blackman NJ and Koval JJ: Interval estimation for Cohen's kappa as a measure of agreement.Stat Med 2000, 19:723-741. 27. Cohen JA: Coefficient of agreement for nominal scales.
Educa-tional Psychological Measurement 1960, 20:37-46.
28. Lantz CA Nebenzahl E: Behavior and interpretation of the kappa statistic: resolution of the two paradoxes.Journal of Clin-ical Epidemiology 1996, 49:431-434.
29. Feinstein AR Cicchetti DV: High agreement but low kappa: The problems of two paradoxes.Journal of Clinical Epidemiology 1990,
43:543-549.
30. Huff ED: Comprehensive reliability assessment and compari-son of quality indicators and their components.Journal of Clini-cal Epidemiology 1997, 50:1395-1404.
31. Ahronheim JC, Mulvihill M, Sieger C, Park P and Fries BE: State prac-tice variations in the use of tube feeding for nursing home residents with severe cognitive impairment.J Am Geriatr Soc
2001, 49:148-152.
32. Angelelli J, Mor V, Intrator O, Feng Z and Zinn J: Oversight of nurs-ing homes: prunnurs-ing the tree or just spottnurs-ing bad apples? Ger-ontologist 2003, 43 Spec No 2:67-75.
33. Kerr EA, Smith DM, Hogan MM, Krein SL, Pogach L, Hofer TP and Hayward RA: Comparing clinical automated, medical record, and hybrid data sources for diabetes quality measures. Jt Comm J Qual Improv 2002, 28:555-565.
34. Zaslavsky AM: Statistical issues in reporting quality data: small samples and casemix variation. Int J Qual Health Care 2001,
13:481-488.
35. Scinto JD Galusha DH, Krumholz HM, Meehan TP: The case for comprehensive quality indicator reliability assessment. Jour-nal of Clinical Epidemiology 2001, 54:1103-1111.
36. Fries BE, Hawes C, Morris JN, Phillips CD, Mor V and Park PS: Effect of the National Resident Assessment Instrument on selected health conditions and problems. J Am Geriatr Soc 1997,
45:994-1001.
37. Berg K, Sherwood S, Murphy K, Carpenter GI, Gilgen R and Phillips CD: Rehabilitation in nursing homes: a cross-national com-parison of recipients.Age Ageing 1997, 26 Suppl 2:37-42. 38. Guggenmoos Holzmann I: The meaning of kappa: probabilistic
concepts of reliability and validity revisited.Journal of Clinical Epidemiology 1996, 49:775-782.
39. Angelelli J, Gifford D, Intrator O, Gozalo P, Laliberte L and Mor V:
Access to postacute nursing home care before and after the BBA. Balanced Budget Act. Health Aff (Millwood) 2002,
21:254-264.
40. Berg K Murphy KM, Mor V, Moore T, Morris JN, Harris Y.: Identifi-cation and evaluation of existing nursing homes quality indicators.Health Care Financ Rev 2002:19-36.
Pre-publication history
The pre-publication history for this paper can be accessed here: