This is a repository copy of Quantification of total fetal brain volume using 3D MR imaging
data acquired in utero..
White Rose Research Online URL for this paper:
http://eprints.whiterose.ac.uk/110261/
Version: Accepted Version
Article:
Jarvis, D. orcid.org/0000-0002-0133-1771, Akram, R., Mandefield, L.
orcid.org/0000-0002-4219-5673 et al. (3 more authors) (2016) Quantification of total fetal
brain volume using 3D MR imaging data acquired in utero. Prenatal Diagnosis, 36 (13). pp.
1225-1232. ISSN 0197-3851
https://doi.org/10.1002/pd.4961
This is the peer reviewed version of the following article: Jarvis, D. et al (2016)
Quantification of total fetal brain volume using 3D MR imaging data acquired in utero.
Prenat Diagn, 36: 1225–1232, which has been published in final form at
https://doi.org/10.1002/pd.4961. This article may be used for non-commercial purposes in
accordance with Wiley Terms and Conditions for Self-Archiving.
[email protected] https://eprints.whiterose.ac.uk/
Reuse
Unless indicated otherwise, fulltext items are protected by copyright with all rights reserved. The copyright exception in section 29 of the Copyright, Designs and Patents Act 1988 allows the making of a single copy solely for the purpose of non-commercial research or private study within the limits of fair dealing. The publisher or other rights-holder may allow further reproduction and re-use of this version - refer to the White Rose Research Online record for this item. Where records identify the publisher as the copyright holder, users can verify any specific terms of use on the publisher’s website.
Takedown
If you consider content in White Rose Research Online to be in breach of UK law, please notify us by
1
Quantification of total fetal brain volume using 3D MR imaging data
acquired
in utero.
Deborah Jarvis1, Rahim Akram1, Michael Paddock1, Laura Mandefield2, Paul Armitage1 and
Paul D Griffiths1
ABSTRACT
OBJECTIVE: Interpretation of MR imaging of the fetal brain in utero is primarily undertaken
using 2D images to provide anatomical information about structural abnormalities. It is now
possible to obtain 3D image acquisitions that allow measurement of fetal brain volumes that
are potentially useful clinically. The aim of our current work is to provide reference values of
total brain volumes obtained from a cohort of low risk fetuses with no abnormalities on
ante-natal ultrasonography and in utero MR imaging.
METHOD: Images from volume MR acquisitions of 132 fetuses were used to extract brain
volumes by manual segmentation. Reproducibility and reliability were assessed by analysis
of the results of two subgroups who had repeated measurements made by the primary and a
secondary observer.
RESULTS: Intra- and inter-observer agreement was high with no statistically significant
differences between and within observers (p= 0.476 and p= 0.427, respectively). The results
of the brain volume assessments are presented graphically with mean and 95% prediction
limits alongside estimates of normal growth rates.
CONCLUSION: We have shown that fetal brain volumes can be reliably extracted from iuMR
imaging 3D datasets with ahigh degree of reproducibility. The resultant data could
potentially be used as a reference tool in the clinical setting.
Measurement of fetal brain volume from iuMR imaging is a relatively new area of
investigation and has been derived from motion corrected ultrafast 2D imaging but
there is limited published data due to small sample sizes.
Fetal brain volumes can be derived from 3D iuMR acquisitions with a high degree of reproducibility using freehand segmentation.
Our work demonstrated a quadratic model provided best fit to describe the changes of fetal brain growth in relation to gestational age, increasing from a Mean value of
2 Introduction
A routine part of prenatal assessment of the fetus is to monitor fetal growth and this is
currently undertaken by ultrasonography (USS). Significant deviation from normal
development has the potential to influence clinical management and, as such, it is important
to establish reliable normal ranges. With regard to the central nervous system, indirect
indicators of fetal brain growth are used routinely by measurement of skull dimensions e.g.
biparietal diameter (BPD), occipito-frontal diameter and/or head circumference; although
there are many cases when abnormal skull size is matched by abnormal brain size the
correlation is not perfect. This is recognised in the neuropathology literature which uses the
term microcephaly to indicate a small head size and micrencephaly to indicate a
disproportionally small brain size in comparison to head size. While fetal biometry is an
important part of prenatal screening to assess brain development there may be a disparity
between those measurements and brain volume. Quantification of fetal brain volume using
USS is possible (1) but not routinely used in clinical practice .
MR methods of estimating brain volumes in the fetus have previously focused on post
processing ultrafast 2D MR acquisitions using bespoke software techniques. This has
enabled quantification of fetal brain volume by semi or fully automated methods. Data
regarding fetal supratentorial brain, cerebellum and midbrain structures have been published
(2-4) as have exploration of changes in volume in the presence of pathology such as
ventriculomegaly and posterior fossa abnormalities (5-7). The use of in utero Magnetic
Resonance (iuMR) imaging 3D datasets to estimate brain volumes is a relatively new area of
investigation.
Our work focuses on developing methods to acquire a volume dataset of the whole fetal
brain using a 3D MR acquisition to provide anatomical detail for clinical assessmentand for
post processing to generate quantitative data of the imaged anatomy within clinically
relevant timescales. Using these methods we aim to generate reference values of fetal brain
volumes derived from a cohort of normally developing fetuses across a wide gestational age
range.
Methods
Participants
Pregnant women whose fetuses had no abnormalities (brain or somatic) on USS and were
at no increased risk of brain abnormalities were recruited from two sources; either as part of
the extension to the MERIDIAN study (The Lancet (in press)) or through other research
3
approval of the relevant Ethics Board.The gestational age at which the iuMR study was
performed is quoted in relation to the estimate of fetal age made on second trimester USS.
The iuMR studies were reviewed by a consultant pediatric neuroradiologist (PDG) with over 15 years’ of experience reporting iuMR brain imaging in order to confirm normal
appearances.
Data Acquisition
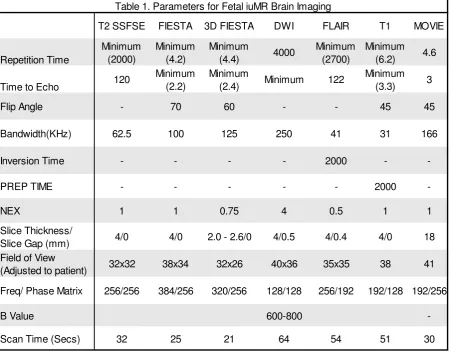
Our technique for acquiring and processing MR data of fetal brains in utero has been
reported in detail elsewhere (8)but is summarised here and in table 1. All MR studies were
performed on a 1.5T whole body scanner (HDx, GE Healthcare, Milwaukee) with an 8
channel cardiac coil positioned over the maternal abdomen either in the supine or lateral
position. Maternal sedation was not used and the iuMR studies of the fetal brain were limited
to 30 minutes table occupancy time. Our standard clinical 2D iuMR imaging protocol was
used to acquire images in all three orthogonal planes. 3D data sets were acquired in the
axial plane, relative to the fetal brain, using a balanced steady-state imaging sequence i.e.
Fast Imaging Employing Steady-state Imaging (FIESTA, GE Healthcare, Milwaukee). This
short (18-22seconds) imaging sequence allows acquisition of the entire fetal brain during
maternal suspended respiration.
Image processing and analysis
The 3D datasets were anonymised and transferred to a standard PC where they were
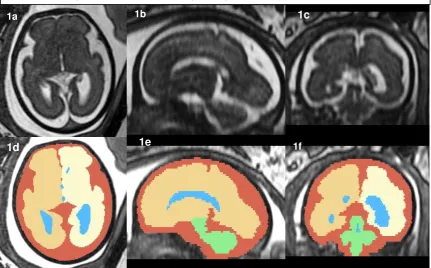
loaded into the public domain ‘3D Slicer’ software(www.slicer.org). Anatomical areas of the fetal brain were outlined freehand on the axial images due to the higher in-plane resolution,
although the coronal and sagittal planes were used for reference to improve accuracy (figure
1).The anatomical boundaries of five regions were delineated: cerebral ventricles, right and
left cerebral hemispheres, infratentorial brain (cerebellum and brain stem to the level of the
medulla/spinal cord junction) and the extra-axial CSF spaces with each area denoted by a
different colour label (figure 1). We chose to segment the fetal brain by this method to aid
future analysis of subdivisions but for the purpose of this work total brain volume (TBV) was
calculated by adding the volumes of both cerebral hemispheres and the infratentorial
structures (note these values do NOT include the volume of the enclosed cerebral
ventricles). The resultant annotated areas were used to create 3D models of the fetal brain
using the model-making algorithm within 3D Slicer, a requirementof the software in order for
volume data to be ascertained (figure 5). Volumes were calculated by multiplying the number
of voxels by the voxel size in each region of interest (ROI). The resultant volumes were used
4
The manual segmentation of all cases was performed by a research MR radiographer with 8 years’ experience of iuMR imaging (Observer 1, DJ) and a subgroup of 30 randomly
selected cases were re-analysed by the same researcher after a 2 month interval blinded to
the original measurements to investigate intra-observer reproducibility. A different group of
30 fetal brains were analysed by a second operator with one year of experience (observer 2,
RA) to study inter-observer reliability.
Statistical Analysis
All total brain volumes were rounded to one decimal place and statistical analysis on the
data performed using SPSS software version 20 (SPSS, Chicago, IL).
Intraclass correlation coefficient (ICC) was calculated to convey association within and
between observers for fetal brain volumes and independent t-tests were used to compare
differences.Bland-Altman plots were used to assess inter and intra observer agreement,
variability and bias. Disagreement between measurements was considered clinically
significant if differences in volume measurements both between and within raters were
>10%.
Regression Analysis of fetal brain volumes versus gestational age was performed and
regression fit chosen on the basis of highest adjusted R2 value selected by successive
analysis of polynomial fits (linear, quadratic and cubic). Analysis of the residuals was
performed to check model fit and best regression fit used to determine 95% confidence
intervals (CI) and prediction limits. 2 and 3 Standard deviations from the mean were
calculated at each time point based on the original raw data which are presented in
tabulated form.
Results
132 normal fetal brains were analysed between 18 and 36 weeks gestation.
The intra-rater analysis showed good repeatability of TBV measurements when observer 1
re-analysed a subgroup of 30 cases after a 2 month period (ICC=0.999, CI, 0.998-1.00,
p<0.001). The one sample t test revealed that the brain volume differences between
measurements were not statistically significant, t(29)=0.805, p=0.427, (95% CI -0.68 to
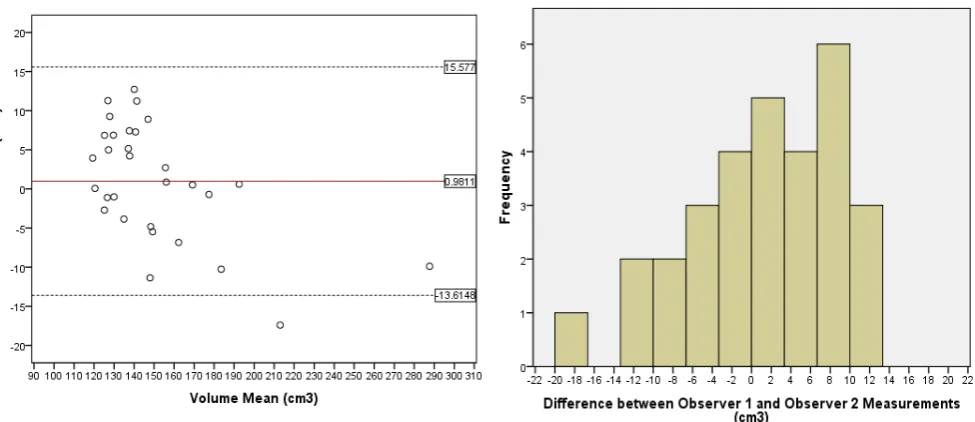
1.57). The Bland-Altman plot and the histogram of the differences between measurements
are shown in Figure 3a and 3b with one value outside the 95% CI but no bias between
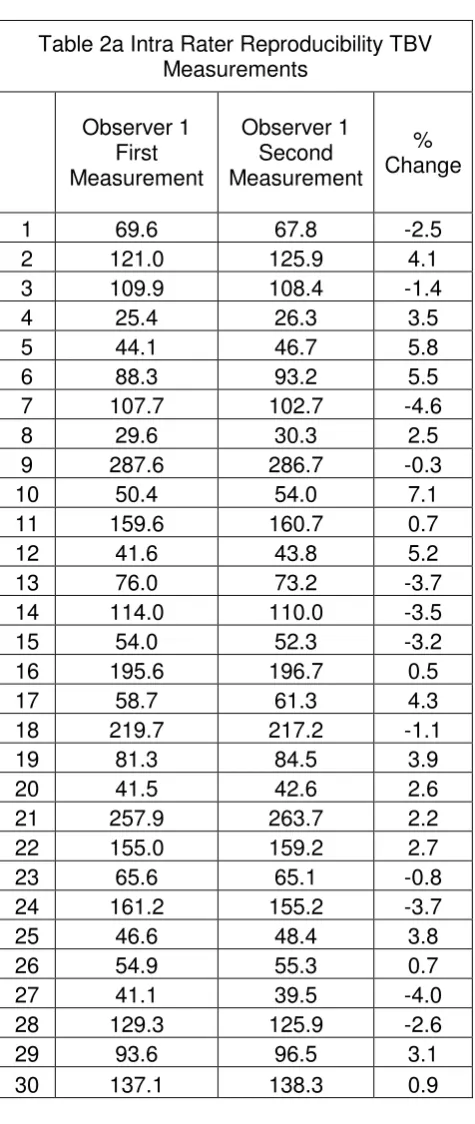
measurements observed (B= -0.001, p=0.877). Table 2 shows the raw data TBV of first and
second measurements and the percent difference between the two, which were between
5
Inter-rater analysis demonstrated good reliability with no statistically significant difference
found between measurements: t(29)=0.722, p=0.476 (95% CI, -1.799 to 3.761). The average
measure ICC was 0.977, p<0.001 (95% CI, 0.952 to 0.989). The corresponding
Bland-Altman plot for inter-rater agreement (Figure 4a) demonstrates the limits of agreement with
one value outside the 95% CI and a bias toward higher values by the more experienced
operator 1 (DJ) (B= -0.123, p= 0.001). The changes in measurement between observers as
a percentage difference range between 0.05 and 9.31% (Mean 1.27%, SD 4.8%) as shown
in Table 2a.
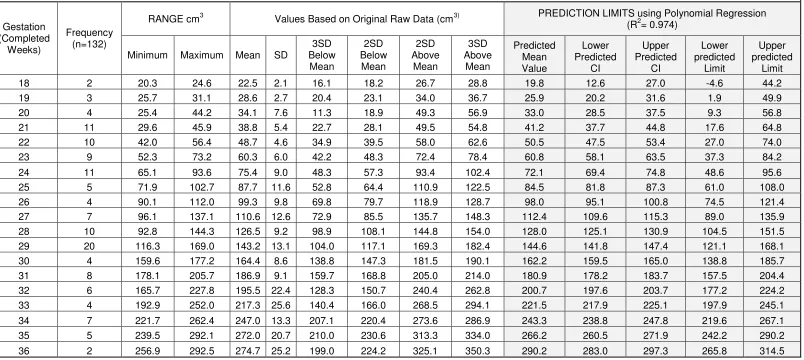
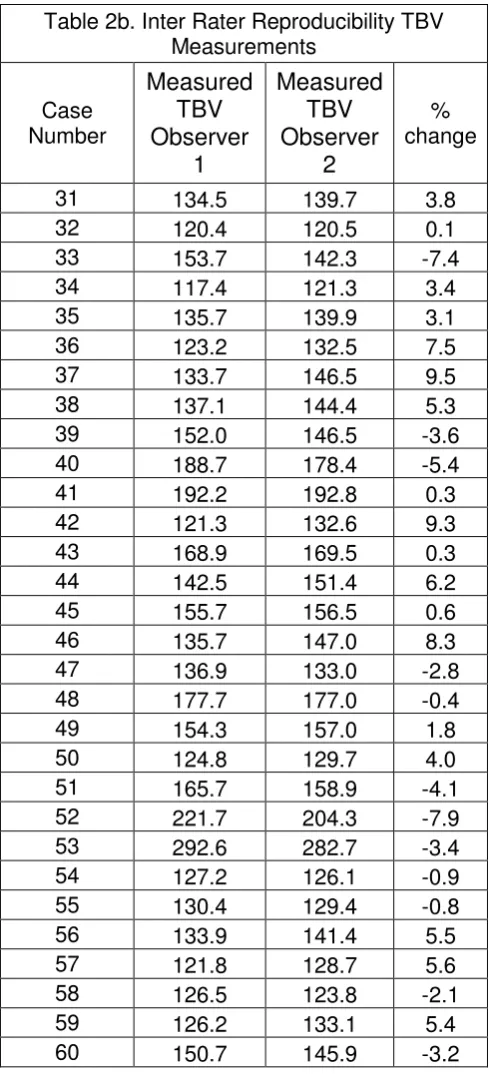
The TBV of the 132 fetuses are shown in Table 2b and presented graphically in Figure 2 which displays the lines for CI’s and prediction limits for each gestational age determined by the best regression fit. This was found to be a quadratic model with R2adj= 0.974 whose
prediction equation is y=0.53x -13.33x+ 289.69.TBV ranged from 20.2cm3 at 18 weeks to
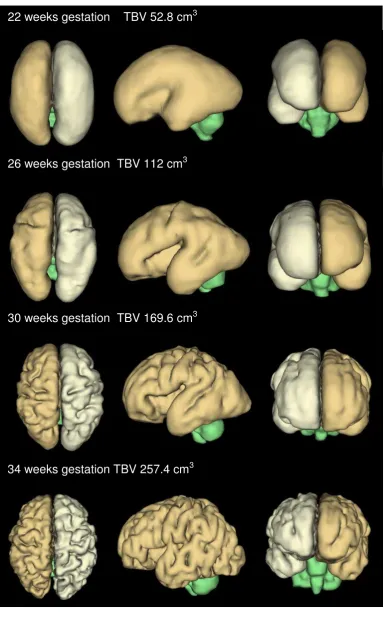
289.8cm3 at 36 weeks gestation. Surface reconstructions of fetal brains at different
gestations with the corresponding volume data are shown in figure 5.
Discussion.
We have shown that quantification of fetal TBV using 3D steady state sequences is possible
in second and third trimester fetuses. The time required for manual segmentation ranged
between 1 and 3 hours depending on the complexity of the surfaces (more mature fetuses
have more complex surfaces because of progressing sulcation/gyration). Despite this time
requirement, our method appears to be accessible, easily replicated and reproducible, even
when undertaken by a relatively inexperienced operator. We present the results of 132
normal fetal brains in this paper but recognise that we require more cases to consolidate the
data, particularly at the upper and lower ends of our range of gestational ages. Although the
predicted values are more realistic they were calculated with small numbers e.g. 2 data
points at 18 gestational weeks, and 3 at 19 gestational weeks which has resulted in lower
range negative predictive values so should be taken with caution. It is possible therefore, the
standard deviations calculated from the original TBV data may provide more reliable values
for these gestations.
It is not possible to judge how accurate our estimates of TBV are, as we do not know the real
volumes (or weights) of the brains assessed. This is a common problem for radiological
6
is to compare our volume measurements with brain weights measured post-mortem in cases
where the pregnancy is terminated (utilising the well-defined density estimates of the fetal
brain) (9)although the delay between iuMR study and the termination of pregnancy is a likely
confounding factor. Alternatively, it may be possible to use our iuMR methods to estimate
the volume of brain models of known volume that have similar complexity and size to fetal
brains at different stages of gestation and this work is currently underway at our Institution.
In the absence of accuracy data we have to assess the reliability and reproducibility of our
methods, specifically comparing the results of different observers and the results of the
same observer at different times. This is important in order to ensure any deviation from
values observed in the normal population can be assigned to abnormal development rather
than inconsistencies in the methods used to extract the data. Our analysis by ICC and
Bland-Altman plot have shown that the discrepancies both within the same rater and
between raters were not statistically significant and are encouraging that there are not likely
to be any major systematic methodological flaws. Inter-observer agreement was not as
closely matched when compared with intra-observer assessments as shown by the wider
limits of agreement and the bias toward higher volumes by the more experienced observer,
but these differences are still small and not likely to cause clinically relevant errors.
The discrepancies could be due in part to earlier inexperienced measurements by the less
experienced observer or due to variation in the practical aspects of annotation such as
windowing the images.
One possible solution to the time taken for manual segmentation is to automate the process
and several previous studies have described such methods to define anatomical areas of the
fetal brain from 2D iuMR imaging data. Most have focused on different anatomical
sub-divisions of the brain making it difficult to correlate our TBV findings with the published work,
indeed most previous studies report volume data from the supratentorial brain only (10-12).
Other studies have reported brainstem and cerebellar volumes but without the
accompanying or paired supratentorial data (2, 6, 13). We chose to quantify the fetal TBV as
defining the borders of the whole brain which can be easily identified due to the contrast
between the brain paranchyma and CSF, whereas smaller areas within the brain are less
7
Egana-Ugrinovic, Sanz-Cortes (14) did calculate TBV (i.e. supra and infratentorial
compartments) for 50 fetuses at 37GW and reported mean values of 312.07 cm3 (SD
40.85cm3) that included intraventricular CSF spaces, unlike our data which measured brain
parenchymal volume only. We cannot compare our data with that of Egana-Ugrinovic et al.
directly because we do not have any data for 37GW fetuses (only to 36 weeks), although
extrapolation of our curves does suggest a close match.
Even with the difference in anatomical areas measured previous studies report a growth rate
of 15% per week (2, 7). Our work demonstrated a quadratic model provided best fit to
describe the changes of fetal brain growth in relation to gestational age.
Conclusion
This study demonstrates a simple method to post process 3D iuMR data to determine
quantitative measurements of the fetal brain with a high degree of reproducibility. The
resultant graph of normal brain volumes across a broad range of gestations with associated
prediction limits could potentially be used as a reference tool in the clinical setting. The
normative data generated will allow comparisons to be made for the brain volumes of
fetuses in whom there is suspected abnormal development. This additional information
allows the possibility of building on the findings determined by routine imaging and biometry,
8 REFERENCES
1. Endres LK, Cohen L. Reliability and validity of three-dimensional fetal brain volumes. Journal of ultrasound in medicine. 2001;20(12):1265-9.
2. Scott JA, Habas PA, Kim K, Rajagopalan V, , et al. Growth trajectories of the human fetal brain tissues estimated from 3D reconstructed in utero MRI. International journal of developmental neuroscience : the official journal of the International Society for Developmental Neuroscience. 2011;29(5):529-36.
3. Habas PA, Kim K, Rousseau F, Glenn OA, et al A spatio-temporal atlas of the human fetal brain with application to tissue segmentation. Medical image computing and computer-assisted intervention : MICCAI International Conference on Medical Image Computing and Computer-Assisted Intervention. 2009;12(Pt 1):289-96.
4. Grossman R, Hoffman C, Mardor Y, Biegon A. Quantitative MRI measurements of human fetal brain development in utero. NeuroImage. 2006;33(2):463-70.
5. Scott JA, Habas PA, Rajagopalan V, Kim K, et al. Volumetric and surface-based 3D MRI analyses of fetal isolated mild ventriculomegaly : Brain morphometry in ventriculomegaly. Brain structure & function. 2013;218(3):645-55.
6. Scott JA, Hamzelou KS, Rajagopalan V, Habas PA, et al. 3D morphometric analysis of human fetal cerebellar development. Cerebellum (London, England). 2012;11(3):761-70.
7. Kazan-Tannus JF, Dialani V, Kataoka ML, Chiang G, et al. MR volumetry of brain and CSF in fetuses referred for ventriculomegaly. AJR American journal of roentgenology. 2007;189(1):145-51. 8. Jarvis DA, Armitage P, Dean A, Griffiths PD. Surface reconstructions of foetal brain
abnormalities using ultrafast steady state 3D acquisitions. Clinical Radiology. 2014;69(10):1084-91. 9. Breeze AC, Gallagher FA, Lomas DJ, Smith GC, et al. Postmortem fetal organ volumetry using magnetic resonance imaging and comparison to organ weights at conventional autopsy. Ultrasound in obstetrics & gynecology : the official journal of the International Society of Ultrasound in
Obstetrics and Gynecology. 2008;31(2):187-93.
10. Rajagopalan V, Scott J, Habas PA, Kim K, et al. Local tissue growth patterns underlying normal fetal human brain gyrification quantified in utero. The Journal of neuroscience : the official journal of the Society for Neuroscience. 2011;31(8):2878-87.
11. Clouchoux C, Kudelski D, Gholipour A, Warfield SK, Viseur S, Bouyssi-Kobar M, et al. Quantitative in vivo MRI measurement of cortical development in the fetus. Brain structure & function. 2012;217(1):127-39.
12. Damodaram MS, Story L, Eixarch E, Patkee P, et al. Foetal volumetry using magnetic resonance imaging in intrauterine growth restriction. Early human development. 2012;88 Suppl 1:S35-40.
13. Vatansever D, Kyriakopoulou V, Allsop JM, Fox M, et al. Multidimensional analysis of fetal posterior fossa in health and disease. Cerebellum (London, England). 2013;12(5):632-44.
9
1d 1f
1c
1b 1a
[image:10.595.73.505.90.358.2]1e
10
T2 SSFSE FIESTA 3D FIESTA DWI FLAIR T1 MOVIE
Repetition Time
Minimum (2000)
Minimum (4.2)
Minimum
(4.4) 4000
Minimum (2700)
Minimum (6.2) 4.6
Time to Echo 120
Minimum (2.2)
Minimum
(2.4) Minimum 122
Minimum (3.3) 3
Flip Angle - 70 60 - - 45 45
Bandwidth(KHz) 62.5 100 125 250 41 31 166
Inversion Time - - - - 2000 -
-PREP TIME - - - 2000
-NEX 1 1 0.75 4 0.5 1 1
Slice Thickness/
Slice Gap (mm) 4/0 4/0 2.0 - 2.6/0 4/0.5 4/0.4 4/0 18
Field of View
(Adjusted to patient) 32x32 38x34 32x26 40x36 35x35 38 41
Freq/ Phase Matrix 256/256 384/256 320/256 128/128 256/192 192/128 192/256
B Value 600-800
[image:11.595.74.525.73.424.2]-Scan Time (Secs) 32 25 21 64 54 51 30
12
Table 3. Total Brain Volumes
Gestation (Completed
Weeks)
Frequency (n=132)
RANGE cm3 Values Based on Original Raw Data (cm3) PREDICTION LIMITS using Polynomial Regression (R2= 0.974)
Minimum Maximum Mean SD
3SD Below Mean 2SD Below Mean 2SD Above Mean 3SD Above Mean Predicted Mean Value Lower Predicted CI Upper Predicted CI Lower predicted Limit Upper predicted Limit
18 2 20.3 24.6 22.5 2.1 16.1 18.2 26.7 28.8 19.8 12.6 27.0 -4.6 44.2
19 3 25.7 31.1 28.6 2.7 20.4 23.1 34.0 36.7 25.9 20.2 31.6 1.9 49.9
20 4 25.4 44.2 34.1 7.6 11.3 18.9 49.3 56.9 33.0 28.5 37.5 9.3 56.8
21 11 29.6 45.9 38.8 5.4 22.7 28.1 49.5 54.8 41.2 37.7 44.8 17.6 64.8
22 10 42.0 56.4 48.7 4.6 34.9 39.5 58.0 62.6 50.5 47.5 53.4 27.0 74.0
23 9 52.3 73.2 60.3 6.0 42.2 48.3 72.4 78.4 60.8 58.1 63.5 37.3 84.2
24 11 65.1 93.6 75.4 9.0 48.3 57.3 93.4 102.4 72.1 69.4 74.8 48.6 95.6
25 5 71.9 102.7 87.7 11.6 52.8 64.4 110.9 122.5 84.5 81.8 87.3 61.0 108.0
26 4 90.1 112.0 99.3 9.8 69.8 79.7 118.9 128.7 98.0 95.1 100.8 74.5 121.4
27 7 96.1 137.1 110.6 12.6 72.9 85.5 135.7 148.3 112.4 109.6 115.3 89.0 135.9
28 10 92.8 144.3 126.5 9.2 98.9 108.1 144.8 154.0 128.0 125.1 130.9 104.5 151.5
29 20 116.3 169.0 143.2 13.1 104.0 117.1 169.3 182.4 144.6 141.8 147.4 121.1 168.1
30 4 159.6 177.2 164.4 8.6 138.8 147.3 181.5 190.1 162.2 159.5 165.0 138.8 185.7
31 8 178.1 205.7 186.9 9.1 159.7 168.8 205.0 214.0 180.9 178.2 183.7 157.5 204.4
32 6 165.7 227.8 195.5 22.4 128.3 150.7 240.4 262.8 200.7 197.6 203.7 177.2 224.2
33 4 192.9 252.0 217.3 25.6 140.4 166.0 268.5 294.1 221.5 217.9 225.1 197.9 245.1
34 7 221.7 262.4 247.0 13.3 207.1 220.4 273.6 286.9 243.3 238.8 247.8 219.6 267.1
35 5 239.5 292.1 272.0 20.7 210.0 230.6 313.3 334.0 266.2 260.5 271.9 242.2 290.2
13
Figure 3. Bland Altman plot (left) of the differences between the two measurements
made by the experienced operator (observer 1, DJ) Solid black line=mean. Dashed
lines=95% limits of agreement. Right -Histogram of the frequencies of difference
between intra-rater measurements.
Figure 4. Bland-Altman plot of differences between operator 1 (DJ, experienced) and
2 (RA, newly trained). Solid black line=mean. Dashed lines=95% limits of agreement.
[image:14.595.68.556.459.670.2]14
Table 2a Intra Rater Reproducibility TBV Measurements
Observer 1 First Measurement
Observer 1 Second Measurement
% Change
1 69.6 67.8 -2.5
2 121.0 125.9 4.1
3 109.9 108.4 -1.4
4 25.4 26.3 3.5
5 44.1 46.7 5.8
6 88.3 93.2 5.5
7 107.7 102.7 -4.6
8 29.6 30.3 2.5
9 287.6 286.7 -0.3
10 50.4 54.0 7.1
11 159.6 160.7 0.7
12 41.6 43.8 5.2
13 76.0 73.2 -3.7
14 114.0 110.0 -3.5
15 54.0 52.3 -3.2
16 195.6 196.7 0.5
17 58.7 61.3 4.3
18 219.7 217.2 -1.1
19 81.3 84.5 3.9
20 41.5 42.6 2.6
21 257.9 263.7 2.2
22 155.0 159.2 2.7
23 65.6 65.1 -0.8
24 161.2 155.2 -3.7
25 46.6 48.4 3.8
26 54.9 55.3 0.7
27 41.1 39.5 -4.0
28 129.3 125.9 -2.6
29 93.6 96.5 3.1
15
Table 2b. Inter Rater Reproducibility TBV Measurements Case Number
Measured
TBV
Observer
1
Measured
TBV
Observer
2
% change31 134.5 139.7 3.8
32 120.4 120.5 0.1
33 153.7 142.3 -7.4
34 117.4 121.3 3.4
35 135.7 139.9 3.1
36 123.2 132.5 7.5
37 133.7 146.5 9.5
38 137.1 144.4 5.3
39 152.0 146.5 -3.6
40 188.7 178.4 -5.4
41 192.2 192.8 0.3
42 121.3 132.6 9.3
43 168.9 169.5 0.3
44 142.5 151.4 6.2
45 155.7 156.5 0.6
46 135.7 147.0 8.3
47 136.9 133.0 -2.8
48 177.7 177.0 -0.4
49 154.3 157.0 1.8
50 124.8 129.7 4.0
51 165.7 158.9 -4.1
52 221.7 204.3 -7.9
53 292.6 282.7 -3.4
54 127.2 126.1 -0.9
55 130.4 129.4 -0.8
56 133.9 141.4 5.5
57 121.8 128.7 5.6
58 126.5 123.8 -2.1
59 126.2 133.1 5.4
16
Figure 5. 3D reconstructions of fetal brains with corresponding volume measurements at four different gestations.