sand under one-dimensional compression
.
White Rose Research Online URL for this paper:
http://eprints.whiterose.ac.uk/103161/
Version: Accepted Version
Article:
Barr, A. orcid.org/0000-0002-8240-6412, Clarke, S.D., Petkovski, M. et al. (4 more
authors) (2016) Effects of strain rate and moisture content on the behaviour of sand under
one-dimensional compression. Experimental Mechanics, 56 (9). pp. 1625-1639. ISSN
1741-2765
https://doi.org/10.1007/s11340-016-0200-z
[email protected] https://eprints.whiterose.ac.uk/ Reuse
Unless indicated otherwise, fulltext items are protected by copyright with all rights reserved. The copyright exception in section 29 of the Copyright, Designs and Patents Act 1988 allows the making of a single copy solely for the purpose of non-commercial research or private study within the limits of fair dealing. The publisher or other rights-holder may allow further reproduction and re-use of this version - refer to the White Rose Research Online record for this item. Where records identify the publisher as the copyright holder, users can verify any specific terms of use on the publisher’s website.
Takedown
If you consider content in White Rose Research Online to be in breach of UK law, please notify us by
(will be inserted by the editor)
Effects of strain rate and moisture content on the behaviour of sand under
one-dimensional compression
A. D. Barr · S. D. Clarke · M. Petkovski · A. Tyas ·
S. E. Rigby · J. Warren · S. Kerr
Received: date / Accepted: date
Abstract The influence of strain rate and moisture content on the behaviour of a quartz sand was assessed
using high-pressure quasi-static (10−3s−1) and high-strain-rate (103s−1) experiments under uniaxial strain.
Quasi-static compression to axial stresses of 800 MPa was carried out alongside split Hopkinson pressure bar
(SHPB) experiments to 400 MPa, where in each case lateral deformation of the specimen was prevented using
a steel test box or ring, and lateral stresses were recorded. A significant increase in constrained modulus was
observed between strain rates of 10−3s−1and 103s−1, however a consistently lower Poisson’s ratio in the
dy-namic tests minimised changes in bulk modulus. The reduction in Poisson’s ratio suggests that the stiffening
of the sand in the SHPB tests is due to additional inertial confinement rather than an inherent strain-rate
de-pendence. In the quasi-static tests the specimens behaved less stiffly with increasing moisture content, while
in the dynamic tests the addition of water had little effect on the overall stiffness, causing the quasi-static and
dynamic series to diverge with increasing moisture content.
Keywords SHPB·quasi-static·one-dimensional compression·sand·strain rate·moisture content
A. D. Barr·S. D. Clarke·M. Petkovski·A. Tyas· S. E. Rigby·J. Warren
Department of Civil and Structural Engineering, The University of Sheffield, Sheffield, S1 3JD, UK. E-mail: [email protected]
S. Kerr
1 Introduction
This research forms part of the Dstl-sponsored and QinetiQ-led Force Protection Engineering (FPE) research
programme, which investigates protective materials and structures that can be used by military fortifications
designers [1]. The FPE programme is split into applied and underpinning research, where the goal of the
underpinning research is to enhance the understanding of how protective materials used in FPE perform under
a wide range of loading conditions.
Predicting the response of soils during blast and impact events requires an understanding of how they
behave over a wide range of strain rates and ground conditions. As sand is an extremely variable granular
material, the validation of a numerical model requires a comprehensive set of experimental data which takes
into consideration factors such as the particle grading, shape and mineralogy, initial porosity, and saturation. In
the present work the effects of strain rate and moisture content on soil response are examined for a quartz sand.
The split Hopkinson pressure bar (SHPB) is commonly used to investigate the response of soils to
one-dimensional compression at strain rates of 102s−1to 104s−1[2–12]. In order to understand the specific
strain-rate effects which occur in dynamic tests such as the SHPB, quasi-static tests on the same soil can be carried
out to enable a comparison, though such complementary experiments have typically only been performed to
axial stresses of around 70 MPa and strains of 20% [13]. The current work presents data for quasi-static
one-dimensional compression with peak axial stresses of up to 800 MPa and strains of over 35%. This allows direct
comparison with the accompanying SHPB results well into the ‘lock up’ phase of the sand response, where the
stiffness increases rapidly as particle breakage and rearrangement fills the void spaces.
1.1 Strain-rate effects
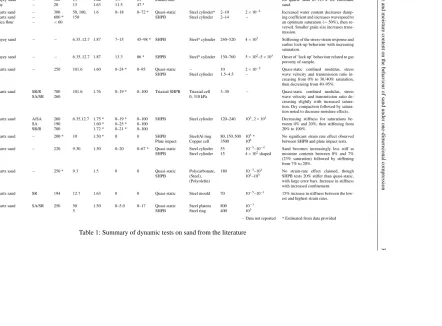
While SHPB tests on sand are increasingly reported in the literature, much of the work is focused on
inves-tigating the effects of moisture content [5, 6, 8–12], confinement [8, 10, 15] and initial density [15, 16], and
relatively little complete information is available specifically concerning strain-rate effects. A summary of
of strain rate and moisture content on the beha viour of sand under one-dimensional compression 3 Specimen Experiment Reference Material tested Particle angularity D50 (µm)
ls,nom
(mm) ρd
(Mg m−3) w (%) Sr (%) Test apparatus Lateral confinement Peak stress (MPa)
Peak strain rate (s−1)
Conclusions
Farr [13] Quartz sand Carbonate sand Clayey sand Clay SA* SR/R* − − 350 500 300 20 13 13,23 13 13 1.62 1.62 1.84 1.63 5.5 5.0 3.5 11.5 23 * 19 * 21 * 47 * Hydraulically/ explosively-loaded ram
Steel cylinder 50–70 10−4–103 Increase in stiffness from lowest to high-est strain rate for all materials, from 45% for quartz sand to 125% for carbonate sand.
Ross et al. [10] Quartz sand Quartz sand Silica flour − − − 300 600 * <60 50, 100, 150
1.6 0–18 0–72 * Quasi-static SHPB
Steel cylinder* Steel cylinder
2–10 2–14
2×10⁻⁴
−
Increased water content decreases damp-ing coefficient and increases wavespeed to an optimum saturation (∼50%), then re-versed. Smaller grain size increases trans-mission.
Felice et al. [6] Clayey sand − − 6.35,12.7 1.87 7–15 45–98 * SHPB Steel* cylinder 240–520 4×10³ Stiffening of the stress-strain response and earlier lock-up behaviour with increasing saturation.
Felice et al. [7] Clayey sand − − 6.35,12.7 1.87 13.3 86 * SHPB Steel* cylinder 130–760 5×10²–5×10³ Onset of ‘lock up’ behaviour related to gas porosity of sample.
Charlie et al. [5] Quartz sand − 250 101.6 1.60 0–24 * 0–95 Quasi-static
SHPB
−
Steel cylinder 10 1.5–4.5
2×10⁻²
−
Quasi-static confined modulus, stress wave velocity and transmission ratio in-creasing from 0% to 30/40% saturation, then decreasing from 40–95%.
Pierce and Charlie [9]
Quartz sand SR/R SA/SR
700 260
101.6 1.76 0–19 * 0–100 Triaxial SHPB Triaxial cell 0, 310 kPa
3–30 − Quasi-static confined modulus, stress
wave velocity and transmission ratio de-creasing slightly with increased tion. Dry compaction followed by satura-tion noted to decrease moisture effects.
Veyera [11, 12] Quartz sand A/SA SA SR/R
260 190 700
6.35,12.7 1.75 * 1.60 * 1.72 * 0–19 * 0–25 * 0–21 * 0–100 0–100 0–100
SHPB Steel cylinder 120–240 103, 2×10³ Decreasing stiffness for saturations be-tween 0% and 20%, then stiffening from 20% to 100%.
Bragov et al. [2] Quartz sand − 200 * 10 1.50 * 0 0 SHPB
Plate impact
Steel/Al ring Copper cell
80,150,500 3500
103* 106
No significant strain rate effect observed between SHPB and plate impact tests.
Martin et al. [8] Kabir et al. [4]
Quartz sand − 220 9.30 1.50 0–20 0–67 * Quasi-static
SHPB
Steel cylinder Steel cylinder
55 15
10−5–10−4 4×10²shaped
Sand becomes increasingly less stiff at moisture contents between 0% and 7% (23% saturation) followed by stiffening from 7% to 20%.
Song et al. [3] Kabir et al. [4]
Quartz sand − 250 * 9.3 1.5 0 0 Quasi-static
SHPB
Polycarbonate, (Steel), (Polyolefin)
180 10−3–101 102–103
No strain-rate effect claimed, though SHPB tests 20% stiffer than quasi-static, with large error bars. Increase in stiffness with increased confinement.
Baamer et al. [14] Quartz sand SR 194 12.7 1.63 0 0 Quasi-static Steel mould 70 10−5–10−1 15% increase in stiffness between the low-est and highlow-est strain rates.
Current work Quartz sand SA/SR 250 50
5
1.50 0–5.0 0–17 Quasi-static SHPB
Steel platens Steel ring
800 400
10−3 103
[image:4.595.153.737.95.445.2]Bragov et al. [2] tested dry, fine quartz sand using SHPB and plate impact experiments to determine the
dynamic response for strain rates of 103s−1and 106s−1, and found no significant strain rate effect over that
range. The relationship between the axial and lateral stresses measured in the SHPB tests were used to infer
the lateral stresses in the plate impact tests. These tests characterised the sand response under dynamic
one-dimensional compression at axial stresses up to 3 GPa and strains over 45%.
Song et al. [3] investigated the effects of strain rate and confinement on the response of a dry, fine quartz
sand. Tests using a SHPB and a quasi-static test device were used to characterise the sand response at a variety
of strain rates between 8.5×10⁻⁴s−1 and 1.45×10³s−1using a polycarbonate tube to confine the sample.
The mean results suggest that at the highest strain rate the sand was around 20% stiffer than during the slowest
quasi-static tests, though the authors reported no strain-rate effect due to the large amount of scatter in the
results. The SHPB tests using a polycarbonate tube were also compared with specimens confined in steel and
polyolefin shrink wrap tubes, with the steel-confined samples displaying a 20% increase in stiffness and the
polyolefin-confined samples having a drastically reduced stiffness.
The behaviour of dry sand at various quasi-static and intermediate strain rates has also been investigated by
Baamer et al. [14], where a hydraulic loading frame was used to compress specimens in a steel mould at strain
rates between 10−5s−1and 10−1s−1. The authors observed a 15% increase in stiffness between the lowest and
highest strain rates.
An earlier study by Farr [13] used uniaxial strain devices involving a hydraulically or explosively-driven
ram to test the effect of strain rate on four partially saturated soils in the range 10−4s−1to 103s−1. The soils
tested were a medium carbonate beach sand, a fine/medium quartz sand, a well-graded clayey sand, and loess.
He found that all of the soils became stiffer when tested at higher rates, with increases in constrained modulus
ranging from 45% for the quartz sand to 125% for the carbonate sand, and noted that for most of the soils tested
much of this increase had occurred at a strain rate of 10 s−1, with a more limited effect from a further increase
1.2 Moisture-content effects
Split Hopkinson Pressure Bars have been used by a number of authors to investigate the effects of moisture
content on the response of sand in dynamic tests, some focusing on the effect on wave speed and stress
trans-mission [5, 9, 10], others on the effect on the material’s stress-strain response.
Felice et al. [6] varied the moisture content of a clayey sand, performing SHPB tests at 7%, 13% and 15%
moisture content after first compacting the soil to an initial density of 1.87 Mg m−3(equating to saturations of
approximately 45%, 86% and 97%). It was found that the specimen response stiffened as the moisture content
increased.
Veyera et al. [11, 12] tested three sands in dry and saturated conditions, as well as several intermediate
moisture contents. The sands varied in grading and angularity, though at a strain rate of 103s−1the results for
all three sands indicated a reduction in stiffness in 20% saturated samples compared to the dry sand, followed
by a stiffening response for saturations of 40−100%, with the onset of lock-up behaviour varying between
sands. Tests were also carried out at a strain rate of 2×10³s−1, but while the higher strain rate results appear
to be generally stiffer, the authors noted that the data was not sufficient to make a detailed comparison.
Martin et al. [8] tested a fine silica sand by varying the moisture content at increments between 0% and 20%,
and found that the specimen became less stiff as the moisture content was increased from 0−7% (where 7%
moisture content equates to 25% saturation), and then stiffened as the moisture content continued to increase
from 7−20%. At 20% moisture content the response was still less stiff than for the dry sand. These tests were
conducted at relatively low axial stresses (15 MPa), so no lock-up behaviour was observed and the response
was largely linear.
1.3 Summary of existing literature
Investigations on the effect of moisture content on sand response identify similar trends in each case, with the
sand becoming less stiff up to 20−25% initial saturation followed by stiffening at higher saturations. Tests
10-3 10-2 10-1 100 101 0
2 4 6 8 10 12
Particle diameter, mm
% V
ol
um
e
Silt
Clay Sand Gravel
Fig. 1: Mean particle size distribution for the sand tested.
BS EN ISO 14688-1:2002 soil description: Pinkish light brown fine and medium SAND
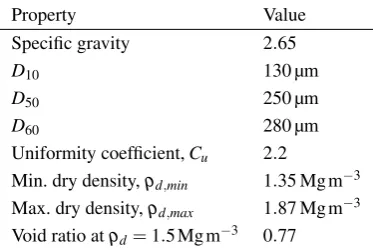
Property Value
Specific gravity 2.65
D10 130 µm
D50 250 µm
D60 280 µm
Uniformity coefficient,Cu 2.2
Min. dry density,ρd,min 1.35 Mg m−3
Max. dry density,ρd,max 1.87 Mg m−3
[image:7.595.222.409.315.440.2]Void ratio atρd=1.5 Mg m−3 0.77
Table 2: Properties of sand tested, to BS 1377–2:1990 and BS 1377–4:1990.
between quasi-static and high strain rates. Tests on dry sand, while more mixed in their conclusions, appear to
show little or no strain-rate dependence between quasi-static and high strain rates. Each of the existing studies
on the effect of strain-rate were performed on either dry or partially-saturated specimens of a variety of soils,
and so the current work set out to confirm whether a strain-rate dependence exists in a dry quartz sand between
quasi-static and high strain rates and, if so, how it is affected by changes in moisture content.
2 Material properties
The material tested was a fine and medium sand, consisting of sub-rounded to sub-angular particles. The
Strain rate (s−1)
Peak axial stress (MPa)
Moisture content (%)
Number of tests
Quasi-static
10−3 800
0.0 3
2.5 3
5.0 3
Dynamic
103 400
0.0 6
2.5 5
[image:8.595.161.396.97.214.2]5.0 5
Table 3: Test programme: strain rates, specimen moisture content and number of repeats.
dispersion unit, the results of which are presented in Figure 1. The uniformity coefficientCuhad a value of
2.2, indicating a uniform distribution, whereCu=D60/D10and the valuesD10andD60are the 10thand 60th
percentile particle sizes. A summary of material properties is provided in Table 2.
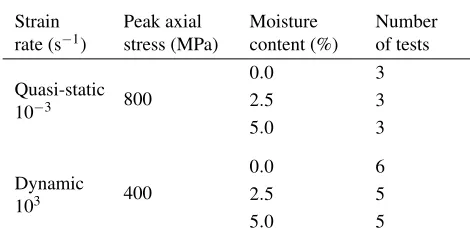
3 Test programme
The test programme comprised of 9 quasi-static and 16 dynamic one-dimensional compression tests, carried
out using the mac2Ttest rig and SHPB test apparatus. Specimens were tested at moisture contents of 0.0%,
2.5% and 5.0% in both the quasi-static and dynamic tests, where the moisture content,w, is the ratio of the
mass of water to the mass of dry sand. A summary of the test variables is shown in Table 3.
4 Quasi-static experiments
The quasi-static tests were carried out in mac2T, the University of Sheffield’s test rig for Multi-Axial
Com-pression of Concrete at Elevated Temperatures [17]. This rig allows specimens to be tested in true multi-axial
compression (σx6=σy6=σz) with independent control of loads or displacements in the x, y and z directions.
In each axis the load is applied by a 4 MN hydraulic actuator installed in an independent loading frame: the
x- and y-axis frames are mounted on roller bearings while the vertical position of the z-axis frame is actively
Fig. 2: mac2Ttest rig, showing the six loading platens.
100 mm
33 mm 50 mm
40 mm 50 mm 50 mm 100 mm
100 mm 25 mm
Fig. 3: Sand loading box dimensions, assembly and axes convention. Specimen location shown in yellow.
Applied loads and the resultant displacements are measured using three load cells rated at 4 MN and six
laser interferometer units, with loads measured to an accuracy of±4 kN and displacements measured to±1 µm.
Figure 2 shows the mac2Trig in its unloaded state: the sand loading box is placed in the centre between the six
loading platens.
4.1 Sand loading box
In its original application, mac2Tis used to test cubes of concrete under multi-axial loading conditions, where
the strains involved are very small. In these tests a cube of concrete is simply placed into the test rig and,
[image:9.595.212.416.259.411.2]out without the platens ever touching. In testing sands, however, leaving such gaps between the platens would
allow material to escape, and so a special loading box was fabricated to contain the sand during testing.
The test box is made up of six steel blocks which can be arranged to form an interior cube, where the sand
sample is placed. To assemble the box, four of the blocks are loosely bolted together using bolts, springs and
washers to form a void of 50×50 mm cross-section, into which the remaining blocks then slide. The bolts
are countersunk in oversized holes which, along with the springs, hold the box together while allowing the
blocks to move slightly relative to each other. The dimensions and assembly of the box are depicted in Figure
3, which also shows the axis convention used throughout. In the one-dimensional tests, only the x-axis blocks
are actively stressed by the rig while the others are held at zero displacement so that any stresses in the
y-and z-axis blocks are generated passively by the x-axis loading. Because of this, the x-axis blocks are called
“active” blocks, while the y- and z-axis blocks are collectively called “passive” blocks.
4.2 Quasi-static test methodology
4.2.1 Specimen preparation
Sand specimens were tested at a controlled initial density and at moisture contents of 0%, 2.5% and 5.0%. All
sand used in the tests was first oven-dried at 100◦C for at least four hours, then sieved to break up any lumps
and mixed to ensure a consistent particle size distribution. Each specimen contained 200.00 g of dry sand, to
which 5.00 g or 10.00 g of water was added for a moisture content of 2.5% or 5.0% respectively, equivalent to
8.6% and 17.3% saturation at a dry density of 1.5 Mg m−3. To ensure an even distribution of water, the sand
was mixed in a metal tray by blending between two palette knives. The water lost in transferring the wet sand
from the mixing tray to the test box was found to be 0.04 g to 0.08 g, which was deemed acceptable.
To provide an initial dry density of 1.5 Mg m−3, the specimens were prepared in the following manner. The
four passive blocks of the testing box were bolted together using springs and washers to allow a small amount
(∼1 mm) of movement. Propping the test box on shims, one of the active blocks was inserted so that only the
G-glamps were then secured on the centre of the z-axis blocks and the bottom of the y-axis blocks so that the
remaining active block would just slide in freely. The test box was prepared to this point before preparing the
sand specimen so that the wet specimens could be loaded immediately after mixing to prevent drying out. Each
of the six platens in the mac2Trig was fitted with a 1 mm thick steel plate coated in a 0.25 mm sheet of PTFE
to reduce friction-induced restraint at the interface.
After adding the specimen to the test box, the sand surface was levelled and the remaining active block
carefully lowered in, taking care not to eject any sand. The sand was then compacted using hammer drops to
reach a dry density of 1.5 Mg m−3, which was found by measuring the protrusion of the top block from the
box. Following compaction, the box was carefully rotated into the correct orientation for the test, the g-clamps
released, and the test box loaded into the mac2Trig.
4.2.2 Testing procedure
In a one-dimensional compression test the specimen is deformed along one axis (in this caseεx), while
de-formations in the other two directions are kept at zero (εy=εz=0). To achieve this in mac2T, the load was
applied in the x-axis under load control (∆ σx/∆t), while the other two axes were kept under strain control,
maintaining zero deformation (∆ εy/∆t=∆ εz/∆t=0).
All tests were performed by following the same sequence:
(1) Contact loading: (i) the y-axis and z-axis platens were loaded to 7 kN (this load was supported by the
x-axis platens, see Figure 3); (ii) the specimen was loaded to 7 kN (2.8 MPa) along the x-axis; (iii) the y- and
z-axes were switched to displacement control, and all rates set to zero.
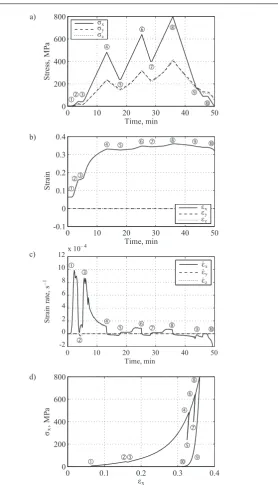
(2) Start of test: (i) the specimen was first loaded at a low rate of 20 MPa min−1toσx=40 MPa; during this
stage the strain rates reached maximum values of approximately 10−3s−1(points 1–2 in Figure 4); (ii) the
stress in the x-axis was kept constant for approximately 5 minutes to monitor potential creep strains (points
2–3).
(3) Cyclic loading to peak stress:σxwas increased in three cycles (points 3–4, 5–6 and 7–8), at a constant
0 10 20 30 40 50 -2 0 2 4 6 8 10 12x 10
– 4 S tr ai n ra te , s − 1 Time, min
0 10 20 30 40 50
0 200 400 600 800 S tr es s, M P a Time, min
0 10 20 30 40 50
-0.1 0 0.1 0.2 0.3 0.4 S tr ai n Time, min
0 0.1 0.2 0.3 0.4
[image:12.595.156.435.88.577.2]0 200 400 600 800 x , M P a x x y z x y z x y z a) b) c) d) ˙ ˙ ˙
Fig. 4: Example of quasi-static one dimensional compression test on dry sand: (a) stress history, (b) strain history, (c) strain rate history∆ εx/∆t, calculated for∆t=10s, and (d) stress-strain relationship in the major
Transmitter bar 1500 mm
Incident bar 1500 mm
Striker bar 400 mm
Gas gun
Back stop Linear bearing Specimen in confining ring Strain gauge
25 mm
250 mm
[image:13.595.106.526.81.219.2]Distance to strain gauges: 1000 mm
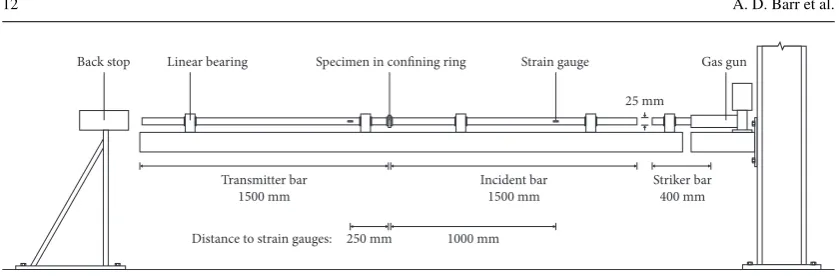
Fig. 5: Schematic of SHPB test rig prepared for a test.
potential hysteretic behaviour and to provide data for calculating the unloading stiffness at different stress
levels.
(4) Unloading: (i)σxwas reduced until it was equalised with the two minor stresses (points 8–9), and (ii) all
stresses were reduced to zero, so that the sample remained intact for further study (points 9–10).
The higher strain rates of 10−3s−1in the initial stages of the tests were chosen to reduce the testing time
to about 50 minutes, assuming that they were sufficiently low, compared to the dynamic rates of 103s−1,
to be considered as static. At higher stress levels the strain rate reduced to below 10−4s−1 (points 5–6 and
7–8 in Figure 4). The sensitivity of the stress-strain behaviour to variations in quasi-static loading rates was
investigated in a test where the stress in the cycling stage was applied at 250 MPa min−1. The stress-strain curve
was identical to those in the tests where the specimen was loaded at 60 MPa min−1.
5 Dynamic experiments
The split Hopkinson pressure bar (SHPB) consists of two long, cylindrical steel bars held in linear bearings
with the sand specimen placed between them. The bars and the steel confining ring are fitted with strain gauges
so that, when the system is struck from one end by a steel striker bar fired from a gas gun, the stress pulse
travelling through the system can be recorded and information on the response of the test specimen obtained. A
schematic of the rig is shown in Figure 5, noting the positions of the strain gauges and the naming convention
for the bars. The incident and transmitter bars are each 25 mm in diameter and 1500 mm in length, while
Handyscope four-channel digital oscilloscope, with samples taken at 14-bit A-D resolution and at a sample
rate of 781.25 kHz.
5.1 Dynamic test methodology
5.1.1 Specimen preparation
As in the quasi-static tests, dynamic tests were carried out with dry sand and sand with moisture contents of
2.5% and 5.0%. Because of the small size of the sand specimens used (3.5 g dry mass), larger wet samples
(∼50 g) were produced to the required moisture content from which the smaller mass was then extracted. This
ensured that the moisture content could be controlled accurately.
Sand specimens were held in an En24T steel confining ring with a 25 mm internal diameter and 35 mm
external diameter over a length of 5 mm, as depicted in Figure 6. On each side of the ring 1 mm thick locating
flanges aided positioning on the pressure bars and prevented soil loss. A strain gauge located on the outside
surface of the ring enabled the circumferential strain of the ring to be measured and, using thick walled pipe
theory, the average internal pressure in the sample could be related to the circumferential strain using the
expression
Pi=
R2
o−R2i
2R2
i
Eεθ (1)
wherePiis the internal radial pressure exerted on the specimen by the confining ring,Eis the Young’s modulus
of the ring,εθ is the circumferential strain measured on the outside of the ring andRoandRi are the outer
and inner radii of the ring respectively [18]. For the current arrangement,Pi=0.48Eεθ. It is important to note
that the length of the sand specimen changes significantly during the test, typically by up to 30%. To take this
into account, the average internal pressure deduced from the circumferential strain was factored by the length
of the confining ring (5 mm) divided by the varying sample length to obtain the radial pressure acting on the
shortened length of sample. This test setup allowed both axial and radial stresses and strains within the sample
a)
b)
5 mm
Measurement taken
25 mm
[image:15.595.126.516.87.249.2]5 mm 5 mm
Fig. 6: Detail of steel confining ring showing a) confinement of sand sample and ring dimensions, b) location of lines for measurement of specimen length.
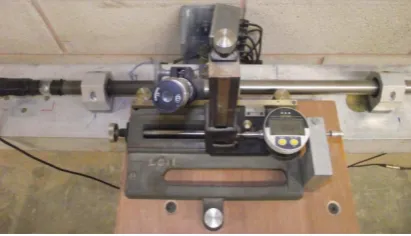
Fig. 7: Travelling microscope with digital dial gauge for measurement of SHPB specimen length.
The position of the strain gauge changes relative to the mid-point of the specimen during the test, as the
incident bar end of the specimen begins to deflect while the transmitted bar end is still stationary. Assuming
that the confining ring is stationary throughout the specimen loading, in a representative test the centre of
the specimen moves approximately 1.0 mm relative to the strain gauge. The wall thickness (5 mm) of the
confining ring has the effect of spreading a load applied to one surface over a larger area on the other, so that
the measurement of radial stress at the strain gauge may be an average over a length of several millimetres
inside the ring. As a result, the movement of the specimen relative to the strain gauge will have a reduced
effect, and the stress measured by the gauge should be representative of the stress experienced by the sand
specimen.
To load a sand specimen into the gauged ring, the transmitter bar was placed into a purpose-made jig which
[image:15.595.213.419.292.410.2]A thin (10 µm thick,∼0.01 g) aluminium foil disk was then placed on the face of the pressure bar inside the
gauged ring, and the 3.5 g sand sample carefully poured into the ring and tamped down using a short length
of bar. A second foil disk was placed on top of the soil sample and also tamped down, then secured to the
confining ring using a very small amount of cyanoacrylate adhesive, confining the sample. During the test, the
strength and mass of the foil could be considered to be negligible. The transmitter bar was carefully removed
from the jig and placed horizontally in a set of linear bearings, and the specimen in the gauged confining ring
brought into contact with the incident bar ready for testing.
In previous tests using a confining ring, the length of the sample was found by measuring the distance
between a pair of dots marked onto the bars using an awl [19]. Using digital callipers, the distance could at
best only be considered as measured to the nearest 50 µm, as the dots themselves had a non-trivial diameter,
and the method relied on consistently lining the callipers up to the exact same point. It was noted that the
processed data was particularly sensitive to the recorded pre-test length of the specimen: a±50 µm tolerance
in the measured length results in a±0.04 Mg m−3error in density measurements.
In the current tests, the incident and transmission bars were each marked with a pair of perpendicular
lines by using a sharp blade, as shown in Figure 6. The distance between the inside edges of these lines was
then measured using a travelling microscope fitted with a digital dial gauge, which is shown in Figure 7.
While the lines themselves had a width of about 500 µm, the microscope enabled measurements to be taken
between the same points consistently which, along with±1 µm accuracy offered by the digital dial gauge,
allowed measurements to be taken within±10 µm. The thickness of the foil discs, 20 µm in total, was taken
into account after the measurement was taken.
5.1.2 Testing procedure
Stress pulses were applied using a striker bar fired by a gas gun, which was set up in a consistent manner to
ensure a similar peak axial stress and strain rate in each test. The gas gun was fitted with a brass diaphragm and
a nylon piston: the piston was inserted 100 mm into the barrel so that the striker could be launched from the
0 50 100 150 200 -100
0 100 200 300 400 500
(a)
Time, µs
S
tre
ss
, M
P
a
Front stress Back stress Radial stress
0 50 100 150 200
0 1000 2000 3000 4000 5000
(b)
S
tra
in ra
te
,
s
-1
Time, µs
0 0.1 0.2 0.3 0.4
S
tra
in
[image:17.595.214.422.99.383.2]Strain rate Strain
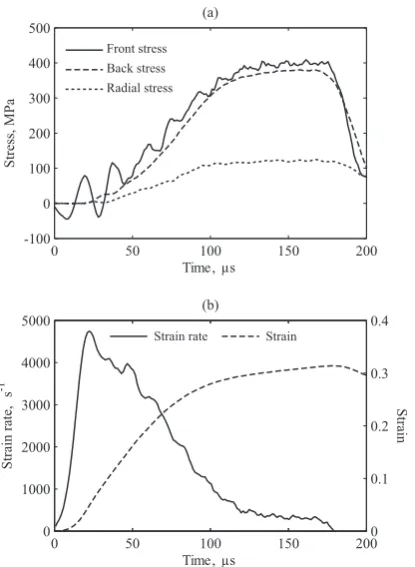
Fig. 8: Typical histories from a dry SHPB test a) axial and radial stress, b) strain and strain rate.
tests are shown in Figure 8, where the oscillations in axial stress are caused by dispersion of the stress pulse in
the pressure bar. No correction for dispersion has been applied in the current work.
This setup provided peak axial stresses in the specimen of approximately 400 MPa. The strain rate in the
specimen typically fell from 4800 s−1at the start of loading to 1000 s−1at the maximum stress, resulting in a
mean strain rate of 2300 s−1. The strain rate imposed on the specimen is a function of both the magnitude of
the loading pulse and the stiffness of the specimen. For materials whose stiffness varies by small but significant
amounts over the range of stresses to which they are subjected in SHPB tests, it is possible to use
specifically-shaped input stress pulses to attempt to ensure that the strain rate is kept more or less constant during the
loading. However, for the highly-compressible sand under investigation in this study, the stiffness varies by
around an order of magnitude over the duration of the SHPB test. Whilst pulse shaping techniques for material
as compliant as this may be possible in theory, they have not been reported in practice. Furthermore, since
d,0 0 e = 0, w = 0
Dry density
Quartz mineral
Bulk density
Bulk density (assuming constant mass, M) Pore water adhered
to grains, pore air draining
S
r< 100%, w and M constant
Fully saturated, further compaction expels pore water
S
[image:18.595.184.378.96.265.2]r= 100%, w and M decreasing
Fig. 9: Schematic comparison of dry density and bulk density responses in a partially-saturated sand.
First unload/reload cycle (500 MPa):
w(%) E(GPa) ν K(GPa)
0.0 35.3 0.25 23.2
2.5 37.4 0.27 27.4
5.0 32.9 0.30 27.6
Second unload/reload cycle (650 MPa):
w(%) E(GPa) ν K(GPa)
0.0 45.3 0.25 30.0
2.5 47.0 0.25 31.0
[image:18.595.205.356.312.464.2]5.0 45.6 0.28 35.7
Table 4: Unload/reload elastic moduli for mac2Ttests with varying moisture content.
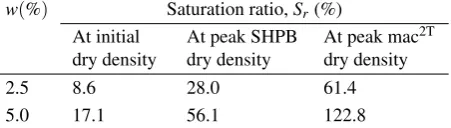
w(%) Saturation ratio,Sr(%)
At initial dry density
At peak SHPB dry density
At peak mac2T dry density
2.5 8.6 28.0 61.4
5.0 17.1 56.1 122.8
Table 5: Theoretical saturation ratios at the initial dry density and the peak dry densities achieved in the SHPB and mac2Ttests, varying with moisture content.
loading rates, we are prepared to accept the variation in strain rate shown in Figure 8, noting that it is six orders
[image:18.595.169.395.520.584.2]6 Results and discussion
Data from the quasi-static mac2Ttests was readily converted into stress-strain data for further examination. In
the SHPB tests the response of the sand specimen was calculated using one-dimensional elastic wave
propaga-tion theory, which is well reported elsewhere and will not be repeated here [20]. One-dimensional condipropaga-tions
were assumed, and the strains recorded in the steel confining ring confirmed that this assumption was valid: the
maximum radial strain in the sand specimen was 0.05%, compared to axial strains of over 30%.
Dry density is used to compare test series rather than bulk density, as tests with higher moisture contents
would otherwise automatically appear to be less stiff on account of the extra mass increasing the bulk density.
As there is no record of the changing mass of the specimen, use of bulk density would also be inaccurate if any
pore water is lost. This is shown schematically in Figure 9, where the dry density increases with stress until all
pores are removed and the density is that of the quartz mineral. At this point the ratio of void volume and solid
volume, the void ratio,e, reduces to zero. Over the same stress range the bulk density is proportionally larger
than dry density until the sand reaches full saturation and pore water begins to be drained, reducing both the
moisture content and mass of the specimen and causing the bulk density to approach the dry density ate=0.
An assumption of constant mass while using bulk density leads to erroneously large values at full saturation.
Axial stress–dry density and mean stress–dry density data are presented in Figures 11 and 12 for the
quasi-static and dynamic tests. All of the specimens tested follow the expected pattern for sands in one-dimensional
compression: at low stresses the particles in the sand roll and slide over each other into a denser configuration,
and then as the voids are filled this compaction mechanism becomes more difficult and a stiffening or ‘lock
up’ response is observed. At higher stresses individual sand particles are crushed, allowing further particle
rearrangement and an even denser configuration. The change from one compression mechanism to another is
gradual so that the material stiffens smoothly over the full stress range [21].
Elastic unloading/reloading moduli for the mac2Ttests are shown in Table 4. Bulk modulus increases when
unloading from the higher stress state of the second unload/reload cycle, and also increases with an increasing
1.4 1.5 1.6 1.7 1.8 1.9 2 2.1 2.2 2.3 2.4 0
100 200 300 400 500 600 700 800
Dry density, Mg/m3
A
xi
al
s
tre
ss
, M
P
a
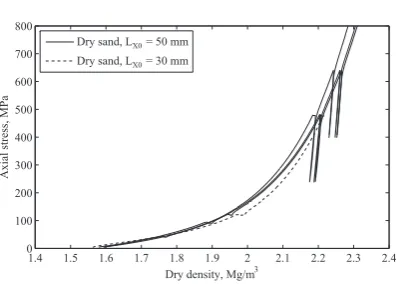
Dry sand, LX0 = 50 mm
[image:20.595.183.393.95.237.2]Dry sand, LX0 = 30 mm
Fig. 10: Comparison of 30 mm and 50 mm long samples in mac2T
The relatively low moisture contents used in the sand specimens meant that the initial saturations were
also low, and so none of the sand specimens tested using the SHPB became fully saturated during testing
(see Table 5). As a result, the rapid stiffening of soil responses associated with loading of pore water was not
observed. Saturation of the sand specimens is expected to occur at a dry density of approximately 2.35 Mg m−3
at a moisture content of 5.0%, and so these specimens will have reached full saturation towards the end of
the high-pressure quasi-static tests. As the quasi-static tests were carried out in drained conditions, the excess
water was simply expelled from the sample rather than sustaining additional load, as evidenced by droplets of
water on the test box platens following the test.
Since the initial aspect ratios of the mac2Tand SHPB specimens were different, a quasi-static test was
carried out on a shorter specimen to ensure that there were no significant size or friction effects, which would
make it difficult to compare the quasi-static and dynamic test series. A specimen of dry sand was tested using
the same procedure described in Section 4.2, except that 120 g of sand was used so that the initial length was
approximately 30 mm rather than 53 mm, as this is the smallest length that can be tested using the steel test
box. The results are compared with the standard specimens in Figure 10, where the difference between the two
aspect ratios is within experimental error, indicating that there are no significant size or friction effects between
1.4 1.5 1.6 1.7 1.8 1.9 2 2.1 2.2 2.3 2.4 0 100 200 300 400 500 600 700 800
Dry density, Mg/m3
A xi al s tre ss , M P a
mac2T w = 0.0%
mac2T w = 2.5%
mac2T w = 5.0%
(a)
1.4 1.5 1.6 1.7 1.8 1.9 2 2.1 2.2
0 100 200 300 400 500
Dry density, Mg/m3
A xi al s tre ss , M P a
SHPB w = 0.0% SHPB w = 2.5% SHPB w = 5.0%
(b)
1.4 1.5 1.6 1.7 1.8 1.9 2 2.1 2.2 2.3 2.4
0 100 200 300 400 500 600 700 800
Dry density, Mg/m3
A xi al s tre ss , M P a
mac2T w = 0.0% mac2T w = 2.5% mac2T w = 5.0% SHPB w = 0.0% SHPB w = 2.5% SHPB w = 5.0%
(c)
1.4 1.5 1.6 1.7 1.8 1.9 2 2.1 2.2 2.3 2.4
0 100 200 300 400 500 600 700 800
Dry density, Mg/m3
A xi al s tre ss , M P a
mac2T w = 0.0% mac2T w = 2.5% mac2T w = 5.0% SHPB w = 0.0% SHPB w = 2.5% SHPB w = 5.0%
[image:21.595.111.521.84.406.2](d)
Fig. 11: Axial stress – dry density curves for a) mac2Ttests, b) SHPB tests, c) mac2Tand SHPB tests, d) mac2T and SHPB tests (mean results). The curves are truncated at maximum stress for clarity.
6.1 Moisture effects
In the quasi-static tests the addition of water leads to a reduction in the stiffness of the sand specimen, with
the 2.5% moisture content specimens behaving less stiffly than the dry specimens, and the 5.0% moisture
content specimens less stiff than the 2.5% moisture content specimens. This is indicated by the higher densities
achieved by the wet specimens for a given stress in Figures 11a and 12a. As reported by Martin et al. [8], this
reduction in stiffness is likely due to the lubricating effect of the water between the sand particles, reducing
inter-particle friction and facilitating the rolling and sliding mechanism which leads to compaction.
In contrast, the dynamic SHPB tests show no significant change in stiffness with changing moisture content:
while the mean results in Figures 11d and 12d appear to show a small decrease in stiffness with increasing
1.4 1.5 1.6 1.7 1.8 1.9 2 2.1 2.2 2.3 2.4 0 100 200 300 400 500 600
Dry density, Mg/m3
M ea n s tre ss , M P a
mac2T w = 0.0% mac2T w = 2.5% mac2T w = 5.0%
(a)
1.4 1.5 1.6 1.7 1.8 1.9 2 2.1 2.2
0 50 100 150 200 250
Dry density, Mg/m3
M ea n s tre ss , M P a
SHPB w = 0.0% SHPB w = 2.5% SHPB w = 5.0%
(b)
1.4 1.5 1.6 1.7 1.8 1.9 2 2.1 2.2 2.3 2.4
0 100 200 300 400 500 600
Dry density, Mg/m3
M ea n s tre ss , M P a
mac2T w = 0.0%
mac2T w = 2.5%
mac2T w = 5.0%
SHPB w = 0.0% SHPB w = 2.5% SHPB w = 5.0%
(c)
1.4 1.5 1.6 1.7 1.8 1.9 2 2.1 2.2 2.3 2.4
0 100 200 300 400 500 600
Dry density, Mg/m3
M ea n s tre ss , M P a
mac2T w = 0.0%
mac2T w = 2.5%
mac2T w = 5.0%
SHPB w = 0.0% SHPB w = 2.5% SHPB w = 5.0%
[image:22.595.76.487.89.407.2](d)
Fig. 12: Mean stress – dry density curves for a) mac2Ttests, b) SHPB tests, c) mac2Tand SHPB tests, d) mac2T and SHPB tests (mean results). The curves are truncated at maximum stress for clarity.
assumed that the main effect of moisture in the quasi-static tests is in aiding particle rearrangement by rolling
and sliding, the lack of effect in the dynamic tests could indicate that the compression of the sand at higher
strain rates is dominated more by particle crushing than by particle rearrangement; however, this contradicts
previous work, such as that by Farr [13], which showed that sandy materials exhibited less particle breakage at
higher strain rates. An alternative explanation could be that at the higher strain rate the moisture does assist in
the rearrangement of particles as in the quasi-static tests, but that another mechanism, such as localised loading
0 0.05 0.1 0.15 0.2 0.25 0.3 0.35 0.4 0 500 1000 1500 2000 2500 Axial strain S e c a nt c ons tra ine d m odul us , M P a
mac2T w = 0.0%
mac2T w = 2.5%
mac2T w = 5.0%
SHPB w = 0.0% SHPB w = 2.5% SHPB w = 5.0%
(a)
0 0.05 0.1 0.15 0.2 0.25 0.3 0.35 0.4
0 500 1000 1500 Axial strain S ec ant Y oung’s m odul us , M P a
mac2T w = 0.0%
mac2T w = 2.5%
mac2T w = 5.0%
SHPB w = 0.0% SHPB w = 2.5% SHPB w = 5.0%
(b)
0 0.05 0.1 0.15 0.2 0.25 0.3 0.35 0.4
-0.1 0 0.1 0.2 0.3 0.4 0.5 Axial strain S e c a nt P oi s s on’s ra ti o (c)
0 0.05 0.1 0.15 0.2 0.25 0.3 0.35 0.4
0 500 1000 1500 Axial strain S e c a nt bul k m odul us , M P a
mac2T w = 0.0% mac2T w = 2.5% mac2T w = 5.0% SHPB w = 0.0% SHPB w = 2.5% SHPB w = 5.0%
[image:23.595.112.522.83.403.2](d)
Fig. 13: Mean secant moduli for mac2Tand SHPB tests: a) Constrained modulus, b) Young’s modulus, c) Pois-son’s ratio, d) Bulk modulus.
6.2 Strain-rate effects
6.2.1 One-dimensional analysis
Much of the referenced work on strain-rate effects in soils has focused on recording axial stresses and strains,
so that changes in soil stiffness were assessed using the constrained modulus,M, defined as
M=σx
εx
(εy=εz=0) (2)
whereσxis axial stress andεxis axial strain, and uniaxial strain is assumed.
Figure 11 shows the relationship between axial stress and dry density, where the dynamically-tested
the significant increase in secant constrained modulus for the dynamic tests in Figure 13a, which is particularly
evident at low strains. The ratio of dynamic to quasi-static stiffness is greater for the moist sand due to the
reduction in stiffness in the 2.5% and 5.0% moisture content mac2Tspecimens. Moduli for the mac2Ttests
are unavailable at small strains, as data was only recorded after each face of the test box had been loaded to
2.8 MPa.
It is noted that while the mac2Ttests were fully drained, the loading of the SHPB specimens more closely
resembled undrained conditions, with little opportunity for the escape of pore air. The resulting compression
of pore air contributes to the stiffness of the specimen at higher strains, but a calculation based on ideal gas
behaviour in undrained conditions estimates that the compression of air observed at 2.1 Mg m−3would require
an additional pressure of 190 kPa, a small fraction of the 80 MPa mean increase in stress observed in the dry
sand at 2.1 Mg m−3compared to the quasi-static tests.
In the SHPB tests, the small specimen size and the random particle packing of a loose sand generates a
certain level of variability in the results, however the quasi-static and dynamic test results in Figure 11c do
not overlap except during the later part of the pulse where the series begin to converge. This convergence is
associated with the part of the SHPB test where the strain rate has reduced from 4800 s−1 to approximately
400 s−1, as seen in Figure 8. Similarly, the peaks in constrained modulus at strains below 0.1 correspond with
the peak strain rates in the tests.
6.2.2 Three-dimensional analysis
While an apparent strain-rate effect is observed when considering one-dimensional stresses and strains,
exam-ination of the full three-dimensional stress state reveals a much reduced effect. This is clear in comparison of
Figures 11d and 12d, where use of mean stress instead of axial stress causes the quasi-static and dynamic series
to overlap. It becomes apparent that a comparison of constrained moduli is not sufficient to fully describe the
effects of strain rate on the response of the sand, and so comparisons of bulk modulus are made by calculating
Poisson’s ratio were calculated by using Hooke’s Law in its three-dimensional form
ε1= 1
E(σ1−ν(σ2+σ3))
ε2= 1
E(σ2−ν(σ1+σ3))
ε3= 1
E(σ3−ν(σ1+σ2))
(3)
whereEis Young’s modulus andν is Poisson’s ratio. The bulk modulus,K, of the sand was then calculated
using the relationship
K= E
3(1−2ν) (4)
In the quasi-static tests, the calculated Poisson’s ratios (Figure 13c) for the sand specimens are initially 0.5
due to the hydrostatic pressure applied at the beginning of the tests, but then reduce to a constant value of 0.32–
0.35 once one-dimensional loading is applied. In the dry SHPB tests, the apparent Poisson’s ratio increases
from zero to a mean value of 0.22, while the 2.5% and 5.0% moisture content tests appear to remain at zero for
longer, increasing to a mean value of 0.16. The large initial fluctuations in Poisson’s ratio in the dynamic tests
are due to the stresses at that point being similar in magnitude to the signal noise.
The initial low radial stresses appear to be due to a radial inertial effect causing confinement of the specimen
and reducing the stress measured at its surface. Such inertial effects have previously been identified in materials
such as rock [22] and plain concrete [23] as the cause of apparent increases in material strength at high strain
rates. When loaded axially at a high strain rate, the inertia of the specimen prevents immediate expansion in
the radial direction, confining the specimen in a state of uniaxial strain. The resulting internal radial confining
stress would increase the axial stress required to achieve a given strain, which could explain the increase in
constrained modulus observed in the SHPB specimens.
The radial inertial confinement is released by a wave propagating from the surface of the specimen towards
its centre. An annulus of material on the surface of the specimen is therefore first to accelerate radially, and so
applies stress to the confining ring almost immediately on the arrival of the axial stress pulse. However, as this
which would be applied to the ring under quasi-static loading. As the release wave propagates inwards from
the surface of the specimen, more and more of the specimen is permitted to accelerate radially and contribute
to the stress in the confining ring. The measured radial stress on the specimen surface would therefore increase
with time as the inertial confinement of the specimen is released and the radial stresses are transferred to the
confining ring.
When the Young’s moduli and Poisson’s ratios are combined into bulk moduli in Figure 13d, the dynamic
specimens exhibit a much smaller increase in stiffness over those tested quasi-statically: at a strain of 0.25
the dynamic specimens are 65% stiffer on average when considering constrained modulus, but only 30% stiffer
when considering bulk modulus. The bulk moduli for individual dynamic tests also overlap with the quasi-static
bulk moduli in several instances, so that the ‘strain-rate effect’ observed in comparison of constrained moduli
is greatly reduced when the specimens’ three-dimensional stress states are considered, as would be expected
from observation of the stress-density data in Figures 11 and 12.
7 Conclusions
Quasi-static one-dimensional compression tests on fine quartz sand were carried out to axial stresses of 800 MPa,
alongside dynamic tests using a split Hopkinson pressure bar to axial stresses of 400 MPa. In both test series
lateral stresses and strains were also recorded.
Between strain rates of 10−3s−1and 103s−1 a significant increase in axial stiffness was observed in dry
sand, but this effect was greatly reduced when mean stresses were considered. The reduction in Poisson’s ratio
at higher strain rates suggests that the increase in axial stiffness is not due to an inherent strain-rate dependence,
but rather is the result of increased confinement due to the radial inertia of the SHPB specimens.
Specimens were also prepared at moisture contents of 2.5% and 5.0%. In the quasi-static tests the
spec-imens behaved less stiffly with increasing mositure content, while in the dynamic tests the addition of water
had little effect on the overall stiffness, causing the quasi-static and dynamic series to diverge with increasing
Further experiments on a variety of other soils are required to establish whether this is a general trend,
but as many of the previous studies on soils at high strain rates, including those by Farr [13] and Song et al.
[3], presented only axial stress and strain results, this data highlights the importance of understanding the full
three-dimensional stress state of the soil under transient loading conditions. The variation in radial stresses with
strain rate also serves to warn against assumptions of consistent stress ratio with changing strain rate.
Acknowledgements The authors wish to thank Dstl for funding this research, which is part of the QinetiQ-led Force Protection Engineering (FPE) research programme [1].
References
1. J Warren, S Kerr, A Tyas, S D Clarke, M Petkovski, A Jardine, P Church, P Gould, and A Williams.
Briefing: UK Ministry of Defence Force Protection Engineering Programme. Proceedings of the ICE
-Engineering and Computational Mechanics, 166(3):119–123, 2013.
2. A M Bragov, A K Lomunov, I V Sergeichev, K Tsembelis, and W G Proud. Determination of
physi-comechanical properties of soft soils from medium to high strain rates. International Journal of Impact
Engineering, 35, 2008.
3. B Song, W Chen, and V Luk. Impact compressive response of dry sand. Mechanics of Materials, 41:
777–785, 2009.
4. M E Kabir, B E Martin, and W Chen. Compressive behavior of fine sand. Technical report, Sandia National
Laboratories, 2010.
5. W A Charlie, C A Ross, and S J Pierce. Split-hopkinson pressure bar testing of unsaturated sand.
Geotech-nical Testing Journal, 13(4):291–300, 1990.
6. C Felice, J Brown, E Gaffney, and J Olsen. An investigation into the high strain-rate behavior of compacted
sand using the split hopkinson pressure bar technique. InProceedings of the 2nd Symposium on the
7. C Felice, E Gaffney, J Brown, and J Olsen. Dynamic high stress experiments on soil.Geotechnical Testing
Journal, 10(4):192–202, 1987.
8. B E Martin, W Chen, B Song, and S A Akers. Moisture effects on the high strain-rate behavior of sand.
Mechanics of Materials, 41:786–798, 2009.
9. S J Pierce and W A Charlie. High-intensity compressive stress wave propagation through unsaturated
sands. Technical report, Colorado State University, 1990.
10. C A Ross, P T Nash, and G J Friesenhahn. Pressure waves in solids using a split hopkinson pressure bar.
Technical Report ESL-TR-86-29, Air Force Engineering and Services Centre, 1986.
11. G E Veyera, W A Charlie, and C A Ross. Strain-rate effects in unsaturated soils. InSixth International
Symposium on Interaction of Nonnuclear Munitions with Structures, 1993.
12. G E Veyera. Uniaxial stress-strain behavior of unsaturated soils at high strain rates. Technical report,
Wright Laboratory Flight Dynamics Directorate, AFMC, 1994.
13. J V Farr. Loading rate effects on the one-dimensional compressibiliy of four partially saturated soils.
Technical report, US Army Engineer Waterways Experiment Station, 1986.
14. M Baamer, E Suescun-Florez, N Machairas, and M Iskander. Strain rate dependency of sand response
under uniaxial monotonic loading. InIFCEE 2015, pages 171–181, 2015.
15. H. Lu, H. Luo, and R. Komaduri. Dynamic compressive response of sand under confinements. InSEM
2009 Annual Conference and Exposition on Experimental and Applied Mechanics, page 53, 2009.
16. H Luo, H Lu, W L Cooper, and R Komanduri. Effect of mass density on the compressive behavior of dry
sand under confinement at high strain rates. Experimental Mechanics, 51:1499–1510, 2011.
17. M Petkovski, R S Crouch, and P Waldron. Apparatus for testing concrete under multiaxial compression at
elevated temperature (mac2t).Experimental Mechanics, 46:387–398, 2006.
18. R C Stephens.Strength of materials: theory and examples. Hodder Arnold, 1970.
19. S Rigby and A Tyas. Experiments on the mechanical properties of leighton buzzard and sandy loam soils
at static and dynamic strain rates. Technical report, prepared for Dstl Porton Down, 2012.
21. M Omidvar, M Iskander, and S Bless. Stress-strain behavior of sand at high strain rates. International
Journal of Impact Engineering, 49:192–213, 2012.
22. C Young and CN Powell. Lateral inertia effects on rock failure in split-hopkinson-bar experiments. In
20th US Symposium on Rock Mechanics (USRMS). American Rock Mechanics Association, 1979.
23. PH Bischoff and SH Perry. Compressive behaviour of concrete at high strain rates. Materials and