promoting access to White Rose research papers
White Rose Research Online
[email protected]
Universities of Leeds, Sheffield and York
http://eprints.whiterose.ac.uk/
This is an author produced version of a conference paper presented at
1st
Workshop of the Service-Oriented Software Research Network (SOSoRNET)
White Rose Research Online URL for this paper:
http://eprints.whiterose.ac.uk/id/eprint/78061
Paper:
Evolving Dataflow Visualization to Service-Oriented Architectures on the Grid
Haoxiang Wang, Ken Brodlie, Jason Wood
School of Computing, University of Leeds, Leeds UK LS2 9JT
[email protected]
Abstract
In this paper, we describe the way in which the dataflow visualization may be carried over to a Service-Oriented architecture, using Web services in a Grid environment. Previous related work in dataflow visualization is reviewed, and used to motivate the idea of a Service-Oriented dataflow pipeline. The concepts of static and dynamic Service-Oriented visualization dataflow are introduced. A demonstrator is used to illustrate static Service-Oriented dataflow – where the dataflow pipeline is fixed- and we also report progress towards dynamic Service-Oriented dataflow – where the pipeline is configurable. Collaboration is an integral part of the design.
1. Introduction
Visualization is concerned with generating virtual images from data gathered by observation or simulations, helping scientists to achieve better understanding, analysis and presentation of their data. Haber and McNabb [1] proposed an elegant visualization reference model in the early days of visualization (1990), abstracting visualization as a set of simple processes linked together in a dataflow pipeline. This dataflow paradigm has proved an extremely useful model over the past fifteen years, and has formed the basis of a number of important visualization systems, known as Modular Visualization Environments. Several have been extended to provide for collaborative visualization, where a group of researchers can exchange data and images across a network.
In parallel with the development of visualization, we have seen the emergence in distributed computing of Service-Oriented architectures and Grid computing. The idea of distributed computing is to split the system into a set of processes and allocate these onto different computers or clusters. Service-Oriented Architecture can be regarded as a paradigm of distributed computing, which implements distributed computing tasks as services with standard interfaces.
The aim of this paper is to explore how we can evolve dataflow-based visualization systems into a Grid-based Service-Oriented architecture. We begin with a description of the dataflow concept, how it has been used
in visualization and how it has evolved to support collaborative visualization. In Section 3, we describe the benefits of moving to a Service-Oriented architecture for visualization, and present some details about developing the Service-Oriented visualization pipeline in Section 4 and 5. An extension of an XML-based language for describing pipelines in the Service-Oriented scenario is also included in this paper.
2. Related previous work
A visualization pipeline is composed of a sequence of procedures that operate on data to generate geometry that can be rendered by the graphics engine – essentially transforming numerical data by some metaphor into a visual representation. Haber and McNabb [1] elegantly described this visualization pipeline in a reference model shown in Figure 1. The data module imports raw data into the visualization pipeline from a data file. With a
simulation module instead of a data module, we can also feed the visualization pipeline with dynamically generated data from simulations. The filter module refines the raw data, for example by selecting a portion of interest. The map module converts data into a geometric representation (e.g. an isosurface or a slice). The render
module turns the geometric expression into visual graphics that provides more explicit understanding of the raw data.
Data Filter Map Render
Data Filter Map Render
Figure 1. Haber-McNabb reference model
A number of visualization systems have been developed from the Haber and McNabb model – including IRIS Explorer [2][3] and IBM Open Data Explorer [4]. They are typically called Modular Visualization Environments (MVEs), since they provide a set of modules each implementing some step in the pipeline.
collaborative working. As shown in Figure 2, by using COVISA modules, a pipeline created by one user can share parameters and dataflow with the pipeline of a collaborator. This allows us to distribute the dataflow between different computational resources and different human expertise. For example, in a meteorological visualization, the data provider runs a data module and a filter module at the location where data is stored to avoid extra network traffic; the visualization expert runs a map module to generate geometry on a powerful Grid cluster, as this is usually the most computational customized process in the pipeline; and the meteorologist runs a render module on his desktop to explore the graphics with his expertise.
The emergence of the Web as a distributed computing platform in the 1990s allowed the visualization community to evolve the dataflow concept further. It became possible to execute all, or part, of the visualization pipeline on a server, and transmit images or geometry for rendering in a browser.
Wood et al [6] described several scenarios for Web-based visualization. One of the most useful is shown in Figure 3, where the data, filter and map processes execute on the server, and geometry is transferred in VRML format to the client for rendering in a viewer. Notice that
the parameters of modules in the pipeline can be controlled from the browser.
This Web-based visualization is an early example of one aspect of the Service-Oriented concept, namely the separating of the dataflow pipeline into a client and server framework. The traditional dataflow visualization paradigm can also be an excellent match to the concept of a Service-Oriented architecture: the modules simply become services. Charters [7][8] has described the design of a visualization system based on these concepts, in particular using Web Services. Some ideas from Charters’ work are used in our Service-Oriented visualization pipeline, but we take this approach further, by using notification Web Services and enabling dynamic composition of visualization services.
Share parameter
User A
User B
Share dataflow Filter
Data Map Render
Map Render COVISA
[image:3.612.61.299.247.398.2]COVISA
Figure 2. Collaborative visualization by using COVISA
COVISA
COVISA
3. Visualization pipeline in a
Service-Oriented architecture
3.1 The benefits of Service-Oriented approach to visualization in Grid computing
By moving the dataflow visualization pipeline to a Service-Oriented architecture, we gain a range of benefits:
Ability to interoperate - Different individuals and companies can develop visualization services using different technologies and on different platforms and connect them together to generate the visualization result they require.
Ability to extend – There are two aspects here: first, as long as the service interface remains the same, we can change the implementation or working environment of the service according to the requirements, without affecting other parts of the system; second, when a new visualization function is required, we can simply build it as a new visualization service which will be easily linked into the visualization pipeline by using a SOAP message to invoke its interface.
Filter Data
Render Map
Image WWW
Web Interface Controls
[image:3.612.67.285.490.618.2]Ability to collaborate – Again there are two aspects to collaboration. First, Visualization specialists can collaborate to provide a global repository of visualization Web services, built and deployed by different specialists at geographically distributed locations. Second, visualization users can collaborate in a session, by connecting to the same services and sharing dataflow and parameter settings.
Figure 3. Web-based visualization architecture Additionally, by implementing the visualization modules provided by MVEs as Web Services or packaging several relevant modules as a Web Service, the transfer from MVEs to Service-Oriented visualization systems can be quite straightforward.
general-purpose protocols and interfaces. By moving dataflow visualization into the Grid environment, the benefits are: for visualization, particularly for large scale scientific visualization and real-time simulation, we can achieve higher performance from powerful Grid computational resources; on the other hand, for collaboration, we can benefit from the “standard, open, general-purpose protocols and interfaces” and also some other Grid middleware facilities.
3.2. Static and dynamic Service-Oriented pipeline
We define two types of Service-Oriented visualization pipeline: static and dynamic.
The static Service–Oriented visualization pipeline packs the entire visualization pipeline as a visualization service or a set of distributed visualization services. The client can be a Web portal for users to control the visualization by setting parameters to the visualization services and view the visualization results produced. End-users do not need any special visualization software or powerful computational resource on their desktops, and the visualization pipeline will be transparent to them, but on the other hand end-users lose the flexibility to customize the visualization pipeline, as the connections between visualization services are fixed when the system is deployed.
To offer users more flexibility, we propose the idea of dynamic Service-Oriented visualization pipeline. This will give end-users the ability to link services to generate customized dataflow pipelines. Compared with the static pipeline the dynamic pipeline can also be modified after it is generated. It gives end-users more flexibility to make best use of their expertise, skills and knowledge, but at the same time it may not be so useful for less experienced users.
There is also a compromise to balance the flexibility and usability for end-users. With a dynamic dataflow visualization system, advanced users can generate a visualization pipeline for a particular visualization task or a set of visualization tasks, and encapsulate the pipeline as a static pipeline with an easily accessible interface, i.e. a Web portal, for non-expert users. Through this interface, non-expert users do not need to know the details about visualization pipeline, but can still feed in parameters to the control the pipeline and get the visualization result generated from the pipeline.
4. Static Service-Oriented pipeline
Based on the concept of the static Service-Oriented visualization pipeline introduced in section 3, a demonstrator was built to explore the idea further.
4.1 Demonstrator
Background: The experiment was demonstrated at the UK e-Science All Hands Meeting 2005. It was cooperatively developed by the University of Leeds in the UK and Beihang University in China. The application was based around a heart modeling simulation which was used in gViz e-Science project [9]. The simulation aims to help scientists to investigate re-entrant arrhythmia and irregular heartbeat by simulating the electrical behaviour of cardiac virtual tissue. The experiment sought to investigate the potential of static Service-Oriented visualization, and also to investigate the interoperability of Grid systems in the UK and China. CROWN [10], short for China Research and development environment Over Wide-area Network, is a middleware and testbed for Grid and e-Science applications in China. Both CROWN middleware, which is an extension based on GT4, and CROWN Grid network are used in this experiment. The Grid environment of the experiment in Leeds is the White Rose Grid [11] and Leeds TestGrid, which is a trial Grid environment within the University of Leeds.
Scenario: The scenario is a group of computational biologists at different locations around the world who are not skilled in visualization or Grid computing, but want to collaboratively investigate the behaviors of the human heart by running a large number of heart modeling simulations concurrently on a cluster. Simulations are considered “private” to the scientists who are running them, and so they are executed locally on their own computer clusters, keeping all the data confidential. However, they share the resulting visualization and also share in the control of the simulations. During the collaborative session, all the participating scientists use their Web browsers to access the Web portal of a trusted third party static visualization pipeline which will retrieve raw data from simulations and generate a graphic representation of the simulation data. Through the Web portal the scientists can investigate the images of simulations and control the running of simulations, without being concerned about the details of generating the visualization.
Implementation: As shown in Figure 4, in the experiment, simulations are geographically distributed to make use of the computational resources both in the UK and China. They generate raw data and pass it to other visualization services in the pipeline. The visualization pipeline processes the raw data step by step and converts it into a graphical form. To keep them updated with the latest data from simulations, participants have to request these images from the static visualization pipeline through the Web portal.
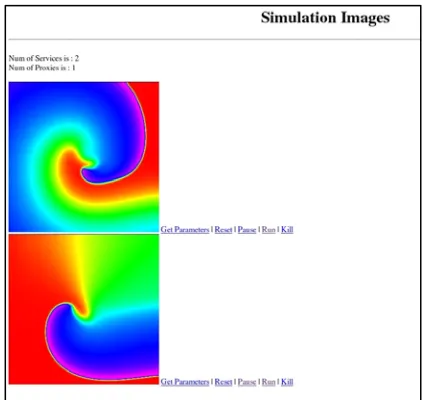
simulations locally. In theory, as a Service-Oriented system, the visualization pipeline itself can also be distributed, but the network bandwidth prohibited this. In the real practice, the dataflow transfer between UK and China turned out to be very time consuming, to achieve relatively acceptable performance, we kept both of the visualization Web services on the same Grid network, the CROWN Grid. Again, to reflect the scenario that participating scientists may be located anywhere, a Web portal access to the visualization pipeline is provided. As long as the scientists can access the Web portal over the Internet, they can view the images of the running heart modeling simulations and also control the simulations collaboratively. Figure 5 shows the screenshot of the Web portal and figure 6 is the simulation images returned from the static Web-Service-Oriented visualization pipeline - generated from simulations running at WRG in UK and CROWN Grid in China. The Web page contains simulation images, some simple interactions with simulations are also provided, such as starting, pausing, killing simulation and viewing the parameters of simulations.
[image:5.612.325.537.78.278.2]
Figure 6. Screenshot of the simulation images generated from the gViz Web portal
4.2 Discussion
Figure 4. The gViz CROWN experiment architecture Simulation Simulation
Viz Service A
Viz Service B Web portal
User A User B Leeds Grid China Grid
Pipeline across Grid networks
Pros: The experiment was developed with a Service-Oriented architecture, so it provides ‘Service-Service-Oriented’ features such as extensibility, interoperability, platform-independence, and so on. Grid computational resources on two Grid networks are utilized in the experiment, and the visualization dataflow is distributed on a global scale. Collaboration has been achieved in two aspects: data providing - users can run different simulations geographically distributed, but investigate them at the same time; visualization interaction – although only simple interactions with simulations have been implemented in the experiment, such as starting, killing or pausing a simulation and viewing current parameters of the simulations, in theory, we can provide more interactive functions including setting colour map schema, setting graphic size and quality, etc.
Cons: As a static Service-Oriented visualization, end-users cannot modify the pipeline, preventing them from visualizing simulation data in a different way. Users can only share awareness of each other’s actions by using screen-sharing tools such like Virtual Network Computing (VNC). Another disadvantage is end-users cannot be notified with the latest visualization result generated from running simulations. In order to update the result, users have to ‘pull’ the visualization result out from the system, by sending request via Web portal again and again.
of the implementation of such global-scaled Service-Oriented systems to reduce the network traffic. However, it might be difficult to predict network traffic, as the size of the data passed along the pipeline varies, largely depending on the data we process. If users can dynamically distribute the visualization pipeline across different Grid network at run-time, users might be able to find a best solution in practice to make the visualization pipeline work most efficiently.
5. Dynamic Service-Oriented pipeline
In order to address the problems described in the static version of Service-Oriented visualization, a framework of dynamic Service-Oriented collaborative visualization is introduced in this section. This will enable users to create a visualization pipeline collaboratively and dynamically, sharing awareness of other participants’ actions and getting notified with the latest generated visualization results.
5.1 Design of the framework
Instead of using basic Web services, we use notification Web services to build up a dynamic Service-Oriented visualization pipeline. WS-Notification, which includes a set of specifications [12] and a whitepaper [13], defines a standard Web services approach to enable notification by following a topic-based publish/subscribe pattern. The WS-Notification is partially implemented by GT4 currently. However, notification Web services in GT4 allow us to publish a resource property (RP) as a topic. Each time the value of the RP topic changes, it triggers a notification to deliver the change to all subscribed clients.
As an example, suppose that we want to pass the raw data generated from a simulation service to an isosurface
service. On the simulation service, a RP which holds the simulation data should be published as a notification topic. When a user wants to connect the two services, he/she needs to send ‘require’ to the isosurface service to let it subscribe to the simulation data topic on the
simulation service. Whenever the simulation service creates new data, the isosurface service will be notified and will get the latest data automatically delivered from the simulation service. By using notification services to build an entire visualization pipeline, the mechanism of visualization dataflow can be achieved.
The reasons for choosing notification Web services are: all notification services have a ‘subscribe’ interface which provides a unique interface for various visualization services and makes it possible to link them dynamically to create a dataflow; linking a pipeline in the pattern of subscription/notification enables ‘pushing’ visualization, as any changes of visualization dataflow,
published as RP resource, will be delivered to all the subscribers; collaborative features, such as sharing parameters and visualization dataflow in the Modular Visualization Environments, can also be implemented in a notification Web service pipeline.
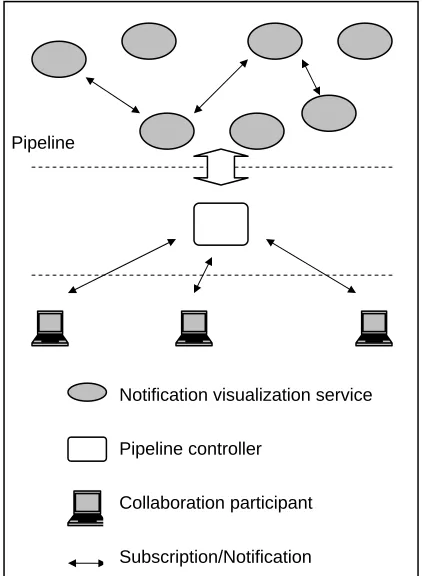
Pipeline
Notification visualization service
Pipeline controller
Collaboration participant
Figure 7 graphically shows what the proposed framework looks like. A controller service is added in between the end-users and the visualization pipeline on the Grid, in order to enable dynamic and collaborative building of the pipeline, and provide more collaborative features. The controller works as a centralized proxy for visualization services, through which users can send requests to the visualization pipeline to create/destroy, connect/disconnect service instances and set parameters to visualization services. The controller also functions as a shared workspace for participants. It keeps a description of the current pipeline (we will talk about the pipeline description in section 5.2) which can be retrieved for the later joiners in the collaborative session. The controller is implemented as a notification service as well, so participants can share detailed awareness of each other’s actions if a RP about users’ actions is published as a notification topic on the controller.
5.2. Representation of visualization pipeline
[image:6.612.335.546.138.426.2]As the visualization pipeline is generated dynamically and collaboratively, this raises the requirement of
Figure 7. Dynamic service-oriented collaborative visualization architecture
representing the visualization pipeline in an appropriate way in order to keep the information of the pipeline and change it at run time.
skML is an XML-based dataflow description language [14] which describes visualization pipelines in a generic way, so that the skML description can be independent of the implementation of the pipeline. It fits well in Modular Visualization Environments such as IRIS Explorer, but it lacks some features to describe characteristics of collaborative Service-Oriented visualization pipelines.
In order to represent the dynamic Service-Oriented pipeline, we simply extended the skML language. An ‘instance’ element replaces the ‘module’ element in the skML to represent visualization service instances, but the ‘link’ element in skML is kept to represent the subscriptions to notifications.
In our extension, the description records richer information about the visualization pipeline including all the output and input ports for each service and all the parameter settings. Another difference is the addition of new properties such as ‘owner’ and ‘sharable’, which identify who owns this visualization service instance and who are allowed to access this service instance. These new properties are added for the purpose of secure collaboration, so that it will be possible to put access restrictions on visualization services created by different users in the collaboration.
5.3 Dynamic Service-Oriented collaborative visualization experiment and global vision
We implemented four visualization services as a simplified visualization service repository: a data service; an isosurface service; a slice service; and an inline service. A pipeline controller service is created which knows how to launch instances from these visualization services and how to invoke functions provided by these instances. A GUI client is provided for end-users to connect onto the
pipeline controller service so that they can choose the appropriate services from the service repository. This allows them to build up visualization pipeline by linking them in a notification/subscription mode to produce the visualization they expected.
The pipeline can be modified collaboratively after it is created. For example, as shown in figure 8, firstly, only the slice service is chosen to visualize the dataset, but some participants are not satisfied with the result, so they try to enhance the visualization by adding an isosurface service into the pipeline, and finally combines both geometries together by using an inline service.
Imagine a group of scientists geographically distributed round the world, some of them have expertise in mathematics or chemistry, some are experts in visualization. These specialists can use their own knowledge to build up simulation services and visualization services in their familiar local Grid
[image:7.612.317.554.128.307.2]environment. With the dynamic Service-Oriented collaborative visualization framework, they can collaboratively choose the most appropriate services to generate the best visualization result.
Figure 8. Dynamic modification of the visualization pipeline
6. Conclusions and future work
This paper describes the implementation of dataflow visualization in a Service-Oriented architecture in the Grid environment by using Web service technologies.
A demonstrator is used to explain the static Service-Oriented collaborative visualization, in which visualization pipeline is implemented as a fixed composition of a set of distributed visualization services.
A notification-service-based framework is also proposed for dynamic Service-Oriented visualization pipeline. The publish/ subscribe pattern is used to link the visualization services into a pipeline. A prototype of the proposed system has been implemented as a proof of concept.
The following aspects need to be explored in the next stage to create a comprehensive collaborative visualization system.
Security is one of the important aspects for systems built in Service-Oriented architecture. As the prototype is implemented with GT4, the GT4 security mechanisms can be seamlessly applied to it. The security issues are mainly about who are allowed to access the visualization services, when they are allowed and what policy should be adopted.
which keeps the information about all available visualization services.
Other issues include the standardization of the data format passed between different types of visualization service, and automatic updating of the Pipeline Controller when new services are brought into the visualization service repository.
By addressing these issues in the future work, we aim to provide a Service-Oriented framework for dataflow visualization to support collaboration on a global scale: with visualization services distributed across different Grid networks, utilizating different human expertise around the world.
Acknowledgements
We thank all the other people involved in this work. Especially, thank Mr Lei Lei in Beihang University China who helped the deployment of services and simulations on the CROWN Grid. Also thanks to Mr Stuart Charters (University of Durham) for making available an early version of his PhD thesis; and to Mr John Hodrien (University of Leeds) for advice on GT4 matters. Thanks also to Dr James Handley (University of Leeds) for this help.
References
[1] R.B Haber and D.A McNabb Visualization Idioms: A Conceptual Model for Visualization Systems, in
Visualization in Scientific Computing. IEEE, pp 74-93, 1990.
[2] NAG Ltd Web Site. See: http://www.nag.co.uk
[3] Jeremy Walton: NAG’s IRIS Explorer. In
Visualization Handbook, pp 633-654, 2004, Academic Press. Available at:
http://www.nag.co.uk/IndustryArticles/ch32.pdf
[4] IBM Open Data Explorer Web Site. See
http://www.research.ibm.com/dx
[5] Jason Wood, Helen Wright, Ken Brodlie.
Collaborative Visualization. Proceedings of IEEE Visualization 97, pp 253-259, 1997, available at:
http://www.comp.leeds.ac.uk/vis/jason/vis97/vis97.html
[6] Jason Wood, Ken Brodlie and Helen Wright,
Visualization over the World Wide Web and its
application to environmental data. Proceedings of IEEE Visualization 1996 Conference, edited by R.Yagel and G.M. Nielson, pp 81--86, ACM Press. ISBN 0-89791-864-9
[7] S.M. Charters, N.S. Holliman and M. Munro.
Visualization on the Grid: a Web Service Approach. Proceedings of the UK e-Science All Hands Meeting 2004, pp 202-209.
[8] S.M. Charters. Virtualising Visualisation. PhD thesis, University of Durham, 2006.
[9] Ken Brodlie, Jason Wood, David Duce, Musbah Sagar. gViz: Visualization and Computational Steering on the Grid. Proceedings of the UK e-Science All Hands Meeting 2004, pp 54-60.
[10] CROWN Web site. See:
http://www.crown.org.cn/en/
[11] White Rose Grid Web site. See:
http://www.wrgrid.org.uk/
[12] OASIS Web Services Notification TC, 2006.
http://www.oasis-open.org/
committees/tc_home.php?wg_abbrev=wsn
[13] Publish-Subscribe Notification for Web services, 2006. http://www.ibm.com/developerworks/library/ws-pubsub/WS-PubSub.pdf