High speed multi-frequency impedance analysis of single particles in a
microfluidic cytometer using maximum length sequences
{
Tao Sun, David Holmes, Shady Gawad,
{
Nicolas G. Green and Hywel Morgan
*
Received 8th March 2007, Accepted 16th May 2007
First published as an Advance Article on the web 8th June 2007
DOI: 10.1039/b703546b
A novel impedance spectroscopy technique has been developed for high speed single biological particle analysis. A microfluidic cytometer is used to measure the impedance of single micrometre sized latex particles at high speed across a range of frequencies. The setup uses a technique based on maximum length sequence (MLS) analysis, where the time-dependent response of the system is measured in the time domain and transformed into the impulse response using fast M-sequence transform (FMT). Finally fast Fourier transform (FFT) is applied to the impulse response to give the transfer-function of the system in the frequency domain. It is demonstrated that the MLS technique can give multi-frequency (broad-band) measurement in a short time period (ms). The impedance spectra of polystyrene micro-beads are measured at 512 evenly distributed frequencies over a range from 976.5625 Hz to 500 kHz. The spectral information for each bead is obtained in approximately 1 ms. Good agreement is shown between the MLS data and both circuit simulations and conventional AC single frequency measurements.
1 Introduction
In recent years, a large number of microfluidic devices have been developed for characterisation, detection, manipulation and separation of biological particles using electrical,1–3 optical,4,5 magnetic6 and ultrasonic7 methods. One area of
particular interest is the use of electrical impedance spectro-scopy to measure the dielectric properties of single biological particles in microfluidic systems.1–3,8,9 Therefore, micro-impedance cytometry using micro-fluidic devices could poten-tially offer a novel high speed method for fast and label-free identification and analysis of cells and micro-sized particles.
Impedance spectroscopy is performed by applying a constant amplitude AC voltage to an unknown system. The impedance is determined by measuring the current flowing through the system using electronic circuitry. In micro-impedance cytometry (Fig. 1(a)), the micro-impedance of single particles is measured at high speed as they pass between microfabricated electrodes.1–3,9,10Each pair of top and bottom electrodes defines a measurement volume across the channel. Two pairs of electrodes are positioned close together allowing a differential measurement of the particle to be made. The excitation signal (fixed frequency AC voltage) is applied simultaneously to the two upper microelectrodes. The differ-ential signal from the two lower electrodes is obtained using custom-made detection circuitry. The electronic circuit first measures the particle passing through the first electrode pair, followed immediately by a second measurement as the particle passes through the second pair of electrodes.
The impedance signal depends on particle properties such as size and the intrinsic dielectric properties, which for a cell are dominated by the membrane capacitance and cytoplasmic resistance. The differential measurement system also measures particle speed and reduces measurement noise and instabilities from variations in temperature or composition of the fluid. Particles flow through and are dielectrophoretically focused into a stream along the central line of the channel using negative dielectrophoresis (nDEP) before entering the impe-dance measurement area. Fig. 1(b) shows a layout of the chip, including the DEP focusing area followed by the measurement electrodes. Four shielding electrodes are placed between the DEP and impedance measurement electrodes to screen the potential from the DEP electrodes. The electrodes at the exit of the measurement channel allow sorting of particles, again by dielectrophoresis, into different outlets.
Conventional impedance analysis is performed by sweeping an excitation signal over a range of frequencies.1–3,9,10 The disadvantage of this approach is that scanning the frequency can take several seconds, therefore high speed multi-frequency analysis of moving particles is not possible. One solution involves probing the sample with multi-frequencies simulta-neously, as reported by Fuller et al.11 These authors used discrete mixers, filters and direct digital signal synthesis circuits with mixed digital and analog application-specific integrated circuit (ASIC) to measure eight frequencies simultaneously. However, the system is complicated and requires a large amount of mixed-signal hardware.
In this paper, we describe a novel, fast and efficient technique for performing broad-band impedance spectroscopy of particles in a time window as short as 1 ms. This technique has significant advantages over traditional techniques and provides a new capability for impedance analysis of particles in a microfluidic format, which is called maximum length sequences (MLS) analysis and is based on obtaining the impulse response of the
Nanoscale Systems Integration Group, School of Electronics and Computer Science, University of Southampton, United Kingdom SO17 1BJ. E-mail: [email protected]; [email protected]
{Electronic supplementary information (ESI) available: Experimental method and supplementary Fig. 1. See DOI: 10.1039/b703546b {Present address: LMIS4-STI-EPFL, Swiss Federal Institute of Technology, 1015 Lausanne, Switzerland.
system; the same principle as used in pulse-FFT measurement.12 However, the latter method suffers from the disadvantage that the energy of the excitation signal is spread across a wide band of frequencies rather than concentrated at the specific measurement frequency.11Since a short duration pulse cannot deliver enough
energy into the system, the signal to noise ratio (SNR) of the pulse-FFT method is worse than the classical discrete frequency system. MLS is a pseudo-random binary sequence (PRBS) and exhibits a uniform power spectral density over a wide frequency band, similar to white noise. In this way, it is a deterministic repeatable signal, and therefore more energy is delivered to the system over the measurement period, compared to the short duration of a pulse in the pulse-FFT technique.
The MLS measurement technique has been used for a number of years in the field of audio engineering and architectural acoustics.13–25However, wider applications of this technique are
slowly being recognized. For example, Weckstro¨ met al.26used a white-noise-modulated current for the determination of the input impedance of non-spiking neurons. Schneider27proposed using MLS in a multi-frequency EIT-system for observation of long bone fracture healing and Amrani et al.28used MLS as interrogation signals for semi-conducting organic polymer gas sensors. More recently, Ruferet al.29used MLS to determine the mechanical and thermal behavior of MEMS structures. Xiang
et al.applied MLS to a laser Doppler vibrometer-based acoustic landmine detection technique30and to sonar systems.31
[image:2.595.88.513.55.497.2]To the best of our knowledge, the earliest application of MLS analysis to measure the impulse response of a linear time invariant (LTI) system was reported in 1966,13and the MLS theory is now well-established.18–22 We have developed the MLS technique for use in electrical impedance spectroscopy and applied it to the analysis of single biological particles flowing within a microfluidic cytometer, thus providing a new high speed analytical technique for characterising the dielectric properties of single particles. In this paper, we briefly explain the principles and characteristics of the MLS measurement technique, and analyse the system through the use of an equivalent circuit model for a homogeneous solid dielectric particle (i.e.bead) in suspension. Experimentally, we demon-strate that MLS can be used to measure the frequency dependent impedance spectrum for polystyrene beads, and demonstrate the substantial hardware cost savings for an MLS system by comparison to a conventional measurement system.
2 Theory
2.1 Maximum length sequences
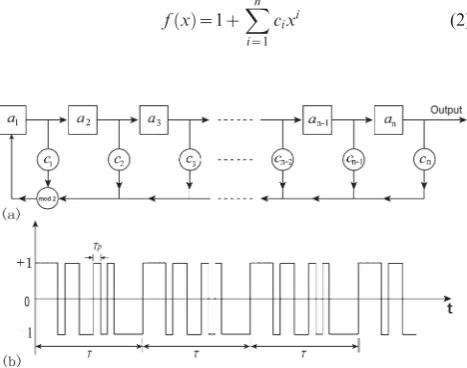
MLS comprises a sequence of ones and zeros and is generated recursively using a series of digital shift registers with feedback coefficients control (Fig. 2(a)). It conforms to the linear recurrence:
an~
Xn
i~1
ciai !
mod 2ð Þ (1)
In Fig. 2(a), the output digital signal comes from registeran
and the newly generated digital signal goes to registera1, which
is dependent on the states of all the registers and the feedback coefficients. At the same time, each element in every register shifts to the adjacent register on the right. Operation (mod 2) is taken to mean modulus 2 or exclusive-OR operation. The feedback coefficients ci are described by the primitive
polynomial:
f xð Þ~1zX n
i~1
cixi (2)
With all the shift-registers set to a given state (except all zeros), the n-stage registers will generate periodic sequences, with lengthL= 2n21 in one period. Here,Lis the length of one MLS withndenoting the order of the sequence and also the number of digital shift registers. This is the so-called maximum length sequence. In practical measurement, the 1 and 0 states are often mapped onto 21 and +1 levels, respectively, to produce a bipolar sequence which is symmetrical about zero. A typical bipolar MLS is shown in Fig. 2(b). The duration of every element in one MLS is represented by Tp and the whole period of one sequence is
given byT=L6Tp.
The MLS analysis technique is based on calculating the cross-correlation function between the input MLS signal and output response of a system. The cross-correlation function is determined by a convolution between the auto-correlation function of the MLS (which is the Dirac delta function with a small DC component) and the impulse response of the system.16 Since in practice the MLS system is AC coupled, the DC component can be ignored. This means that the cross-correlation function of the MLS signal with the output response of the system equals the impulse response of the system. Owing to the unique properties of MLS, the cross-correlation function can be efficiently calculated using a special algorithm—fast M-sequence transform (FMT),14which is based on the fast Hadamard transform (FHT), consisting of only additions and subtractions. For more details of the theory of MLS, see ref. 18–22.
From signal processing theory,32the impulse response of a system in the time domain is identical to the transfer-function of the system. Therefore, the transfer-function of the entire system can be obtained from the Fourier transform of the impulse response. In terms of single cell analysis, we have recently developed a theoretical model for MLS analysis of particles.33We have shown that with a sufficiently long MLS,
and a high sampling rate, the impedance spectrum of a system can be successfully characterized. To improve the computa-tional efficiency of the FFT, we performed a 2n-point FFT rather than (2n 21) points. The lowest measured frequency,
fmin, is determined by the order of the MLS and the sampling
rate, fs (eqn (3a)). This also gives the frequency resolution,
which is defined as the difference between two measured adjacent discrete frequencies. From Nyquist sampling theory,32the highest frequency,fmax, (eqn (3b)) is half of the
sampling rate:
fmin~
fs
2n (3a)
fmax~
fs
2 (3b)
Therefore, the number of measurement frequencies at one time can be up to 2n21
frequencies. The spectral information is collected in one sequence period. For example, if the sampling rate is 1 MHz and the MLS signal is 10th order, a full data set of 512 frequencies can be obtained in approximately 1 ms. Further details of the theoretical analysis can be found in ref. 33.
[image:3.595.48.282.500.684.2]2.2 Circuit model for a single bead in suspension
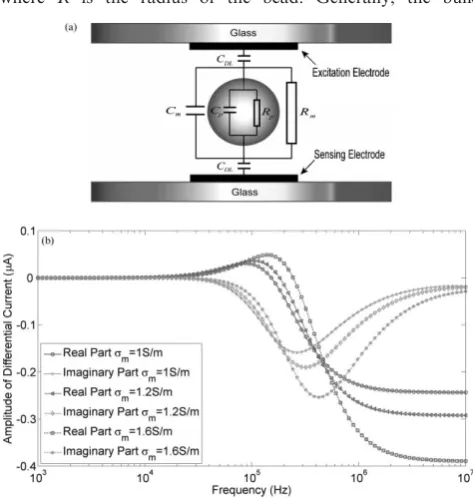
The electrical response of the suspending system can be analyzed using equivalent circuits. The electrical circuit for a single shelled cell in suspension has been reported by several authors.1–3,9,34Here, we derive the equivalent circuit model for a solid particle (bead) in suspension. A system with two parallel facing electrodes (Fig. 1) is represented by the circuit shown in Fig. 3(a). For a dilute (low volume fraction) suspension of particles, the dielectric properties of the system are well described by Maxwell’s mixture equation.35 The equivalent complex permittivity of the mixture is:
~eemix~~eem
1z2W ~eep{~eem ~eepz2~eem
1{W ~eep{~eem ~
eepz2~eem
(4)
wheree˜mixis the complex permittivity of the mixture andWis
the volume fraction (ratio of the particle volume to the detection volume).e˜pande˜mare the complex permittivities of
the particle and medium respectively. In general the complex permittivity of a material is given by:e˜=e2js/v, whereeis the permittivity,sthe conductivity,j2=21 andvthe angular frequency. The effective conductivity of the bead, sp, is the
sum of the bulk conductivity, spbulk and the conductivity
around the bead due to the surface conductanceKs:36
sp~spbulkz2
Ks
R (5)
where R is the radius of the bead. Generally, the bulk
conductivity of the bead is negligible and the effective conductivity is determined by the surface conductance and the size of the bead.
To obtain values for the individual electrical components, we applied Laplace and Fourier transforms37to eqn (4) giving:
~eemix~e?z
s0
jvz
De
1zjvt (6)
withe?~ A1
A2
em s0~
A5
A2
B De~A5 A2
1{B
ð Þt t~A2 A4
, where
e‘is the limiting high frequency permittivity,s0is the limiting low
frequency conductivity, De is the magnitude of the dielectric dispersion, andtis the relaxation time constant characterizing the Maxwell-Wagner interfacial polarization at the interface between the bead and suspending medium.
The relevant coefficients are given by:
A1~epz2emz2Wep{em A2~epz2em{Wep{em
A3~spz2smz2Wsp{sm A4~spz2sm{Wsp{sm
A5~A1smz A3{
A1A4
A2
em B~
A2A3
A4A5
sm
According to eqn (6), the values of the electric components in Fig. 3(a) are therefore:
Rm~
1
s0lk
(7a)
Cm=e‘lk (7b)
Rp~
t
Cp
(7c)
Cp=Delk (7d)
withk~K kð Þ
K0ð Þk k~tanh
pw
2h
wherekis the cell constant, solved using the Schwarz–Christoffel mapping method, to take into account the non-uniform field effect.2,9K(k) is the complete elliptic integral of the first kind,K9(k) is the complementary integral andk
is the modulus of the elliptic function.
Including the effect of the electrical double layer (DL), the complex impedance of the mixture (bead plus medium) becomes:
~
Z Zmix DL~
2
jvCDL
z RmRp
RmzRpzjvRmRp CmzCp
(8)
and the complex impedance of the system without the bead (W= 0) is:
~
Z Zmed DL~
2
jvCDL
z Rm
1zjvRmCm
(9)
According to eqn (8) and (9), the differential current signal from the electronic circuit,Idiffcan be calculated as:
Idiff~ ~
Z
Zmed DL{ZZ~mix DL ~
Z
Zmix DLZZ~med DL
V (10)
whereVis the applied voltage onto the system.
Fig. 3 (a) A representation of the equivalent circuit model for a single homogeneous particle in suspension between the electrodes.RmandRp
are the resistance of the medium and bead respectively;CmandCpare
the capacitance of the medium and bead respectively. The electrical double layer (DL) is modeled by the capacitor,CDL. (b) Variation in
[image:4.595.54.291.403.653.2]In a differential measurement scheme, the output voltage is proportional to the differential current. Eqn (10) can then be used to analyze variations in the output response of the system caused by changes in the properties of the bead, medium or chip geometry. Fig. 3(b) shows typical examples of the complex differential current variations for three different values of medium conductivity. Calculations were performed in MatlabTM (Mathworks Inc., USA) with the following parameters: eo = 8.854 6 10212 Fm21, em = 78 eo, ep =
2.55eo,Ks= 1.2 nS,R= 5mm andCDL= 60 pF with geometric
dimensions w = h = l = 20 mm. Eqn (10) also enables the optimal frequency for maximum sensitivity to be determined as shown by Fig. 3(b).
3 Experimental
3.1 Microfluidic cytometer chip
The microfluidic chips (shown in Fig. 1) were fabricated using photolithography and full wafer thermal bonding. The microfluidic channel was fabricated from a photosensitive polyimide precursor and had dimensions of 20 mm wide by 20 mm high in the impedance measurement section. The microelectrodes had width and gap of 20mm, were made by photolithography and consisted of a layer of titanium and platinum. Individual chips were released from the wafers by dicing with a diamond saw. Inlet and outlet holes were drilled in individual chips for fluid access. Full details of the chip microfabrication have been reported elsewhere.1,2,38
3.2 Measurement system setup
In order to evaluate the accuracy of the MLS system, the impedance spectra of single beads were measured using both the MLS and conventional single frequency AC methods.
Details of the AC single frequency measurement system and associated microfluidics can be found in the ESI{. The impedance measurement setup has been reported pre-viously.1,3,8,9Two AC excitation signals (one at low frequency,
e.g.0.5 MHz and one at high frequency, typically 2–5 MHz) are mixed and applied to the cytometer chip. The electrical current passing through the two detection volumes is converted into voltage signals by a trans-impedance amplifier. The two signals are measured and amplified in a differential circuit. Two lock-in amplifiers (SR844 Stanford Research Systems. Inc., USA) demodulate the in-phase and out-of-phase signals at each frequency, whilst rejecting noise at other frequencies. The output signals from the lock-in amplifiers are sampled with a 16 bit data acquisition card (NI6251, National Instruments Inc., USA). Data analysis is performed using software written in MATLABTM to extract the impedance information, such as the magnitude and phase.
The MLS measurement system is shown in Fig. 4, where the signal generators and lock-in amplifiers of a conventional system are replaced with the MLS signal, which is generated by custom-designed software and clocked at the same rate as the A/D sampling rate. After conversion of the digital MLS signal to an analogue voltage, the signal is applied to the electrodes. The same electronics measures the differential signal; the
output is low pass filtered, then sampled by an A/D converter. The filter, D/A and A/D converters are all integrated into a single data acquisition card (National Instruments NI 6251). Software is used to transform the sampled output response into the impulse response of the system with the fast M-sequence transform (FMT). The transfer-function of the system is obtained from the FFT and finally the impedance information determined.
The transfer-function of the MLS measurement system,
Hsys, is related to the impedance of the particle in suspension,
which can be expressed as:
Hsys~
Vout
VMLS
~ZZ~mix DL{ZZ~med DL
~
Z
Zmix DLZZ~med DL
RfHGHDAQ (11)
As shown in Fig. 4,VMLSis the MLS excitation signal.Vout
is the response of the system before the A/D conversion.Rfis
the resistance of the feedback resistor in the current-to-voltage (I–V) converter and HG is the transfer-function of the
amplifier. HDAQ is the transfer-function of the NI 6251
DAQ, which is dominated by the characteristics of the anti-aliasing low pass filter.
3.3 Particle preparation and focusing
Carboxy-polystyrene beads of 5.49 and 7.18 mm diameter (Bangs Laboratories Inc., USA) were obtained from Molecular Probes. Prior to use, they were sonicated to separate clumped particles and suspended in phosphate buffered saline (PBS), conductivity 1.6 Sm21
.
In order to minimise fluctuations in the position of the particles within the sensing regions, the beads were dielec-trophoretically focused prior to passing through the impedance detection area. The voltage used for DEP focusing was 5 Vpp at 8 MHz, anti-phase to diagonally opposite electrodes.38,39
4 Results and discussion
4.1 Data analysis
Samples of the two sizes of beads were prepared and mixed in PBS (phosphate buffered saline) at a ratio of approximately
[image:5.595.311.542.54.213.2]10 : 1 (5.49 : 7.18mm). Measurements were performed using a 10th order MLS with the sampling rate limited to 1 MHz by the data acquisition card. Therefore, from eqn (3a) and (3b), the lowest frequency is 976.5625 Hz and the upper frequency limit is 500 kHz. The complex transfer-function spectrum of the system is characterized within every discrete time interval. The time interval for each spectrum is the period of an individual sequence, which in this work is approximately 1 ms. Therefore, the MLS technique allows identification of the transfer-function of the system in both time and frequency domain.
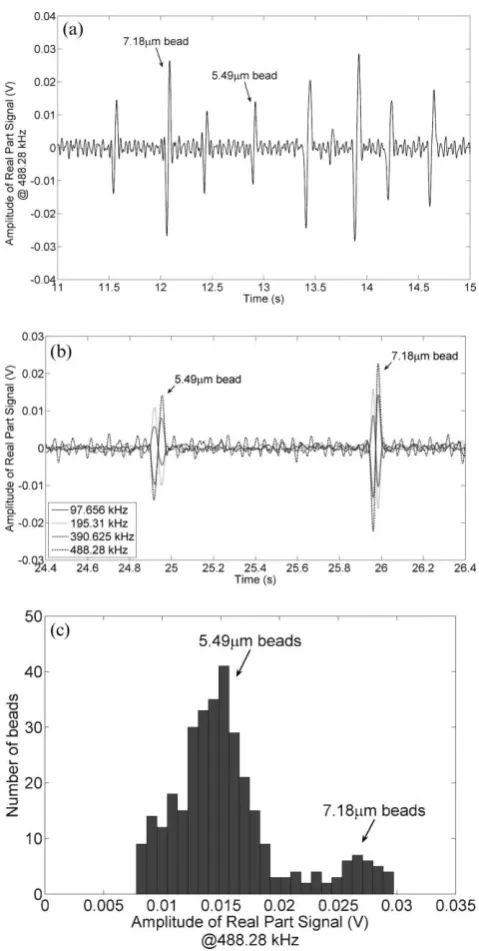
Because the particle is moving, the system is not time-invariant. Therefore, to calculate the impedance of a particle, the time instant at which the particle resides in the detection zone must be established. The impedance data of the beads are extracted from the peak values of the time-varying transfer-function—see Fig. 5(a). This figure shows the real part of the transfer-function over a four second period, for one discrete frequency (488.28 kHz), showing the difference in the signal amplitude for different sizes of beads. Each pair of peaks (one positive and one negative) corresponds to the passage of a single bead through the detection volume. The data plotted in the figure was processed using a Savitzky–Golay (S–G) finite impulse response smoothing filter, which reduces the back-ground noise. Baseline drift was removed by subtracting the averaged background noise level.
Fig. 5(b) shows a typical impedance signal for two sizes of beads, in this case plotted for four discrete frequencies: 97.656 kHz, 195.31 kHz, 390.625 kHz and 488.28 kHz. The figure demonstrates how MLS measures the impedance of every bead at many different frequencies at the same time. For 10th order MLS, all 512 individual frequencies are obtained in a single measurement time of approximately 1 ms. Fig. 5(c) shows a histogram, where the number of beads is plotted against the real part of the impedance measured at 488.28 kHz. It shows two discrete populations, with distributions in the sizes of the two populations. The spread in the data is partly due to drift in the position and velocity of the particle passing through the detection area as well as an inherent distribution in particle size (coefficient of variance, CV = 5%).
4.2 Data validation
In order to validate the impedance spectra of the beads, the MLS measurement results for 5.49mm beads were compared with PSpice circuit simulation (OrCAD Capture CIS, Cadence Design Systems, Inc., USA) and also experimental results obtained using a single frequency AC measurement system. The circuit simulations were performed using the equivalent circuit model with identical dielectric parameters for the medium and a single 5.49mm bead as shown in section 2.2 (Fig. 3(a)). The PSpice models for the active elements (operational amplifiers, etc.) were obtained from the manu-facturers. As discussed previously, MLS measures the entire transfer-function of the system, and the characteristic of the low pass filter in the A/D card must be considered in the analysis. The transfer-function of the filter was measured by connecting the D/A and A/D ports together with a coaxial cable.40 For AC single frequency measurement, the
demodulated in-phase and out-of-phase signals from the lock-in amplifier correspond to the real and imaglock-inary part of the complex impedance signal, respectively. Fig. 6 shows the MLS data, the single frequency data and the PSpice simulation results for 5.49 mm beads. The MLS measurement provides 512 discrete frequency points obtained in approximately 1 ms. The AC single frequency measurement data for ten different frequencies was measured over several minutes and is the average signal for 200 beads at every frequency. The figure
[image:6.595.310.550.53.529.2]shows good agreement for all three methods, indicating that the MLS system correctly measures the impedance spectrum for a single particle.
5 Conclusion
The maximum length sequence measurement technique has been used to characterize the impedance spectrum of single micro-particles flowing through a microfluidic cytometer. The MLS technique measures the impedance across a range of frequencies using a pseudorandom noise as the excitation signal. Compared with standard single frequency (or swept) AC measurements, the hardware costs are substantially less, because no signal generator and lock-in amplifier are required. This simplifies the architecture and enables miniaturization of the entire measurement system. We have theoretically demon-strated the principles of the MLS technique for measuring the impedance spectrum of single particles in suspension. Experimentally, we have shown that the system is able to measure impedance variations from small polystyrene particles and differentiate them by size. The MLS method gives the impedance spectrum of an individual particle in a short time period with high frequency resolution.
The MLS measurement system described in this paper is still in development. The major limitation is the upper frequency limit of 500 kHz, which is limited by the sampling rate of the data acquisition card. Within this frequency range, the measured impedance signal can only provide information on the size of particles because the low-frequency sensitivity is limited by the double layer. Much more information on the properties of particles is available if the measurement spectrum could be extended to higher frequencies.
Acknowledgements
The work is partly supported by the funding from Life Science Initiative, University of Southampton. Dr Gawad would like to acknowledge the funding from the SNSF fellowship.
References
1 S. Gawad, L. Schild and Ph. Renaud,Lab Chip, 2001,1, 76–82. 2 S. Gawad, K. Cheung, U. Seger, A. Bertsch and Ph. Renaud,Lab
Chip, 2004,4, 241–251.
3 K. Cheung, S. Gawad and Ph. Renaud,Cytometry Part A, 2005,
65A, 124–132.
4 B. Yao, G. A. Luo, X. Feng, W. Wang, L. X. Chen and Y. M. Wang,Lab Chip, 2004,4, 603–607.
5 D. Holmes, H. Morgan and N. G. Green,Biosens. Bioelectron., 2006,21, 1621–1630.
6 N. Pamme,Lab Chip, 2006,6, 24–38.
7 M. Wiklund and H. M. Hertz,Lab Chip, 2006,6, 1279–1292. 8 H. Morgan, D. Holmes and N. G. Green,Curr. Appl. Phys., 2006,
6, 367–370.
9 H. Morgan, T. Sun, D. Holmes, S. Gawad and N. G. Green,
J. Phys. D: Appl. Phys., 2007,40, 61–70.
10 S. Gawad,Ph.D thesis, Lausanne EPFL, Switzerland, 2004. 11 C. K. Fuller, J. Hamilton, H. Ackler, P. Krulevitch, B. Boser,
A. Eldredge, F. Becker, J. Yang and P. Gascoyne, Proc.mTAS 2000, 2000, 265–268.
12 Y. Liu, W. Abel, J. Janette, F. Belch, R. J. Tweedie,US Pat., 5 691 633, 1997.
13 W. D. T. Davies,Control, 1966, 302–304.
14 M. Cohn and A. Lempel,IEEE. Trans. Inf. Theory, 1977, 135–137. 15 M. R. Schroeder,J. Acoust. Soc. Am., 1979,66, 497–500. 16 J. Borish and J. B. Angell,J. Audio Eng. Soc., 1983,31, 478–488. 17 Y. Ando, Concert Hall Acoustics, Springer, New York, 1985,
pp. 103–109.
18 J. Borish,JAES, 1985,33, 888–891.
19 D. D. Rife and J. Vanderkooy, J. Audio Eng. Soc., 1989, 37, 419–444.
20 N. Xiang,Signal Process., 1992,28, 139–152. 21 J. Vanderkooy,J. Audio Eng. Soc., 1994,42, 219–231. 22 M. Vorlander and M. Kob,Appl. Acoust., 1997,52, 239–258. 23 D. G. Ciric,TELSIKS’99, 1999, 653–656.
24 N. Xiang and M. R. Schroeder,J. Acoust. Soc. Am., 2003,113, 2754–2761.
25 N. Xiang, J. N. Daigle and M. Kleiner,J. Acoust. Soc. Am., 2005,
117, 1889–1894.
26 M. Weckstro¨m, E. Kouvalainen and M. Juusola,Pfu¨gers Arch., 1992,421, 469–472.
27 I. Schneider, Proc. 18th Annu. Int. Conf. IEEE EMBS, 1996, 1934–1935.
28 M. E. H. Amrani, R. M. Dowdeswell, P. A. Payne and K. C. Persaud,Sens. Actuators, B, 1998,47, 118–124.
29 L. Rufer, S. Mir, E. Simeu and C. Domingues,Des. Test Integr. Packag. of MEMS/MOEMS, 2003, 50–55.
30 N. Xiang and J. M. Sabatier,IEEE Geosci. Remote Sens. Lett., 2004,1, 292–294.
31 N. Xiang and D. Z. Chu,Proc. ICSP, 2004, 2433–2436. 32 A. V. Oppenheim, A. S. Willsky and I. T. Young, Signal and
Systems, Prentice-Hall International, Inc., London, 1983. 33 T. Sun, S. Gawad, N. G. Green and H. Morgan, Meas. Sci.
Technol., submitted.
34 K. R. Foster and H. P. Schwan,Crit. Rev. Biomed. Eng., 1989,17, 25–104.
35 J. C. Maxwell, A Treatise on Electricity and Magnetism, Dover Press, New York, 1954.
36 M. P. Hughes and H. Morgan,Anal. Chem., 1999,71, 3441–3445. 37 T. Sun, S. Gawad, N. G. Green and H. Morgan,J. Phys. D: Appl.
Phys., 2007,40, 1–8.
38 D. Holmes, J. K. She, P. L. Roach and H. Morgan,Lab Chip, 2007, DOI: 10.1039/b707507n.
39 D. Holmes, M. E. Sandison, N. G. Green and H. Morgan,IEE Proc. Nanobiotechnol., 2005,152, 129–135.
40 S. Gawad, T. Sun, N. G. Green and H. Morgan,Rev. Sci. Instrum., 2007,78, DOI: 10.1063/1.2737751.
[image:7.595.45.284.55.200.2]