Delineation of Management Zones using Multiple Crop Yield
Data
Badri Basnet12, Rob Kelly2, Troy Jensen2, Wayne Strong2, Armando Apan2, and David Butler2
1
Currently at The University of Queensland Gatton, E-Mail: [email protected] 2 Department of Primary Industries, Toowoomba, Queensland 3 The University of Southern Queensland, Queensland
Abstract: Most agricultural fields naturally have within-field variations that may require site-specific attention for optimum crop performance. These variations are often contiguous, extensive and not easy to manage since every spot in a paddock is unique. Delineating a paddock into a few ‘management zones’ is therefore a practical management approach. In this study, yield maps of various crops and seasons were used to delineate ‘management zones’. Map standardisation and the application of geographic information systems (GIS) were necessary to combine various yield maps for ‘management zones’ delineation. A user-defined fuzzy set membership function was employed to standardise yield maps. The membership function used control points derived from the percentile calculation to rescale yield data continuously between 0 and 1. Map standardization and processing was performed within Idrisi-32 GIS and image processing software program. Standardised maps were combined within raster GIS to identify areas of low, medium and high yield performances. The classified areas were identified as ‘management zones’ requiring different level of management attention. It was found that the continuous rescaling of yield data, using percentile based control points, was suitable to standardise yield maps. This process derived control points from within the yield data and minimized the influences of extreme yield values. Overlaying standardised yield maps to identify areas of low, medium and high yield potential was a straightforward process within GIS. The investigation revealed that most area performed moderately and the areas requiring highest management attention were around the periphery of the investigated paddock.
INTRODUCTION
Variations in crop yield are common in agricultural fields. These variations could be due to ground-, climate- and input-related factors and their interactions (Yang et al., 1998). Crop yield is the cumulative effect of all such variations. Considering crop as the sensor of its own environment (Legg and Stafford, 1998), the crop yield data could be used to understand the field variations and manage it in a site-specific manner. However, some of the yield influencing factors such as input and climate vary significantly from season to season. Consequently, crop yield in a field could be quite different from year to year even if the crop is same (Plant, 2001). Therefore, the yield of one season is not a reliable indicator of the field variations.
The yield and field variations are extensive and contiguous, and the discrete quantification of variations is not easy. On the other hand, the knowledge of widespread and adjoining field variations is not going to make it easy to manage it in a site-specific manner since every part of a paddock could be different. Therefore, the concept of a ‘management zone’ is important. A ‘management zone’ is defined as a portion of a field that expresses homogeneous combinations of yield-limiting factors (Doerge, 1998). Site-specific applications of agricultural inputs can be implemented by dividing a field into ‘management zones’ (Zhang et al., 2002).
International Soil Tillage Research Organisation Conference
70
management practices. The number and size of management zones within a field could vary since it is a function of the natural variability within the field, the size of the field and the ability of the farmer to differentially manage regions within a field (Zhang et al., 2002).
However, combining yield maps of various crops and seasons require making them commensurable by bringing to a common numeric range. This process is known as map standardisation. In GIS, map standardisation can be achieved using discrete (ie. Boolean) or continuous (ie. fuzzy set) classification methods (Burrough, 1996). The use of strict Boolean true/false logic is often too rigid for the continuous nature of the variation (Burrough, 1989) such as yield data. Therefore, the Boolean classification method is less appropriate since it tends to generalise yield data prior to the analysis. The fuzzy membership function, on the other hand, defines the possibility of membership that varies continuously from 0 (for completely outside the set) to 1 (for the full membership) range (Burrough et al., 1992). Due to the continuous nature of the yield data, it could be appropriately rescaled between 0 and 1 using the fuzzy membership function.
The continuous rescaling of data can be achieved using a simple linear, sigmoidal or a J-shaped membership function (Eastman, 1999). However, the crop yield data, which is often skewed and have extreme values, do not seem to follow any of those pre-defined functions. Therefore, there is a need to develop an appropriate crop yield data standardisation technique. The IDRISI-32 software has the provision to user-define a rescaling function based on the use of control points (Eastman, 1999). The control points could be derived from the crop yield data in a number of ways. However, in determining control points, the interest is to identify a specific value and the percentage of the data lying below and above this value. Such specific values could be conveniently determined using fractiles calculation that divides data into percentile (ie 100 parts) or some other convenient division such as quartiles and deciles (Blank, 1982).
Once standardised, the yield maps of various crops and seasons can be combined to a single layer using spatial addition and averaging techniques. The combined map layer can then be reclassified into potentially high, medium and low performing areas to correspond to ‘management zones’ requiring low, medium and high attention, respectively. Therefore, the main objective of this study was to process yield data of several crops and seasons to spatially delineate ‘management zones’ for site-specific management. While the spatial processing of yield data is preconditioned to map standardisation and overlay analysis, the fundamental objective of the study was to develop a yield map standardisation technique.
MATERIALS AND METHODS
Study area
This study was conducted at the Kielli-2 paddock (Figure 1) near Jimbour (approx. 151°10’E and 27°00’S) in southern Queensland. The Kielli-2 paddock is about 40.5 ha in area and it is about 1555 m long and 260 m wide. The landscape is relatively flat located on a heavy-clay Vertisol.
Yield measurement
Figure 1. Site-specific yield data for barley (1998) and sorghum (1999-2001) at Kielli-2, Jimbour
Data pre -processing
International Soil Tillage Research Organisation Conference
72
Data rescaling
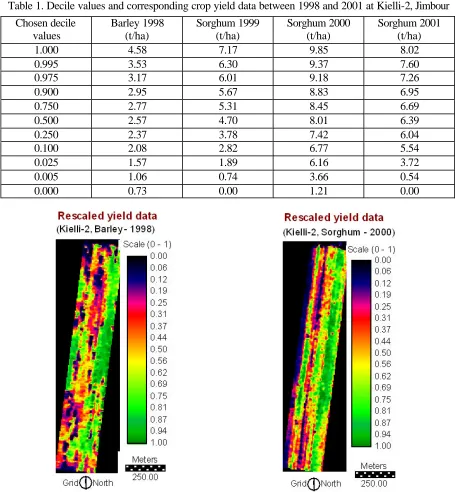
[image:4.596.70.525.187.679.2]Kriged output data was imported into the JMP statistic al program (SAS Institute Inc, 1995) to calculate deciles for 100, 99.5, 97.5, 90.0, 75.0, 50.0, 25.0, 10.0, 2.5, 0.05 and 0.0 percents. Deciles divided the set of data into ten equal parts. Decile values and corresponding yield data for each crop are shown in Table 1. Yield data and corresponding decile values were entered as control points within IDRISI-based fuzzy set decision support module to continuously rescale yield data between 0 and 1 (Figure 2). The user-defined method of continuous rescaling was chosen.
Table 1. Decile values and corresponding crop yield data between 1998 and 2001 at Kielli-2, Jimbour Chosen decile
values
Barley 1998 (t/ha)
Sorghum 1999 (t/ha)
Sorghum 2000 (t/ha)
Sorghum 2001 (t/ha)
1.000 4.58 7.17 9.85 8.02
0.995 3.53 6.30 9.37 7.60
0.975 3.17 6.01 9.18 7.26
0.900 2.95 5.67 8.83 6.95
0.750 2.77 5.31 8.45 6.69
0.500 2.57 4.70 8.01 6.39
0.250 2.37 3.78 7.42 6.04
0.100 2.08 2.82 6.77 5.54
0.025 1.57 1.89 6.16 3.72
0.005 1.06 0.74 3.66 0.54
0.000 0.73 0.00 1.21 0.00
Figure 2. Rescaled yield maps for barley (1998) and sorghum (2000) crops at Kielli-2, Jimbour
GIS Analyses
was then classified into three (low, medium and high) classes. Classification was based on equal interval method in which each class has an equal range of values or the difference between high and low values is the same for each class (Mitchell 1999). For example, all the cells with cell-values ranging from 0 to 0.33 were classified as ‘low’ class. Each class was considered as a separate zone for site-specific management.
RESULTS AND DISCUSSIONS
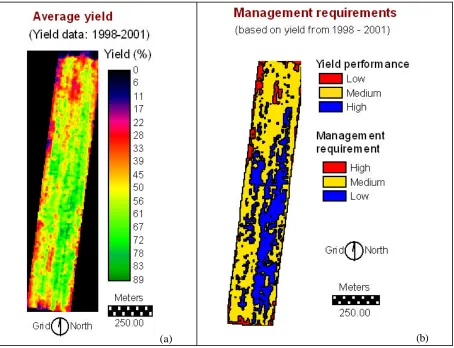
It was established that user-defining a membership function, using decile -based control points, was useful to rescale yield data continuously between 0 and 1. This method of standardization is coherent because the decile calculation produced adequate statistically comprehensible control points from within the dataset to use in the user-defined function. Defining a new membership function was necessary because there was not any suitable pre-existing membership function for continuous classification of yield data. Discrete classification of yield data was not considered as an option since this method ignored partial class membership (Fridgen et al., 2000). Better rescaling accuracy would have been possible through the use of percentiles (ie. 100 values) rather than deciles (ie. 10 values) as control points since the membership between any two adjacent control points is linearly interpolated (Eastman, 1999). However, ten data points were considered adequate at this initial stage of the work. Combining standardized yield data of several crops and seasons (ie. 1998 to 2001) produced an average yield map (Figure 3a). The classification of average yield map into three classes (Figure 3b), based on equal data interval method, revealed that the area of low, medium and high yield performance were 4.2 ha, 24.7ha, and 11.6 ha respectively. It was also revealed that the edges of the paddock were performing inadequately (Figure 3b).
(a) (b)
[image:5.596.72.526.385.733.2]International Soil Tillage Research Organisation Conference
74
The purpose of the above classification was to discriminate paddock on the basis of cumulative yield performances and to identify management zones. Hence, each class represented a separate management zone. A class with low yield performance logically required higher management attention as compared to another class with higher yield performance. Thus, low, medium and high classes represented management zones requiring high, medium and low attention, respectively (Figure 3b). The delineation of management zones could be based on factors such as soil and field characteristics (Fridgen et al., 2000), digital elevation model (Pilesjo et al., 2000) and yield maps (Stafford et al., 1999). Considering crop yield as the desirable end product of the plant production process and the level of yield as the cumulative effect of all yield-influencing factors, it seems logical to use yield maps as the basis to delineate management zones.
Three management zones were considered appropriate for the Kielli-2 paddock that has an overall area of 40 ha. The exact number of management zones may however vary from year to year depending on factors such as weather and crop conditions (Fridegen et al., 2000).
Low yield performance around the edges of the Kielli-2 paddock is prominent. This could be related to the presence of compaction zones as machinery turn between runs. Alternatively, this may be an artefact of the yield delay implicit in the creation of yield maps. In this study, most area (ie 24.7 ha or 61%) performed moderately and required medium level of management attention. However, the exact area requiring moderate level of management attention may vary depending on the method of classification. The result presented in this study is based on equal interval method of classification. If equal area method were applied, the area falling under each zone would be one-third of the total.
CONCLUSIONS
This study combined yield data of various crops and seasons within a GIS framework to delineate ‘management zones’. Combining several yield maps and classifying the output into the areas of low, medium and high yield performances enabled the identification of management zones. Yield map standardization is essential to combine multiple yield data within a GIS framework. In this study, a new yield map standardization method that incorporated a number of statistically derived control points in a user-defined fuzzy membership function was developed. Delineation of management zone is a preliminary work in this area because it does not field validated the management zones nor it links with actual management practices. Therefore, the future works will directed towards these objectives.
Acknowledgements
The authors are grateful to the Queensland Department of Primary Industries and Grain Research and Development Corporation for providing financial support to this study. Yield data was kindly provided by Jamie Grant (Jimbour) through Bill Town (Wesfarmers Landmark).
References
Blank, L., Statistical Procedure for Engineering, Management and Science, International Student Edition, McGraw Hill International Book Company, 33pp., Japan, 1982.
Burrough, P.A., Fuzzy Mathematical Methods for Soil Survey and Land Evaluation, Journal of Soil Science, 40, 477 - 492, 1989.
Burrough, P.A., Natural Objects with Intermediate Boundaries: Geographic Objects with Intermediate Boundaries, EDs: P.A. Burrough and A.U. Frank, Taylor and Francis Publishers, London, 1996. Burrough, P.A., R.A. MacMillan, and W. van Deursen., Fuzzy Classification Methods for
Determining Land Suitability from Soil Profile Observations and Topography, Journal of Soil Science, 43, 193 – 210, 1992.
Doerge, T., Defining Management Zones For Precision Farming, Crop Insights, 8, 21, 1998.
Fridgen, J.J., C.W. Fraisse, N.R. Kitchen, and K.A. Sudduth, Delineation and Analysis of Site-specific Management Zones, Second International Conference on Geo-spatial Information in Agriculture and Forestry, Florida, January 10-12, 2000.
Legg, B.J., and J.V. Stafford, Precision Agriculture – New Technologies, Proceedings of the Brighton Crop Protection Conference, 1998.
Minasny, B., A.B. McBratney, and B.M. Whelan, VESPER by Australian Centre for Precision Agriculture, The University of Sydney, (http://www.usyd.edu.au/su/agric/acpa), Version 1, 1999. Mitchell, A., The ESRI Guide to GIS Analysis, Volume 1: Geographic Patterns and Relationships,
Environmental Systems Research Institute Inc, ESRI Press, 37 – 67 pp., NY, 1999.
Plant, R.E., Site-Specific Management: The Application Of Information Technology to Crop Production, Computers and Electronics in Agriculture, 30, 9 – 29, 2001.
Pilesjo, P., L. Thylen, A. Persson, Digital Elevation Models for Delineation of Agricultural Management Zones, Second International Conference on Geo-spatial Information in Agriculture and Forestry, Florida, January 10-12, 2000.
SAS Institute Inc., Statistical Discovery Software – JMP Statistics and Graphics, Copyright 1995 by SAS Institute Inc., NC, 1995.
Stafford, J.V., R.M. Lark, H.C. Bolam, Using Yield Maps to Recognise Fields into Potential Management Units, Proceedings of the Fourth International Conference on Precision Agriculture, American Society of Agronomy, Madison. 1999.
Yang, C., C.L. Peterson, G.J. Shropshire, and T. Otawa, Spatial Variability of Field Topography and Wheat Yield in the Palouse Region of the Pacific Northwest, Transactions of the ASAE, 41, 17 – 27, 1998.
Zhang, N., M. Wang, and N. Wang, Precision Agriculture – a Worldwide Overview, Computers and Electronics in Agriculture, 36, 113 – 132, 2002.