rsif.royalsocietypublishing.org
Research
Cite this article:
Stro¨mbom D, Mann RP,
Wilson AM, Hailes S, Morton AJ, Sumpter DJT,
King AJ. 2014 Solving the shepherding
problem: heuristics for herding autonomous,
interacting agents.
J. R. Soc. Interface
11:
20140719.
http://dx.doi.org/10.1098/rsif.2014.0719
Received: 3 July 2014
Accepted: 1 August 2014
Subject Areas:
biocomplexity
Keywords:
collective motion, agent-based model,
sheep, sheepdog
Author for correspondence:
Daniel Stro¨mbom
e-mail: [email protected]
Electronic supplementary material is available
at http://dx.doi.org/10.1098/rsif.2014.0719 or
via http://rsif.royalsocietypublishing.org.
Solving the shepherding problem:
heuristics for herding autonomous,
interacting agents
Daniel Stro¨mbom
1, Richard P. Mann
1, Alan M. Wilson
2, Stephen Hailes
3,
A. Jennifer Morton
4, David J. T. Sumpter
1and Andrew J. King
51Department of Mathematics, Uppsala University, Uppsala 75106, Sweden
2Structure and Motion Laboratory, The Royal Veterinary College, University of London, Hatfield,
Hertfordshire AL9 7TA, UK
3Department of Computer Science, University College of London, Gower Street, London WC1E 6BT, UK 4Department of Physiology, Development and Neuroscience, University of Cambridge, Downing Street,
Cambridge CB2 3DY, UK
5Department of Biosciences, College of Science, Swansea University, Swansea SA2 8PP, UK
Herding of sheep by dogs is a powerful example of one individual causing many unwilling individuals to move in the same direction. Similar phenomena are central to crowd control, cleaning the environment and other engineering problems. Despite single dogs solving this ‘shepherding problem’ every day, it remains unknown which algorithm they employ or whether a general algor-ithm exists for shepherding. Here, we demonstrate such an algoralgor-ithm, based on adaptive switching between collecting the agents when they are too dispersed and driving them once they are aggregated. Our algorithm reproduces key fea-tures of empirical data collected from sheep–dog interactions and suggests new ways in which robots can be designed to influence movements of living and artificial agents.
1. Introduction
Determining how social organisms form and maintain swarm-like behaviour is a major scientific challenge that has been taken up by biologists, physicists, math-ematicians and engineers [1–4]. Some of the most striking examples of this collective behaviour occur in the presence of threat; when flocks, shoals and herds aggregate and evade their predators [1]. A sheep flock’s response to a herd-ing dog is a classic example of what Hamilton [5] called the selfish herd theory, which posits that aggregations result from individual efforts to reduce their own predation risk by moving towards the centre of a group. Recent empirical evidence supports this sheep anecdote, showing that sheep show a strong attrac-tion towards the centre of their flock with the approach of a sheepdog [6]. However, the fact that the flock tightens does not tell us how the dog is able to manoeuvre this aggregation and herd the flock towards a specific destination.
Many attempts have been made to gain an understanding of how a single agent can gather and herd a group of other agents [7–16]. With such knowledge comes numerous applications, for example in crowd control [17,18], cleaning up the environment [19], herding of livestock [20], keeping animals away from sen-sitive areas [21] and collecting/guiding groups of exploring robots [22]. Most research has adopted a theoretical approach, and sought to model the interaction of the agents based on attraction, repulsion and alignment models that are common in studies of collective animal behaviour [2,4,23–27]. One agent, the ‘shepherd’, is then given a different set of rules from the rest of the flock, which are repelled by the shepherd. In one class of models, the shepherd’s rules pre-scribe a side-to-side movement behind the group while herding it towards the target [7,28]. Such algorithms are appropriate for herding small groups (see
[16] for a review), but herding of larger groups (more than 40 individuals) typically requires multiple shepherds [28]. However, single sheep dogs can successfully herd flocks of 80 or more sheep both in their everyday work and in competi-tive herding trials [29,30]. So, what are the sheepdogs doing that the agent shepherds (or the flocking agents) are not?
Here, we propose a self-propelled particle model of local attraction–repulsion type to model herding of a group of interacting agents by one shepherd towards a predetermined destination. We begin by investigating how the success of the general algorithm depends on both group size and the degree of locality in the agent interactions. Then we focus on the shepherd dynamics that result from the application of the algorithm. Finally, we compare the model against empirical data obtained from real-life herding experiments with an Australian sheepdog and merino sheep [6].
2. Results
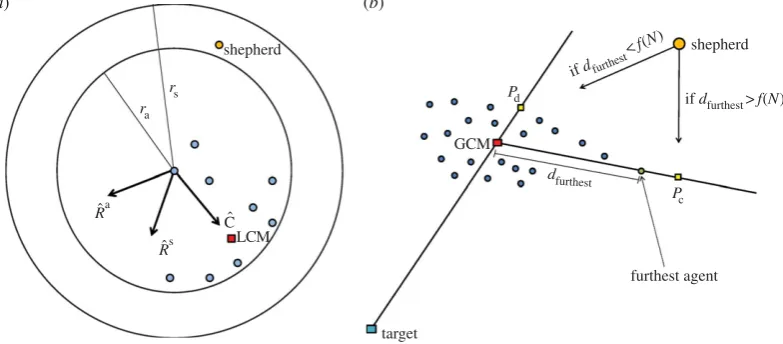
The key features of our model are summarized below. A detailed account may be found in the Model and methods. Initially,Nflocking agents are released at random positions in the upper right quarter of anLLsquare field and a shep-herd released outside this quarter. Each agent aims to stay away from the shepherd while remaining close to itsnnearest neighbours. This behaviour of being attracted to nearby neighbours and repelled from potential threats is typical for sheep and many other herding animals [5]. Figure 1a illus-trates the rules governing the agents. If an agent is further away than rs from the shepherd, it remains stationary, except for occasional random movements. Regardless of dis-tance to the shepherd, agents are repelled from other agents at very short distances of less thanraand the unit vectorR^
a
indicates the direction of this local repulsion. If an agent is within a distancersfrom the shepherd, the agent is attracted to the local centre of mass (LCM) of itsnnearest neighbours, in the direction of the unit vector C^, and at the same time repelled directly away from the shepherd in the direction
ofR^s. The new heading of the agentH0is then a linear com-bination of these three vectors weighted by corresponding model parametersra,c, rs plus a weak inertia termdH^ and a small noise termee. H0 is then normalized and the agent moves a distance ofdin this direction. As only the direction, not the length, ofH0is important each weight gives the rela-tive strength of the corresponding term. For example,rais the relative strength of repulsion from other agents,cis the rela-tive strength of attraction to other agents andrsis the relative strength of repulsion from the shepherd.
The shepherd’s task is to collect and drive all agents down to the lower left corner of the field. In order to solve this task, we propose the following algorithm. If the shepherd is within 3rafrom any flocking agent, it does not move in this time step. Otherwise, the shepherd does one of two things depending on the position of the agents (figure 1b). If all agents are within a distancef(N) from their global centre of mass (GCM), then the shepherd aims towards the driving positionPddirectly behind the flock relative to the target. We label this behaviour as ‘driving’. If at least one agent is further away thanf(N) from the GCM, then the shepherd aims instead for the collecting positionPcdirectly behind this furthest away agent. We call this behaviour ‘collecting’. When collecting or driving the shepherd moves a distance ofds.
Typical simulation results are shown in figure 2 and in the electronic supplementary material, video 1. Owing to agents being randomly placed at the upper right-hand quadrant of the LL field, the shepherd tends to initially collect the agents until they are cohesive, at which point it starts to drive the group. Once the agents are mobile, the shepherd switches between driving and collecting modes until the task is completed and the agents are delivered to the target location in the lower left corner of the field. Visualizing the trajectories of the shepherd and agents throughout the simu-lations, we observe a side-to-side motion of the shepherd behind the agents (figure 2). This motion is not explicitly coded in our shepherd’s behaviours. Instead, it emerges as a consequence of the shepherd switching between driving and collecting.
if dfurthest>f(N)
if dfurthest
<f(N)
shepherd
GCM
target
furthest agent shepherd
LCM
Cˆ
ra
rs P
d
Pc dfurthest
Rˆs Rˆa
[image:2.595.105.497.46.218.2](b) (a)
Figure 1.
Interaction rules for the agents and the shepherd. (
a
) The agents are attracted to the LCM of their
n
nearest neighbours (
^
C
), repelled from other agents
within a distance of
r
a(
^
R
a
) and repelled from the shepherd if it is within a distance of
r
s(
^
R
s
). The new heading of the focal agent
H
0is a linear combination of the
three vectors
^
C
,
^
R
aand
^
R
s, weighted by the corresponding model parameters
c
,
ra
,
rs
, plus a small inertia term
d
^
H
and a small noise term
e
e. (
b
) In each time
step, the shepherd does one out of three things depending on the position of the agents. If the shepherd is within 3
r
afrom any agent, its speed is set to zero.
Otherwise, if all agents are within a distance
f
(
N
) from the GCM of the agents, then the shepherd aims towards the driving position
P
ddirectly behind the flock
relative to the target. Finally, if at least one sheep is further away than
f
(
N
) from the GCM, then the shepherd aims for the collecting position
P
cdirectly behind the
furthest away sheep relative to the GCM. (Online version in colour.)
rsif.r
oy
alsocietypublishing.org
J.
R.
Soc.
Interfa
ce
11
:
20140719
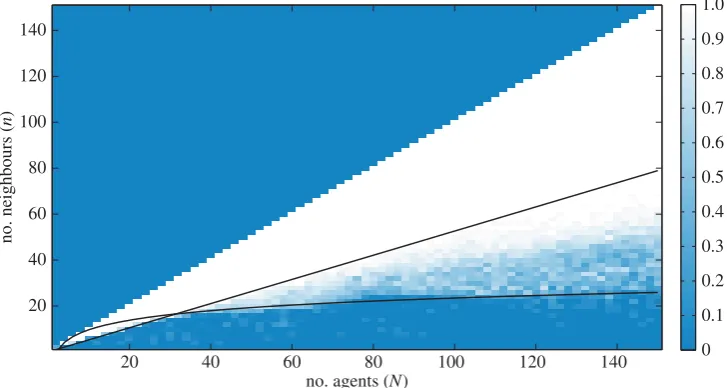
To evaluate the performance of the shepherding algorithm, we investigate how often it completes the task successfully within 8000 time steps for groups ofN[[2, 150] agents. In particular, we explore how the number of nearest neighbours
n[[1,N1] affects the performance of the algorithm. Figure 3 shows the proportion of successful shepherding events as a function ofN and nover 50 simulations. In the global casen¼N21 and down ton¼0.53N, the algorithm is always successful. ForN.30, there is a transition region below the linen¼0.53N and aboven3log(N) where the probability of success drops from 1 to rare. In the region under the curve min(0.53N, 3log(N)) success is very rare.
We tested whether our model matched data collected using a back-mounted global positioning system (GPS) attached to N¼46 sheep and a working farm dog [6,31]. Electronic supplementary material, video 2, shows the data
collected in the three experiments. For each herding event, the following can be observed: first, the dog approaches the sheep, and the sheep aggregate. The dog then positions itself behind the flock relative to the end position and starts driving it forward. As the flock is driven forward, individuals at one or both flanks begin to drift away from the overall flock centre of mass. The dog corrects for this by approaching the flank sheep and positions itself behind the sheep relative to the centre of the flock. The dog then returns to herding the flock towards the target.
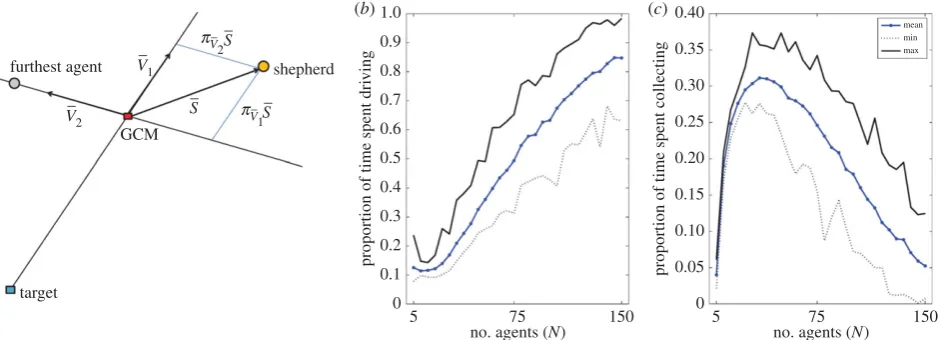
To quantitatively compare the model with the experimen-tal data, we calculate the projections of the shepherd vectorS
onto the centroid vectorv1and the furthest agent vectorv2, respectively (figure 4a). These projectionsparv1Sandpv2S pro-vide us with information about where the shepherd is relative to the centre of mass of the flock. Ifpv1S.0:95, the shepherd
250
200
150
100
50
0
driving
collecting
X position (m)
Y
position (m)
[image:3.595.116.480.42.236.2]0 50 100 150 200 250
Figure 2.
Simulation trajectories. The accumulated result of a simulation with 100 agents. The agents’ starting and end positions are marked with circles and their
trajectories throughout the simulation are thin lines. The trajectory of the shepherd (thick line) starts at (15,170) and goes directly for the agent furthest from the
GCM at coordinates (245,140). When the shepherd approaches the agents aggregate and are eventually cohesive enough to start herding when the shepherd is at
position (170,200). After a short straight driving phase, the shepherd is forced to go to one flank and then immediately the other to collect agents drifting off. This
process of driving and collecting then goes on until the GCM of the group of agents is within 10 units from (0,0). The box highlights the driving phase and
collecting phase which results in the side-to-side motion of the shepherd. (Online version in colour.)
no. agents (N)
no. neighbours (
n
)
20 40 60 80 100 120 140
20 40 60 80 100 120 140
0 0.1 0.2 0.3 0.4 0.5 0.6 0.7 0.8 0.9 1.0
Figure 3.
Proportion of successful shepherding events within 8000 time steps as a function of
N
[
[2, 150] and nearest neighbours
n
[
[1,
N
1]. We see that in
the global case
n
¼
N
2
1 and down to roughly
n
¼
0.53
N
the algorithm is always successful. For
N
.
30, there is a transition region below the line
n
¼
0.53
N
and
above
n
3log(
N
) where the probability of success drops from 1 to rare at a rate that is decreasing with
N
. Finally, in the region under the curve min(0.53
N
, 3log(
N
))
success is rare and sporadic. The other parameters are the typical values listed in table 1 except for
r
s¼
45. (Online version in colour.)
rsif.r
oy
alsocietypublishing.org
J.
R.
Soc.
Interfa
ce
11
:
20140719
[image:3.595.118.482.340.534.2]is directly behind the flock relative to target. Ifpv2S.0:95, the shepherd is on the same side of the flock as the furthest agent and ifpv2S,0:95, it is on the opposite side. We cal-culate these projections in each time step of the simulation and in the data and present distributions showing the pro-portion of time steps the shepherd spent in a certain position. These measures capture both the driving mode, where the shepherd is directly behind or in front of the flock relative to the target (i.e.pv1S.0:95), and the collecting mode when the shepherd is directly behind, or on the opposite side of the flock, relative to the furthest agent (i.e.jpv2Sj.0:95). Figure 4b,cshows how the proportion of time driving and collecting depends on the number of agents in simulations in the global case. The time the shep-herd spends collecting agents increases until N¼40, and then decreases linearly (figure 4c), with a corresponding increase in time spent driving (figure 4b) as N increases and the flock is less likely to fission.
Figure 5a shows the minimum, mean and maximum distance between the shepherd and the centre of mass of the agents throughout the three trials. We compare this with the result of simulations in which the parameters are set to mimic the behaviour of real sheep and sheepdogs (figure 5b; electronic supplementary material, video 3). The overall shapes of the distributions match and both include the peak at around 10 m. Figure 5cshows that the proportion of time the dog spends in the driving and collecting modes is consistent with the shepherd behaviour in simulations. The box plot shows the result of 100 simulations and the results of each of the three trials are marked with dots. The full dis-tributions of the centroid and furthest sheep projection values in simulations and in the data are presented in the electronic supplementary material, figure S1. We see that the projection on the centroid vector (pv1S) is peaked at 1, indicating a pos-ition behind the flock (electronic supplementary material, figure S1a,c). The distribution of the projection on the furthest sheep vector (pv2S) has a bimodal structure, peaking at 21 and 1, which indicates a position either on the side of the flock with the furthest sheep, or on the opposite side of the flock (electronic supplementary material, figure S1b,d). This results from both the dog’s positioning itself to collect
the furthest sheep, and the resulting attempted ‘escape’ of sheep on the other side of the flock. We also investigated how the distance from the initial release site to the target affected success rate and time to completion. In each simu-lation, 46 agents were initially positioned randomly within a 5050 square centred at the point (lþ25p2ffiffiffi,lþ25pffiffiffi2). We performed 100 simulations for each value of distance to targetl, withlincreasing from 10 to 500, and the time to com-pletion was measured. The result is shown in the electronic supplementary material, figure S2, and we see that the success rate is unaffected and that the average time to completion increases linearly with distance to target.
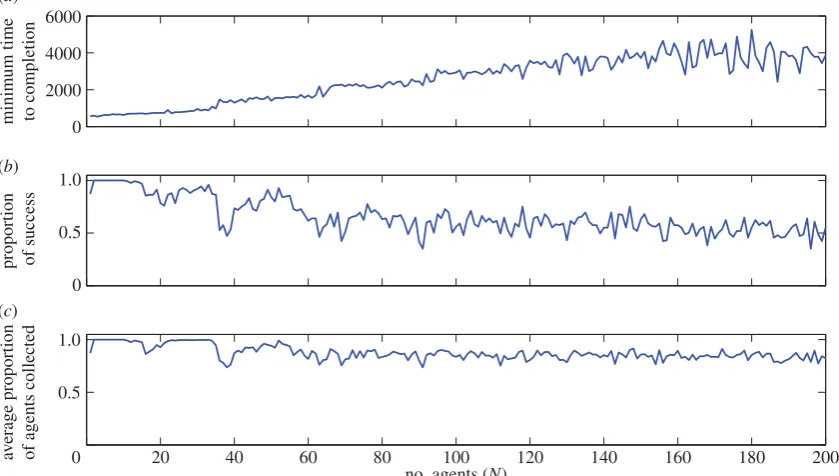
Although our model is consistent with the data and allows herding of the 46 sheep used in the experiment, our algorithm is not guaranteed to succeed whenn,N/2 and often fails whennN. One way of overcoming this problem and potentially allow the shepherd to deal with groups of arbitrary size is to programme it to sequentially bring in subgroups of a size it can handle. To test this idea, we implemented a shepherd that employs the algorithm on the LCM of thens nearest neighbours rather than the GCM of all agents. Initial investigations showed that the shepherd can get stuck in the centre of mass of several symmetrically distributed subgroups and is thereby unable to complete the task. To counteract this problem, we also introduced a blind zone behind the dog specified by an angleb[32] (see the Models and methods for details). This modification improved the situation. In 56 out of 100 simulation runs a shepherd acting on its ns¼20 nearest neighbours success-fully brought in groups of N¼201 agents with n¼20. Electronic supplementary material, video 4, shows six such simulations. In the first three simulations, the shepherd is successful, often bringing in groups of more than ns¼20 agents at a time. However, the last three simulations show typical situations where the shepherd gets stuck and fails to complete the task. In these runs, the shepherd is typically trapped between two or more clusters. Three quantitative measures of the local shepherd’s performance as a function of number of agents (N) are presented in figure 6. For each
N, we ran 100 simulations and calculated the minimum time to completion (figure 6a), proportion of successful shepherd
proportion of time spent collecting
proportion of time spent dri
ving
GCM furthest agent
target – V2
– V1
– S
1.0
0.9
0.8
0.7
0.6
0.5
0.4
0.3
0.2
0.1
0
0.40
0.35
0.30
0.25
0.20
0.15
0.10
0.05
0
no. agents (N) no. agents (N)
5 75 150 5 75 150
–S–
pV1
–S–
pV
2
mean min max (b)
[image:4.595.67.537.43.213.2](a) (c)
Figure 4.
Projections used to define the driving and collecting modes and how the proportion of time spent driving and collecting depends on the number of
agents. (
a
) How the centroid vector
v
1, the furthest agent vector
v
2and shepherd vector
S
are set up. Three measurements related to these vectors will be used in
comparing the model to the sheep data (figure 5). The projection of
S
on
v
1denoted by
p
v1S
, the projection of
S
on
v
2denoted by
p
v2S
and the length of
S
.
(
b
) Proportion of time the shepherd spends driving (p
v1S
.
0:95) as a function of group size (
N
) in the global case (
n
¼
N
2
1) over 100 simulations.
(
c
) Proportion of time spent collecting (
j
p
v2S
j
.
0:95) as a function of group size (
N
) in the global case over 100 simulations. The other parameters are
the typical values listed in table 1. (Online version in colour.)
rsif.r
oy
alsocietypublishing.org
J.
R.
Soc.
Interfa
ce
11
:
20140719
herding events (figure 6b) and finally the average proportion of agents collected over the 100 simulations (figure 6c). Mini-mum time to completion suggests that in the optimal case, the time to completion increases approximately linearly with
number of agents (minimum completion time¼20Nþ630). The proportion of successful trials decreases from 1 for small number of agents down to approximately 0.5 for N¼200. However, even in the cases where the shepherd ultimately
10 20 30 40 50
distance from shepherd to centroid(m)
10 20 30 40 50
0 0.02 0.04
0.06 0.08 0.10
0 0.02 0.04
0.06 0.08 0.10
distance from dog to the centroid(m)
proport
i
on of t
i
me
proport
i
on of t
i
me
driving mode collecting mode
0 0.05 0.10 0.15 0.20 0.25 0.30 0.35 0.40 0.45 min
mean max
exp 1 exp 2 exp 3
(b)
[image:5.595.61.534.45.317.2](a) (c)
Figure 5.
Comparison of the model with data for 46 sheep. (
a
) The proportion of time the dog spent at a certain distance from the GCM of the sheep (length of
vector
S
in figure 4) over the three trials. (
b
) The proportion of time the shepherd spent at a certain distance from the GCM of the agents over 100 simulations.
The overall shape of the distance distributions in experiments and simulations agree and in particular both exhibit a peak at around 10 m. (
c
) The proportion of
time the dog/shepherd spent in driving mode (directly behind the flock relative to the target) and in collecting mode (on the same or opposite side of the flock
as the furthest sheep). The boxplots illustrate the proportion of time the shepherd spent in driving or collecting mode over 100 simulations and the points represent
the proportion of time the dog spent driving or collecting during three experimental trials. The parameters used in the simulation are the typical values listed in
table 1 except for
n
¼
46,
r
s¼
75 m,
r
a¼
1 and
e
¼
0.1. The experimental data can be seen in the electronic supplementary material, video 2, and simulations
with these parameter values in video 3. (Online version in colour.)
20 40 60 80 100 120 140 160 180 200
0 2000 4000 6000
minimum time to completion
0 0.5 1.0
proportion of success
0 0.5 1.0
no. agents (N)
av
erage proportion
of agents collected
(b) (a)
(c)
Figure 6.
Performance of the local shepherd as a function of number of agents (
N
) from 1 to 200 over 100 simulations. (
a
) The minimum time to completion as a
function of number of agents. (
b
) The proportion of success. (
c
) The average proportion of agents collected as a function of number of agents. The number of nearest
neighbours was
n
¼
20 and the other parameters as listed in table 1 except
L
¼
300,
t
max¼
40 000,
r
a¼
3 and
h
¼
0.3. (Online version in colour.)
rsif.r
oy
alsocietypublishing.org
J.
R.
Soc.
Interfa
ce
11
:
20140719
[image:5.595.89.509.448.686.2]fails, it tends to bring in a majority of agents before. The aver-age number of aver-agents collected decreases with number of agents, but slowly, and even in simulations with 200 agents the shepherd manages to bring in 80% of the total number of agents over 100 simulations.
3. Discussion
The model we have presented offers a solution to the shepherd-ing problem. Usshepherd-ing a set of simple heuristics, we show that a shepherd can herd autonomous, interacting agents towards a target destination. The shepherd heuristics are based on adap-tive switching between collecting agents when they are too dispersed and driving them once they are aggregated. These rules function to (i) reduce the probability that the group splits and (ii) allow the shepherd to keep the group moving towards a target location. A side-to-side motion of the shepherd also emerges as a consequence of these rules, a feature which has previously been hard-coded into shepherd movement rules in other models to improve efficiency [7,16,28].
There are a number of aspects of both the shepherd and the agent behaviour in our model that are consistent with real herding events involving sheep and a sheepdog (figure 5). Instead of weaving side-to-side behind a flock at some fre-quency, our shepherding algorithm results in the shepherd driving the group when it is cohesive and actively seeking and collecting those that drift out at the edges. This is exactly the type of behaviour that we see in our sheep–sheepdog datasets. The visual similarities between the model and the data (electronic supplementary material, videos 2 and 3) are corroborated by quantitative comparisons of the data and our model (figure 5).
The plausibility of our model relies upon two assumptions. The first is that the dog can estimate the space between the sheep, irrespective of their metric distance. This seems reason-able given the border collie, a classic sheepdog breed, is said to use a direct stare to herd the flock [29], and similar heuris-tics-based models have proved useful in understanding the behaviour of pedestrians in crowds [33]. Nevertheless, it would be useful to gather further evidence using, for example, eye-tracking systems to determine shifts in the dog’s visual attention. Also, in our field experiments, we used an experi-enced dog which was given minimal direction. It would be interesting to conduct experiments with multiple dogs and owners of dogs of varied abilities; this way, we would be begin to investigate the role of task familiarity and learning in herding performance. Our second assumption is that agents are attracted to the centre of mass of at least half of the total number of agents (figure 3). At larger group sizes, this means that agents interact with many neighbours, which is at odds with other theoretical models of flocking in which agents tend to interact locally with a small number of individuals [16]. It is nonetheless consistent with a sheep flock’s initial responses to the approach of a herding sheepdog [6], and with empirical data on bird flocking in which a topological interaction is required to maintain flock cohesion under perturbations [34].
Although our algorithm is consistent with the data, and unlike previous models [16] allows herding of large groups, it is not guaranteed to succeed when agents interact with less than half of the total group size. Under these con-ditions, the group of agents is likely to split into two or more stable subgroups. As our intention was to create a
model that was not only applicable to the sheep– sheepdog scenario, but also to similar phenomena such as cleaning the environment, we augmented our basic shepherding algorithm with a mechanism to allow the shepherd to detect that the group has split and then bring each subgroup in sequentially. To do this, we employed the same shepherd-ing algorithm on the LCM of nearby agents, rather than on the GCM (note that this might also be applicable to the sheep-dog at large group sizes, because it would not be able to see the entire flock, but we do not have data on this). Merging of separated agents has been discussed in [8] but the approach of splitting the task into one for each subgroup is, as far as we know, new. However, at present this extended local shepherd algorithm is not always successful, rather it has a success rate of about 80% as a result of the shepherd getting stuck between collecting two subgroups of agents. In practice (e.g. with a herding dog or herding robot), an instruction could be given which could rectify this.
Our approach should support efficient designs for herding autonomous, interacting agents in a variety of contexts. Obvious cases are robot-assisted herding of livestock [20], and keeping animals away from sensitive areas [21], but appli-cations range from control of flocking robots to cleaning up of environments and human crowd control. In the case of flocks of mobile robots, for example, engineers have designed virtual or explicit leaders to guide groups to target headings, or else assumed that a heading is sensed by the whole group [22]. A simpler alternative is to shepherd such groups, using the algorithm which we have described here. This would be particularly useful for guiding robots back to a base after completion of some task. In the case of cleaning up of environ-ments, multi-robot systems have been proposed to help clean up marine oil spills, and specifically prevent spills from spread-ing wider [35]. It would be fascinatspread-ing to explore how our algorithms performed in this task and in other scenarios where fluids or granular media need collecting/corralling. The algorithm may also be applied to situations where crowds of people have little information and there is a tendency to imi-tate the behaviour of each other. This is especially common where visibility is poor, and people need to escape from a smoky room [36]. In such situations, it may be possible to herd the movements of people to exits using a shepherd robot. Finally, returning to biology, our results also inform our understanding of animal collective behaviour in the presence of threat [37]. It is tempting to envisage a similar set of rules to those we describe for our shepherd guiding the behaviour of predators attacking flocking prey. While the same ability to esti-mate space between prey might be important to understanding and building a mechanistic understanding of predator move-ment rules, these rules will not be the same as those used here. The goal of the shepherd (and our sheepdog example) is to keep the flock together and manoeuvre it as a single unit; a predator’s goal is typically the opposite, namely to break up aggregations and isolate individuals as potential targets [38].
4. Model and methods
4.1. Model
Initially,Nagents are randomly positioned in the upper right quarter of anLL square and a shepherd released in the lower left quarter. The square is not enclosed so the agents and shepherd may leave it at a later time. Denote the position
rsif.r
oy
alsocietypublishing.org
J.
R.
Soc.
Interfa
ce
11
:
20140719
of the shepherd bySand the position of theith agent byAi. If
an agent is further away thanrsfrom the shepherd it grazes. That is, it is typically stationary, but exhibits small random movements. If the distance to the shepherd is shorter than
rs, then each agent iwill be repelled directly away from it in the direction ofRsi¼AiSand at the same time will be
attracted to the centre of mass of its n nearest neighbours ðLCM Þi in the direction of Ci¼LCM iAi. Agents are also
locally repelled from each other, so that if two or more agents are within a distance ofraof each other there will be a repulsive force acting to separate them. More precisely, if agentihaskneighbours within a distance ofraat positions
A1, . . ., Ak, the repulsive force oniis defined by
Rai¼X
k j¼1
1
jAiAjj
(AiAj): (4:1)
The heading agentiwill take in the next time step H0iis a linear combination of these forces (normalized) plus inertia
^
Hiand an error term ˆe(see figure 1), which can be described
as follows:
H0i¼hH^iþcC^tþraR^
a iþrsR^
s
iþe^ei, (4:2)
where the weights are chosen so that ra.c.rs.h. The reasons for this inequality are that agent-to-agent repulsion
ra must be dominating in order for any group size to be maintained and that in the real world sheep tend to aggregate rather than immediately disperse in the presence of a dog [6]. Therefore, we assume that local attraction between agents is stronger than repulsion from the shepherd c.rs. Finally, the tendency to proceed in the previous direction h is
included to prevent sharp turns and smoothen trajectories and should be subordinate to all interactions. The typical values for these parameters in simulations arera¼2,c¼1.05,rs¼1 and
h¼0.5. Agentiwill then move a distance ofdin this direction
H0iand its new position is given by
A0i¼AiþdH^i0: (4:3)
See table 1 for an overview of the parameters of the model. The shepherd’s task is to collect all agents into one flock and herd them to the lower left corner of theLL square. When the centre of mass of the flock (GCM) is within a cer-tain distance from the origin, the shepherding task is completed. While shepherding the shepherd decides on one of two possible moves, collect or herd, at each time step, which depends on whether all agents are within a distance of f(N) from the GCM (see figure 2). f(N)¼ra ffiffiffiffiN
p
would require the flock to be perfectly circular and so to allow for asymmetry of the flock, we takef(N)¼raN2/3. If all agents are not withinf(N), the shepherd moves towards the point
[image:7.595.41.564.65.408.2]Pcto collect the agent furthest from the GCM at positionAf. If the flock is cohesive, that is, all agents are withinf(N), the shepherd positions itself atPd to drive the flock. The shep-herd attempts to go in a straight line towards these points but if it gets within 3ra of an agent, its speed ds is set to 0. 3rawas selected because of our observations of our sheep-dog in the field, where the sheep-dog would rarely approach the flock at close range (since this causes the flock to fission). The shepherd experiences the same noise as the agents ee^; this noise is critical for resolving dead-lock situations. The shepherd will repeat this until the GCM is within a certain distance from the origin.
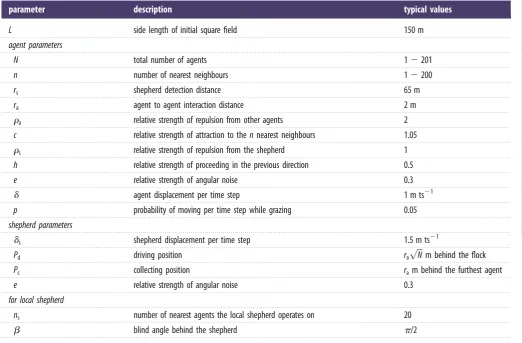
Table 1.
The parameters of the model. Notation, description and typical values used in simulations.
parameter
description
typical values
L
side length of initial square field
150 m
agent parameters
N
total number of agents
1
2
201
n
number of nearest neighbours
1
2
200
r
sshepherd detection distance
65 m
r
aagent to agent interaction distance
2 m
r
arelative strength of repulsion from other agents
2
c
relative strength of attraction to the
n
nearest neighbours
1.05
r
srelative strength of repulsion from the shepherd
1
h
relative strength of proceeding in the previous direction
0.5
e
relative strength of angular noise
0.3
d
agent displacement per time step
1 m ts
21p
probability of moving per time step while grazing
0.05
shepherd parameters
d
sshepherd displacement per time step
1.5 m ts
21
P
ddriving position
r
affiffiffi
N
p
m behind the flock
P
ccollecting position
r
am behind the furthest agent
e
relative strength of angular noise
0.3
for local shepherd
n
snumber of nearest agents the local shepherd operates on
20
b
blind angle behind the shepherd
p/2
rsif.r
oy
alsocietypublishing.org
J.
R.
Soc.
Interfa
ce
11
:
20140719
4.2. Local shepherd
The task of the local shepherd is to complete the original task of delivering allN agents down to the lower left corner by sequentially bringing in subgroups of a size it can handle. It starts by going to pick up the first subgroup, which it brings in. The shepherd repeats this process until all agents are brought in. We denote the number of agents that have not been brought in yet byNt. The agents behave exactly like in the original model but the shepherd now employs the algor-ithm on the LCM of the min(Nt,ns) nearest agents within visual range (LCMt) instead of the GCM of all agents. The visual range of the shepherd is limited by the inclusion of a blind zone behind it relative to the detectedLCMtspecified by the angle
b. The reason for including this blind zone was to overcome the problem of the shepherd being encircled by subgroups of agents and from then on unable to move. Electronic sup-plementary material, video 4, shows both successful and unsuccessful trials with a local shepherd using ns¼20 and
N¼201 agents with n¼20 and the other parameters as listed in table 1 exceptL¼300,tmax¼40 000,ra¼3 andh¼ 0.3. The movie was constructed by recording every 100th frame of the simulations.
4.3. Sheep flock and herding dog
A flock of 46 female merino sheep (Ovis aries) aged 3 years and with a mean+s.e.m. body weight of 52+6 kg was used. Throughout the experiments, the sheep were housed in a 5 ha field and given ad libitum access to hay and water on all days. A trained female Australian Kelpie working farm dog was used to herd the sheep. All trials were under-taken in South Australia in March 2010. For each trial, the dog was directed verbally to herd the flock to the gate of the field, with minimal guidance (given the command ‘bring them home’). One herding event was recorded per day.
4.4. Sheep and dog movement data
All sheep and the sheepdog were fitted with a ‘data-logger’ during all herding events. The loggers are an in-house design and comprise a GPS module capable of recording single frequency L1 raw range data at 10 Hz (uBlox LEA-4T GPS module), a GPS patch antenna, MSP430 microcontroller and a rechargeable 2200 mAh lithium polymer battery. The logger was set to record raw pseudo-range GPS data at 1 Hz, which were saved to a micro-SD card. These com-ponents were mounted and housed in a sealable plastic box and attached to a standard sheep harness (Rurtec, Hamilton, New Zealand), or dog harness purchased from a local store. The logger and harness had a total mass of 530 g (150 g data logger, 381 g harness), which was 1% of mean sheep body mass, and has been shown not significantly to alter key locomotion parameters of sheep within this man-aged population [6]. A Novatel FlexPak G2L/OEM4 GPS base station was also mounted with a clear sky view on top of a grain silo at the location (approx. 6 m above ground level) providing synchronized measurements that were used to improve accuracy in post-processing. GPS data for loggers and base station were post-processed in differential mode using WAYPOINTGRAF-NAVv. 8.10 (www.novatel.com). This approach allows carrier phase ambiguity resolution/a fixed integer kinematic solution and an absolute positional accuracy of 10 –20 cm. Much of the error in positional accu-racy was consistent across loggers and Gaussian in nature. For further details on post-processing, see [6,31]. Data were then analysed using Matlab v. R2010.
Acknowledgement.We thank the three reviewers for their helpful and insightful comments and remarks.
Funding statement.Fieldwork, and research via a sub-contract to A.M.W. was funded by a grant from CHDI Inc. to A.J.M. A.J.K. was sup-ported by a NERC Fellowship (NE/H016600/3). D.J.T.S. was supported by an ERC starting grant (IDCAB).
References
1. Tinbergen N. 1951The study of instinct. Oxford, UK: Oxford University Press.
2. Couzin ID, Krause J, James R, Ruxton GD, Franks NR. 2002 Collective memory and spatial sorting in animal groups.J. Theor. Biol.218, 1 – 11. (doi:10. 1006/jtbi.2002.3065)
3. Sumpter DJT. 2010Collective animal behavior. Princeton, NJ: Princeton University Press. 4. Aoki I. 1982 A simulation study on the
schooling mechanism in fish.Bull. Jpn Soc. Fish.48, 1081 – 1088. (doi:10.2331/ suisan.48.1081)
5. Hamilton WD. 1971 Geometry for the selfish herd.
J. Theor. Biol.21, 295 – 311. (doi:10.1016/0022-5193(71)90189-5)
6. King AJ, Wilson AM, Wilshin SD, Lowe J, Haddadi H, Hailes S, Morton AJ. 2012 Selfish-herd behaviour of sheep under threat.Curr. Biol.22, R561 – R562. (doi:10.1016/j.cub.2012.05.008)
7. Lien J, Bayazit OB, Sowell RT, Rodriguez S, Amato AM. 2004 Shepherding behaviors. InProc. IEEE Int. Conf. on Robotics and Automation, pp. 4159 – 4164. (doi:10.1109/ROBOT.2004.1308924)
8. Lien J, Rodriguez S, Malric J, Amato NM. 2005 Shepherding behaviors with multiple shepherds. InProc. IEEE Int. Conf. on Robotics and Automation, pp. 3402 – 3407. (doi:10.1109/ROBOT. 2005.1570636)
9. Barry AM, Dalrymple-Smith H. 2005Visual communication and social structure—the group predation of lions. Bath, UK: Department of Computer Science, University of Bath.
10. Adachi Y, Kakikura M. 2006 Research on sheepdog problem using cellular automata. InProc. IEEE Int. Conf. on Computational Cybernetics, pp. 1 – 6. (doi:10.1109/ICCCYB.2006.305722)
11. Miki T, Nakamura T. 2006 An effective simple shepherding algorithm suitable for implementation to a multi-mobile robot system. InProc. 1st Int. Conf. on Innovative Computing, Information and Control, pp. 161–165. (doi:10.1109/ICICIC.2006.411) 12. Vo C, Harrison JF, Lien JM. 2009Behavior-based
motion planning for group control. Fairfax, VA: George Mason University.
13. Kachroo P. 2001 Dynamic programming solution for a class of pursuit evasion problems: the herding
problem.IEEE Trans. Syst. Man Cybern.31, 35 – 41. (doi:10.1109/5326.923266)
14. Vaughan R, Sumpter N, Frost A, Cameron S. 1998 Robot sheepdog project achieves automatic flock control. InProc. 5th Int. Conf. on Simulation of Adaptive Behavior: From Animals to Animats 5, pp. 489 – 493. Cambridge, MA: MIT Press. 15. Vaughan R, Sumpter N, Henderson J, Frost A,
Cameron S. 2000 Experiments in automatic flock control.Robot. Auton. Syst.31, 109 – 117. (doi:10. 1016/S0921-8890(99)00084-6)
16. Bennett B, Trafankowski M. 2012 A Comparative investigation of herding algorithms. InProc. Symp. on Understanding and Modelling Collective Phenomena
(UMoCoP), Birmingham, UK, 2 –6 July 2012 (eds A Galton, Z Wood), pp. 33–38. 17. Hughes RL. 2002 A continuum theory for the
flow of pedestrians.Transp. Res. B Methodol. 36, 507 – 535. (doi:10.1016/S0191-2615(01) 00015-7)
18. Hughes RL. 2003 The flow of human crowds.Annu. Rev. Fluid Mech.35, 169 – 182. (doi:10.1146/ annurev.fluid.35.101101.161136)
rsif.r
oy
alsocietypublishing.org
J.
R.
Soc.
Interfa
ce
11
:
20140719
19. Fingas MF. 2001The basics of oil spill cleanup, 2nd edn. Boca Raton, FL: Lewis Publishers.
20. Schultz AC, Adams W. 1998 Continuous localization using evidence grids. InProc. IEEE Int. Conf. on Robotics and Automation(ICRA), pp. 2833 – 2839. (doi:10.1109/ROBOT.1998.680595)
21. Endangered Wildlife Trust. 1999 EWT airport safety project. See http://www.ewt.org.za/programmes/ WTP/air.html.
22. Turgut AE, Celikkanat H, Go¨kce F, Sahin E. 2008 Selforganized flocking in mobile robot swarms.
Swarm Intell.2, 97 – 120. (doi:10.1007/s11721-008-0016-2)
23. Reynolds CW. 1987 Flocks, herds and schools: a distributed behavioral model.SIGGRAPH Comput. Graph.21, 25 – 34. (doi:10.1145/37402.37406) 24. Huth A, Wissel C. 1992 The simulation of the movement of fish schools.J. Theor. Biol.156, 365 – 385. (doi:10.1016/S0022-5193(05)80681-2) 25. Lukeman R, Li YX, Edelstein-Keshet L. 2010
Inferring individual rules from collective behavior.
Proc. Natl Acad. Sci. USA107, 12 576 – 12 580. (doi:10.1073/pnas.1001763107)
26. Buhl J, Sumpter DJT, Couzin ID, Hale JJ, Despland E, Miller ER, Simpson SJ. 2006 From disorder to order
in marching locusts.Science312, 1402 – 1406. (doi:10.1126/science.1125142)
27. Vicsek T, Zafeiris A. 2012 Collective motion.Phys. Rep. 517, 71– 140. (doi:10.1016/j.physrep.2012.03.004) 28. Lien JM, Pratt E. 2009 Interactive planning for shepherd
motion. InProc. AAAI Spring Symp., Palo, Alto, CA, 23– 25 March 2009, pp. 95–102. Menlo Park, CA: AAAI Press.
29. Coppinger L, Coppinger R. 2000 Dogs for herding and guarding livestock. InLivestock handling and transport (ed. T Grandin), pp. 235 – 254. Wallingford, UK: CAB International.
30. Darling FF. 1937A herd of red deer. Oxford, UK: Oxford University Press.
31. Haddadi H, King AJ, Willis AP, Fay D, Lowe J, Morton AJ, Hailes S, Wilson AM. 2011 Determining association networks in social animals: choosing spatialtemporal criteria and sampling rates.Behav. Ecol. Sociobiol.65, 1659 – 1668. (doi:10.1007/ s00265-011-1193-3)
32. Stro¨mbom D. 2011 Collective motion from local attraction.J. Theor. Biol.283, 145 – 151. (doi:10. 1016/j.jtbi.2011.05.019)
33. Moussaid M, Helbing D, Theraulaz G. 2011 How simple rules determine pedestrian behavior and
crowd disasters.Proc. Natl Acad. Sci. USA108, 6884 – 6888. (doi:10.1073/pnas. 1016507108)
34. Ballerini Met al. 2008 Interaction ruling animal collective behaviour depends on topological rather than metric distance: evidence from a field study.
Proc. Natl Acad. Sci. USA105, 1232 – 1237. (doi:10. 1073/pnas.0711437105)
35. Zahugi EMH, Shanta MM, Prasad TV. 2013 Oil spill cleaning up using swarm of robots.Adv. Comput. Inform. Technol.178, 215 – 224. (doi:10.1007/978-3-642-31600-5_22)
36. Isobe M, Helbing D, Nagatani T. 2004 Experiment, theory, and simulation of the evacuation of a room without visibility.Phys. Rev. E69, 066132. (doi:10. 1103/PhysRevE.69.066132)
37. Procaccini Aet al. 2011 Propagating waves in starling,Sturnus vulgaris, flocks under predation.
Anim. Behav.82, 759 – 765. (doi:10.1016/j.anbehav. 2011.07.006)
38. Bailey I, Myatt JP, Wilson AM. 2013 Group hunting within the Carnivora: physiological, cognitive and environmental influences on strategy and cooperation.Behav. Ecol. Sociobiol.67, 1 – 17. (doi:10.1007/s00265-012-1423-3)