This is a repository copy of APULOT test: a tool for concrete’s quality control based on bond performance.
White Rose Research Online URL for this paper: http://eprints.whiterose.ac.uk/92358/
Version: Accepted Version
Proceedings Paper:
García-Taengua, E, Requena-Bueno, M, Martí-Vargas, JR et al. (1 more author) (2012) APULOT test: a tool for concrete’s quality control based on bond performance. In: BOND 2012 - Bond in Concrete 2012. Bond in Concrete 2012, 17-20 Jun 2012, Bresica, Italy. .
[email protected] https://eprints.whiterose.ac.uk/
Reuse
Unless indicated otherwise, fulltext items are protected by copyright with all rights reserved. The copyright exception in section 29 of the Copyright, Designs and Patents Act 1988 allows the making of a single copy solely for the purpose of non-commercial research or private study within the limits of fair dealing. The publisher or other rights-holder may allow further reproduction and re-use of this version - refer to the White Rose Research Online record for this item. Where records identify the publisher as the copyright holder, users can verify any specific terms of use on the publisher’s website.
Takedown
If you consider content in White Rose Research Online to be in breach of UK law, please notify us by
1 INTRODUCTION
The APULOT test, or bottle test, was first thought of at Université de Toulose and is being developed in co-operation by different universities in Brazil and other countries (Lorrain 2008, do Vale Silva 2010, Lorrain 2010, do Vale Silva 2011, Nguyen 2011).
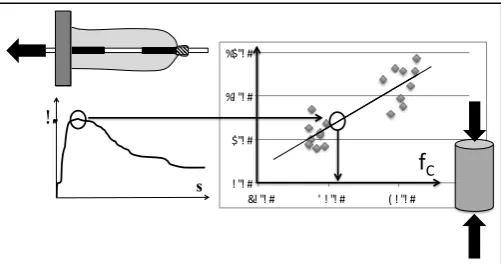
The APULOT test is carried out on concrete specimens which are produced using a plastic bottle as a mould, the bottom having been cut and re-moved, and with an embedded reinforcing bar. At the age of control, i.e. 28 days after casting, the re-bar is pulled out and the bond strength value ob-tained is the control parameter. It is therefore a very particular variation of the pull out test. By having the bond strength value obtained to concrete's com-pressive strength, as shown in Figure 1, the APULOT test can constitute an alternative to cylin-drical specimens for concrete's quality control.
This test is proposed as a low-cost and simple al-ternative to conventional quality control of concrete that can be applied where technical means are not widely available. As a consequence, it can be an easy way of introducing quality control at regions where it is not usually performed because of tech-nical limitations.
2 OBJECTIVES
The main objective of this and other ongoing studies in relation to the APULOT test is to arrive at an
ac-ceptable initial proposal susceptible of being stand-ardized as an informative or orientative quality con-trol test for concrete which can be applied extensive-ly to concrete production as well as concrete reception. The research reported herein had two par-ticular goals contributing to the aforementioned gen-eral objective.
Figure 1. Bond strength as a parameter for concrete's quality control in the APULOT test.
The first particular objective was to analyze how certain variables related to the definition of the test itself affect the test output, i.e. bond strength, and its relation to compressive strength of concrete evaluat-ed by means of cylindrical 150x300mm specimens.
The second particular objective was to study the feasibility of the test as a quality control test for compressive strength of concrete, by assessing the variability of its outcome and comparing it to that of cylindrical specimens data.
APULOT test: a tool for concrete’s quality control based on bond
performance
E. García-Taengua, M. Requena-Bueno, J.R. Martí-Vargas & P. Serna-Ros
ICITECH-Institute of Concrete Science and Technology, Universitat Politècnica de València, Valencia, Spain
ABSTRACT: The APULOT test, or bottle test, is a cheap and simple alternative to cylindrical specimens for those regions where conventional quality control is difficult to introduce. By casting concrete into an empty plastic bottle (the mould), bottle-shaped concrete specimens with an embedded rebar are produced. The rebar is simply pulled out of the concrete specimen and bond strength is the outcome used for quality control. It has been investigated how different parameters affect bond strength values in the APULOT test, and their relation to compressive strength of concrete in order to compare the reliability of the bottle test with the conventional quality control strategy by means of cylindrical specimens. The best configuration of the parameters consid-ered for an eventual standardization has been examined, and expressions have been found as a tool to translate bond strength values to concrete compressive strength values that can be monitored.
! "! # $"! # %! "! # %$"! #
&! "! # ' ! "! # ( ! "! # $! "! # !²
s
t
[image:2.595.308.559.483.615.2]3 EXPERIMENTAL PROGRAM
3.1 Variables Considered
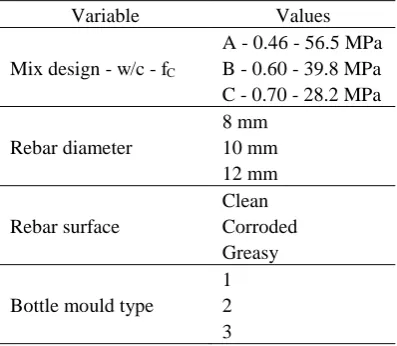
[image:3.595.33.232.281.454.2]The variables considered in the research reported herein as well as their different values are summa-rized in Table 1. Rebar diameter, state of the rebar surface, and type of bottle are variables related to the definition of the test itself, and their effect on the test outcome is to be analyzed in order to give recom-mendations concerning how the test is to be per-formed. In addition, three different mix designs have been considered, i.e. with different w/c ratios, their average compressive strength being used to relate bond strength values obtained from the APULOT test to compressive strength values as evaluated by means of cylindrical specimens.
Table 1. Variables considered in this research.
Variable Values
Mix design - w/c - fC
A - 0.46 - 56.5 MPa B - 0.60 - 39.8 MPa C - 0.70 - 28.2 MPa
Rebar diameter
8 mm 10 mm 12 mm
Rebar surface
Clean Corroded Greasy
Bottle mould type
1 2 3
Mix designs considered have been defined with the intention of focusing the analysis on low- and middle-strength concretes. The test is most likely to be useful to monitor production and reception of low-strength concrete. However, the need of extend-ing the research to middle-strength mix designs is justified by the need of knowing what happens when the concrete produced or received is better than ini-tially intended. There is no point in considering higher compressive strengths.
All rebars considered are made with steel type B500SD (in agreement with EN 10080).
No rebar diameters greater than 12 mm have been considered since it was preferable to have radial mi-crocracking controlled and therefore minimizing the likeliness of splitting. As a consequence, the process which determines the peak load required to have the bar pulled out is triaxial compression of concrete be-tween ribs (FIB 2010). This favours a clear relation to be established between bond strength values ob-tained and compressive strength of concrete. Greater rebar diameters would decrease the cover/diameter ratio, and this would be likely to favour a greater dispersion in the bond strength values.
The variable describing the state of rebar surface has been included because rebars available at
con-struction sites can be found in different states of conservation. Since bond of rebars to concrete may not be the same if rebars are significantly corroded or if their surface is greasy (circumstances modify-ing friction in the interface between rebar surface and surrounding concrete), the results of the APULOT test may be sensitive to such circumstanc-es.
By means of considering a variable correspond-ing to the state of rebar surface as in this research, conclusions concerning the effect of corrosion can be drawn by comparing the cases 'corroded' vs 'clean', and also in relation to the effect of the rebar being greasy by comparing the cases 'greasy' vs 'clean'.
3.2 Design of the Experiment
[image:3.595.308.536.424.568.2]Not all possible combinations of the levels consid-ered for the variables in this research (Table 1) have been tested. The combinations tested are listed in Table 2 and were selected on the statistical basis of Design of Experiments techniques with the help of orthogonal arrays and derived factorial plans (Mont-gomery 2009). As a consequence, the number of combinations to be tested becomes affordable with-out affecting the reliability of conclusions to be drawn from the experimental results.
Table 2. Combinations tested.
Id
Mix design
Rebar diameter
Rebar surface
Bottle type
L1 A 8 Clean 1
L2 A 10 Greasy 2
L3 A 12 Corroded 3
L4 B 8 Corroded 2
L5 B 10 Clean 3
L6 B 12 Greasy 1
L7 C 8 Greasy 3
L8 C 10 Corroded 1
L9 C 12 Clean 2
3.3 Materials and Mix Designs
[image:4.595.307.562.116.241.2]Mix designs used are summarized in Table 3. Lime-stone crushed sand and crushed coarse aggregate were used, and the cement used was class CEM I 42.5R (in agreement with EN 197-1) in all cases. Limestone filler and a high range water reducing admixture were also used, and their amounts were adjusted in each case to have self-compacting mixes.
Table 3. Mix designs used in this research (kg/m3).
A B C
Cement 420 325 325
Total water 194 195 227
Coarse aggregate
(7/12 + 12/20) 721+0 528+348 503+332
Sand 957 977 933
Limestone filler 72 55 55
Superplasticizer 8.8 2.75 1.33
This might seem in contradiction with the cir-cumstances in which the APULOT test is conceived to be applied. However, the objective of this re-search was to explore how the variables considered affect bond strength values as obtained from the APULOT test and their relation to compressive strength. Since differences regarding the mix com-pactness might have interfered with the conclusions regarding the effects of the variables considered, it was decided to minimize the risk of having un-known, uncontrolled effects by using only self-compacting mixes.
Obviously, the next step is going to be having the test applied to not self-compacting mixes. Accord-ingly, recommendations concerning compaction of concrete when poured into the bottle moulds are to be taken into account in future research.
3.4 Definition and Casting of Bottle Specimens
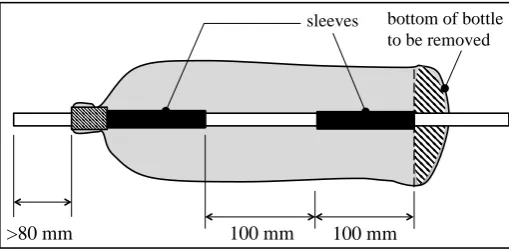
Figure 2 shows the general dimensions of bottle specimens.
At the section where the tap was, the rebar must be fixed as well as possible in order to prevent fresh
concrete to escape through the space between the re-bar and the plastic bottle at this section, and to have the bar relatively centered along the longitudinal ax-is of the bottle. To do so, adhesive tape can be used, rolling it around the rebar many times. A length of at least 80 mm of free rebar is recommended.
Figure 2. General scheme of a bottle specimen
Sleeves are used as indicated in Figure 2 for dif-ferent reasons. The main purpose of sleeves is to have the embedded length of the rebar limited at a certain value, in the case of this research it was 100 mm, though other possibilities have been proposed (do Vale Silva 2010), this particular requiring fur-ther investigation in the future. Using sleeves is also justified by the need of minimizing the effect of compressive reactions on the bottom of the bottle specimen: the length of this sleeve has been fixed to 100 mm. Finally, a second sleeve is used for the re-maining length of the rebar, its purpose being to prevent the development of bond stresses in those sections where concrete cover is highly variable due to the shape of the bottle.
[image:4.595.32.289.172.277.2]Due to the particularities of the bottle specimens (their shape, their having a rebar), it was necessary to find a setup and methodology for casting the con-crete not much sophisticated but which could guar-antee the verticality of the bottle during the casting (so that the bottom surface of the bottle specimen was perpendicular to the rebar) and the rebar being positioned along the longitudinal axis of the bottle mould.
Figure 3. Bottle moulds and rebars prepared and right before casting.
sleeves
100 mm 100 mm
bottom of bottle to be removed
[image:4.595.34.563.608.779.2]Although other methodologies can also be valid as long as they comply with the aforementioned re-quirements, in the case of this research plastic bas-kets, wooden blocks, and sand were used, as shown in Figure 3.
Wooden blocks with holes in them were used for the rebars to be fixed into them. They were put into plastic baskets and then the baskets were filled with sand. This way, the sand fixes the position of the bottle moulds and the wooden blocks, with 80 mm of rebar inserted in the holes, keep the rebar in the desired vertical position. With this simple system, the worker has hands free to cast the concrete into the bottles.
Production of concrete was carried out in all cas-es by following exactly the same sequence and by controlling the time for all operations. Components were added to the mixture following this sequence: aggregates, cement, water, and high-range water-reducing admixture.
Concrete must be poured with care and must be properly compacted. In the case of the specimens for this research, this was avoided by using self-compacting mixes: any unknown interference with test results due to bad compaction had to be avoided in this study.
3.5 Testing of Bottle Specimens
All tests (i.e. both APULOT test and compressive strength tests of control cylindrical specimens) were carried out 28 days after casting.
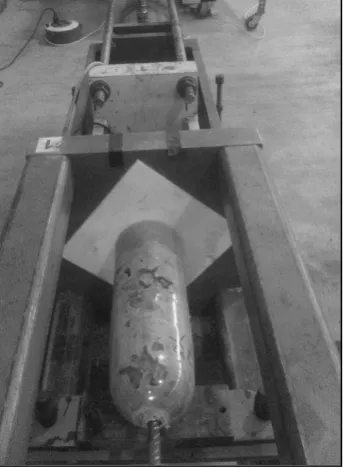
During the pull out tests (see Figure 4), load/time ratio was kept between 2 to 4 kN/min before the peak load was reached, and after the peak load slip/time ratio was kept between 0.4 to 0.6 mm/min.
Figure 4. APULOT test carried out on one bottle specimen.
Relative displacements (slip values) were meas-ured at the loaded end of the rebar by means of a
linear variable differential transformer (LVDT). This was interesting in order to have bond stress-slip curves for all cases and retain them for further anal-ysis, though having slips monitored is not part of the APULOT test, i.e. it is not at all part of the proposed methodology to have it implemented at construction sites.
A piece of teflon was used to improve the contact between the support plate and the bottle specimens in order to minimize the effect of compressive stresses at the loaded end. Using teflon with this purpose was thought to be highly convenient given the unlikeliness of having surface specimen perfect-ly perpendicular to the rebar, given the difficulties of having a very well smoothed surface as a result of having the rebar in the center and the peculiarities of the moulds position during casting.
4 RESULTS AND DISCUSSION
4.1 Analysis of Results: Methodology
[image:5.595.62.234.508.743.2]Table 4 summarizes the test results. In some cases the bottle specimens tested where the rebar was not pulled out in a typical way because either yielding of rebar was reached or splitting occured. In such cases the bond stress-slip curve obtained is not a complete one and there is no bond strength as such. Logistic binary regression has been applied to take advantage of the information regarding the mode of failure ob-served to try to predict under what circumstances yield of the rebar occurs or a bottle specimen is like-ly to experience splitting when the rebar is pulled out.
Table 4. Summary of the test results obtained. Mode of failure Bond strength
BOT, MPa
fC
MPa Id PO Yield Splitting
L1 0 9 0 - 55.4
L2 1 8 0 12.4 56.8
L3 0 1 8 - 57.4
L4 0 9 0 - 39.8
L5 1 8 0 13.8 41.0
L6 9 0 0 11.4 40.4
L7 9 0 0 5.6 28.3
L8 8 1 0 12.6 28.1
L9 8 1 0 12.2 28.3
After that, combinations corresponding to split-ting or yielding of the rebar are discarded, and mul-tiple linear regression (MLR hereafter) has been ap-plied to relate compressive strength values, fC, to
bond strength values obtained from the APULOT test, BOT, by taking into account the modifying
[image:5.595.310.564.515.661.2]sim-plifying the adjusted model without affecting the ac-curacy of the equation found. To do so, statistical in-ference has been made by means of significance tests associated to the coefficients estimated in the construction of the linear model (Hair 2009).
4.2 Variables Determining Mode of Failure
Logistic binary regression (Kleinbaum 2010) has been applied to test results concerning mode of fail-ure to relate the variables considered to the probabil-ity that a specimen experiences yielding of the rebar (p) instead of having the bar pulled out. The proba-bility of splitting cannot be properly analyzed on the basis of the results presented herein because it has occured in only one out of the nine combinations tested (see Table 4) and therefore any analysis would conclude that splitting is expected to occur only in that case, which is unlikely.
Since cover/diameter ratio (C/D) is usually as-sumed to determine mode of failure, a model where the effect of such ratio is affected by any other vari-ables considered (symbolized as ) seems an appro-priate point of departure:
p
1- p=exp Y 0+ Y × C D
æ
è
ç öø÷ (1)
However, concrete cover is not considered as such in this research but the type of bottle deter-mines differences regarding concrete section and particularly concrete cover. As a result, the follow-ing equivalent formulation for C/D is proposed:
C
D=
(
C1+C2B2+C3B3)
× 1D (2)
where D is the rebar diameter, expressed in mm; C1, C2, and C3 are coefficients to be adjusted; B2 is a
Boolean variable which equals 1 when the bottle is type 2, and 0 otherwise; and B3 is a Boolean variable
which equals 1 when the bottle is type 3, and 0 oth-erwise.
The function modifies the effect of C/D and is defined in terms of other variables:
Y =
y
1fC+y
2R+y
3G (3)where 1, 2, and 3 are coefficients to be
ad-justed; fC is the specified compressive strength of
concrete, in MPa; R is a Boolean variable which equals 1 when the rebar is corroded, otherwise it equals 0; and G is a Boolean variable which equals 1 when it is greasy, otherwise it equals 0.
Once the model is adjusted to the experimental observations in this research, significance tests are carried out on estimates for the coefficients, and the model is simplified by stepwise regression (Hair 2009) to include only statistically significant effects. The following expression is obtained:
p
1- p=exp - 10.37+
3.14fC- 52.56G D
æ
è
ç öø÷ (4)
When it comes to determine the probability of having yielding of the rebar, the differences between the types of bottle considered are not significant. It has also been detected that having the rebar corroded does not make any difference, while having it greasy does. The accuracy of the model cannot be signifi-cantly improved by any other alternative model (p-value for residuals 1.0000 >> 0.05), which is a good result. The two effects considered are significant (p-values 0.0000 in both cases).
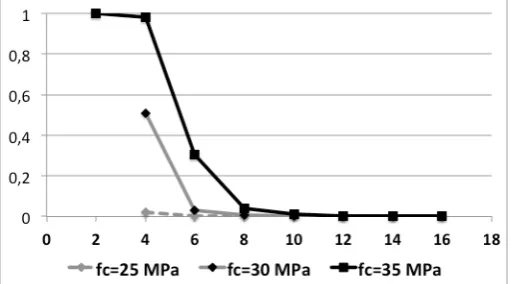
Figure 5 shows the probability of rebar yielding vs rebar diameter for three different values of com-pressive strength, assuming that the bar is not greasy. The choice of what rebar diameter is more convenient to perform the test can be reasoned on the basis of Figure 5, where three hypothetical com-pressive strength values of 25, 30, and 35 MPa have been considered to illustrate the model which fol-lows expression (4).
Figure 5. Probability of rebar yielding vs rebar diameter for different compressive strength values (rebar not greasy).
If 8-mm rebars are chosen for the test, when yielding occurs nothing can be clearly said about compressive strength of the concrete batch being tested, since compressive strengths of 25, 30, or 35 MPa are very likely to lead to rebar yielding indis-tinguishably. Performing the test with rebars of 10 mm implies that, if yielding occurs, a specified compressive strength of 35 MPa can be assumed, though this is going to be false in 35% of cases.
Choosing 12-mm rebars has the advantage of yielding not being very likely and theoretically the occurence of confused cases is no more than 20%. However, the only case where splitting has occured involves a 12-mm rebar (see Tables 2 and 4), and therefore a diameter of 12 mm is probably not a good choice.
[image:6.595.307.562.328.472.2]Figure 6, when compared to Figure 5, clearly shows to what extent the situation is different when a greasy rebar is used: at any rate yielding is likely to occur under such circumstances (considering only commercial diameters, the probability of rebar yield-ing is never greater than 0.05). As a consequence, using greasy rebars might be an alternative to aim at a better classification capacity of the test, though this would require further data to be confirmed.
Figure 6. Probability of rebar yielding vs rebar diameter for different compressive strength values (greasy rebar).
4.3 Transforming APULOT test results to concrete compressive strength values.
When no rebar yielding occurs, the output of the APULOT test is the bond strength value obtained when pulling out the rebar, BOT, expressed in MPa.
In order to have such values related to compressive strength of concrete as obtained from cylindrical specimens, fC, an expression which follows the
gen-eral form of (5) has to be found:
t
BOT = G ×fC (5)where is a function of several variables differ-ent than fC, thus introducing the idea that the relation
between BOT and fC depends on parameters derived
from test setup and conditions.
Since cover/diameter ratio (C/D) is of capital im-portance, it is reasonable to define function as:
G =g 0+
(
g 1+g 2R+g 3G)
×C
D (6)
where R, G are Boolean variables related to the state of the rebar used as defined in section 4.2. As already explained in section 4.2, C/D is expressed in terms of variables used in this research and therefore (6) is rewritten as follows:
G =g 0+
(
g 1+g 2R+g 3G)
×C1+C2B2+C3B3
D (7)
Once the model is adjusted to the experimental observations in this research, i.e. coefficients esti-mated by least squares fitting, significance tests are carried out on these estimates. The model is then simplified by stepwise regression (Hair 2009) to
in-clude only statistically significant effects, and the following expression is obtained:
t BOT
fC =K
-2.278
D (8)
where D is the rebar diameter expressed in mm, and K is a constant whose value depends on the state of the rebar used: 0.606 for clean rebar, 0.474 for greasy rebar, and 0.678 for rusty rebar.
The fitted model is highly accurate, having a R-squared value of 90.12%. Therefore, equation (8) represents a very simple and quite accurate way of estimating concrete's compressive strength (fC) from
the bond strength value obtained in the APULOT test (BOT), which is a step forward to the
implemen-tation of the latter as an alternative to the former. However, the aforementioned R-squared value is calculated for the parameter that equation (8) pre-dicts, i.e. the relation of observed vs predicted values of the ratio BOT/fC. If equation (8) is applied to the
dataset this analysis is based upon, pairs of predicted fC vs observed fC are obtained. They are shown in
Figure 7, together with the 95%-confidence limits (dotted lines).
Figure 7. Predicted vs observed values for compressive strength of concrete.
The R-squared value corresponding to the regres-sion line in Figure 7 which relates predicted and ob-served values of compressive strength of concrete is 73.66%, which stands for a more direct measure of the accuracy of equation (8) as a tool for quality control than the R-squared measuring the accuracy of prediction in terms of BOT/fC ratio.
This can be judged from another point of view as well. The mean squared error obtained for predicted fC values in relation to the line fitted in Figure 6 is
18.07, and therefore an estimate for the standard de-viation of predicted fC values with respect to
ob-served fC values is 18.070.5 = 4.25 MPa. Since the
average of the observed fC values is 33.6 MPa, it
fol-lows that the relative standard deviation of predicted fC values with respect to their corresponding
[image:7.595.33.289.159.301.2] [image:7.595.308.563.359.516.2]strength are considered satisfactory for most situa-tions (ACI Committee 214 2011), it can be consid-ered that the bottle test together with equation (8) constitute as accurate a tool for concrete's quality control as the testing of cylindrical specimens.
5 SUMMARY & CONCLUSIONS
The APULOT test, or bottle test, is an economi-cal and simple alternative to conventional quality control of concrete. It is based on relating bond strength to concrete compressive strength.
A particular methodology for the test has been proposed concerning general dimensions of bottle specimens, mounting of bottle moulds, fixing of rebars, and casting of concrete.
A series of tests have been performed to study the effect that rebar diameter, the state of its surface (clean, rusty, or greasy) and the use of different bottles as moulds have on bond strength values as obtained in APULOT test.
No differences have been found among the three different types of bottle considered in this re-search.
Rebar yielding prevents any relation from being established to concrete compressive strength. Therefore the discriminatory power of the test is lost when rebar yielding occurs.
An expression to predict the probability of rebar yielding has been obtained. It has been found that it is affected by rebar diameter and the state of the rebar surface.
An expression which accurately relates bond strength in the bottle test (BOT) to concrete
com-pressive strength (fC) has been obtained.
Together with the expression obtained to relate BOT to fC, the bottle test proves to be as reliable a
tool as testing cylindrical specimens for quality control of concrete.
6 REFERENCES
ACI Committee 214. 2011. 214R-11 Guide to Evaluation of Strength Test Results of Concrete. American Concrete In-stitute.
do Vale Silva, B. 2010. Investigaçao do potencial dos ensaios APULOT e pull-out para estimativa da resistência a com-pressao do concreto. MSc dissertation, Universidade Es-tadual Paulista "Júlio de Mesquita Filho" UNESP, Brazil. do Vale Silva, B., Pinto Barbosa, M., Pinto da Silva, L.,
Lor-rain, M. & dal Bosco, V.I. 2011. Correlaçao entre a tensao última de aderência e a resistência do concreto usando ensaio "APULOT": avaliaçao do efeito de variaçao do co-brimento do concreto ao redor da barra de aço. In Anais do 53º Congresso Brasileiro do Concreto CBC2011, Floria-nópolis, November 2011.
EN 10080:2005. Steel for the reinforcement of concrete - Weldable reinforcing steel - General. Ed. by CEN European Committee for Standardization.
EN 197-1:2011. Cement - Part 1: Composition, specifications and conformity criteria for common cements. Ed. by CEN European Committee for Standardization.
FIB Féderation Internationale du Béton, ed. 2000. FIB Bulletin No. 10: Bond of Reinforcement in Concrete. Lausanne, Switzerland.
Hair, J., Black, W., Babin, B. & Anderson, R. 2009. Multivari-ate Data Analysis. Prentice Hall.
Kleinbaum, D. & Klein, M. 2010. Logistic Regression: A Self-Learning Text. Springer.
Lorrain, M. & Barbosa, M. 2008. Controle de qualidade dos concretos estruturais: ensaio de aderência aço-concreto. Re-vista Concreto July-Aug-Sept 2008: 55-60.
Lorrain, M., Pinto-Barbosa, M. & Arnaud, M. 2010. Bond test and on-site structural concrete quality control. In Proceed-ings of the 3rd fib International Congress, Washington, 2010.
Montgomery, D. 2009. Design and Analysis of Experiments. John Wiley & Sons.